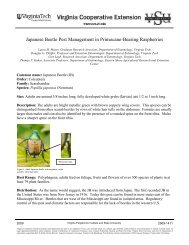
Insect Pest Management in Virginia Cotton, Peanut, and Soybean
Insect Pest Management in Virginia Cotton, Peanut, and Soybean
Insect Pest Management in Virginia Cotton, Peanut, and Soybean

Create successful ePaper yourself
Turn your PDF publications into a flip-book with our unique Google optimized e-Paper software.
Table 64. Mean number of larvae per 3-ft beat cloth sample <strong>and</strong> percent control 1 , PT11-CEW-2 (Mike Grizzard farm,<br />
Southampton Co., VA). Tidewater AREC, Suffolk, VA, 2011. <strong>Insect</strong>icide treatments were applied on August 16.<br />
Aug 18 2 Aug 22<br />
# Material Rate<br />
Small<br />
larvae<br />
Medium<br />
larvae<br />
Large<br />
larvae<br />
Total<br />
larvae<br />
Small<br />
larvae<br />
Medium<br />
larvae<br />
Large<br />
larvae<br />
Total<br />
larvae % control<br />
1 Prevathon 0.43SC 9.8 oz/A 2.75 4.00 2.50 a-d 9.25 ab 0.00 b 1.00 b 0.00 b 1.00 b 53.4<br />
2 Prevathon 0.43SC 13.4 oz/A 2.00 1.75 3.25 ab 7.00 bc 0.25 b 0.25 b 0.00 b 0.50 b 65.9<br />
3 Coragen 1.67SC 5 oz/A 0.75 4.25 1.00 d 6.00 bc 0.00 b 0.00 b 0.25 b 0.25 b 71.6<br />
4 Prevathon 0.43SC<br />
+ Asana XL<br />
4.15 oz/A<br />
4.75 oz/A<br />
0.75 2.25 1.25 cd 4.25 c 0.00 b 0.00 b 0.25 b 0.25 b 79.5<br />
5 Belt 4SC 2 oz/A 2.00 3.75 3.00 a-c 8.75 bc 0.25 b 1.00 b 0.00 b 1.25 b 54.5<br />
6 Steward 1.25EC 4.6 oz/A 1.75 2.75 3.00 a-c 7.50 bc 0.25 b 0.25 b 1.00 b 1.50 b 59.1<br />
7 Exirel 10SE<br />
+ MSO<br />
8 Exirel 10SE<br />
+ MSO<br />
13.57 oz/A<br />
0.25% v/v<br />
20.67 oz/A<br />
0.25% v/v<br />
1.25 3.75 1.50 b-d 6.50 bc 0.25 b 0.75 b 0.00 b 1.00 b 65.9<br />
1.25 3.25 1.25 cd 5.75 bc 0.00 b 0.50 b 0.00 b 0.50 b 71.6<br />
9 Untreated 2.00 7.50 4.00 a 13.50 a 2.25 a 2.75 a 3.50 a 8.50 a ---<br />
LSD NS NS 1.76 4.67 0.68 1.28 1.66 2.17 ---<br />
Means with<strong>in</strong> a column followed by the same letter(s) are not significantly different (Protected LSD, P=0.05).<br />
1 Percent control is based on cumulative larval days (CLD) <strong>in</strong> the treatment relative to the untreated control. CLD’s are calculated with the follow<strong>in</strong>g equation:<br />
Σ (X i+1 – X i )[(Y i + Y i+1 )/2], where X i <strong>and</strong> X i+1 are adjacent sample dates <strong>and</strong> Y i <strong>and</strong> Y i+1 are correspond<strong>in</strong>g po<strong>in</strong>ts of total larvae per 3-ft beat cloth sample.<br />
There were 44.0 CLD’s <strong>in</strong> the untreated control.<br />
2 Larval numbers were multiplied by 2 <strong>in</strong> the untreated control on August 18.