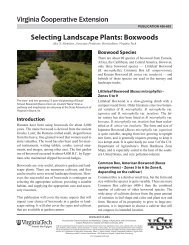
Table 78. Corn earworm survey of field corn <strong>in</strong> Virg<strong>in</strong>ia, 2011. County # Fields # Ears Sampled % Ears Infested Field type(s) Eastern Shore Accomack 5 250 36.8 R<strong>and</strong>om sample Northampton 5 250 24.8 1 Bt, 4 r<strong>and</strong>om sample Regional avg. % 30.8 Mid-Eastern Charles City 5 250 30.0 R<strong>and</strong>om sample Essex 5 250 9.2 4 Bt, 1 r<strong>and</strong>om sample Gloucester 5 250 21.2 R<strong>and</strong>om sample Henrico 5 250 22.4 R<strong>and</strong>om sample K<strong>in</strong>g <strong>and</strong> Queen 5 250 23.2 R<strong>and</strong>om sample K<strong>in</strong>g William 5 250 22.8 R<strong>and</strong>om sample Mathews 5 250 19.2 R<strong>and</strong>om sample Middlesex 5 250 43.6 R<strong>and</strong>om sample New Kent 5 250 29.2 R<strong>and</strong>om sample Regional avg. % 24.5 Southeast Chesapeake 5 250 29.2 5 Bt D<strong>in</strong>widdie 3 150 50.0 3 Non-Bt Greensville 5 250 86.8 R<strong>and</strong>om sample Isle of Wight 5 200 57.6 1 Bt, 1 non-Bt, 3 r<strong>and</strong>om sample Pr<strong>in</strong>ce George 5 250 49.6 4 Non-Bt, 1 r<strong>and</strong>om sample Southampton 5 250 76.0 R<strong>and</strong>om sample Suffolk 5 250 60.0 R<strong>and</strong>om sample Surry 5 250 6.4 2 Bt, 3 r<strong>and</strong>om sample Sussex 5 200 40.0 3 Bt, 2 non-Bt Virg<strong>in</strong>ia Beach 5 250 20.0 R<strong>and</strong>om sample Regional avg. % 47.6 Northern Neck Lancaster 5 250 6.4 R<strong>and</strong>om sample Northumberl<strong>and</strong> 5 250 18.4 R<strong>and</strong>om sample Richmond 5 250 28.8 R<strong>and</strong>om sample Westmorel<strong>and</strong> 5 250 26.8 R<strong>and</strong>om sample Regional avg. % 20.1 Northern Carol<strong>in</strong>e 5 250 24.8 R<strong>and</strong>om sample K<strong>in</strong>g George 5 250 27.6 R<strong>and</strong>om sample Regional avg. % 26.2 State average 33.0% 153
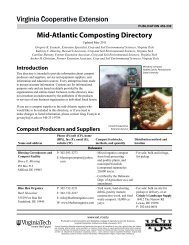
Table 79. Results of the 2011 Virg<strong>in</strong>ia soybean <strong>in</strong>secticide usage survey. Acres <strong>in</strong> region Corn earworm-1 Corn earworm-2 BMSB (entire field) BMSB (edge treatment) Native st<strong>in</strong>k bug-1 Estimated acreage treated for: 1 Native st<strong>in</strong>k bug-2 <strong>Soybean</strong> aphid Green cloverworm District NORTHERN Rock<strong>in</strong>gham, Augusta, Rockbridge 10,858 0 0 0 43 0 0 0 0 0 0 0 0 0 3,400 150 3,443 0 400 Shen<strong>and</strong>oah, Page, Clarke, Frederick, & Warren 6,000 0 0 0 200 0 0 0 0 0 0 0 0 0 0 2,000 200 0 200 CENTRAL 0 Culpeper 6,000 0 0 0 50 0 0 100 0 0 0 200 0 0 0 500 350 . . Orange 4,600 0 0 1,200 300 0 0 0 0 0 0 300 0 0 0 600 1,800 800 250 EASTERN 0 Eastern Shore 0 Northampton 20,000 18,000 5,000 0 0 5,000 0 0 0 0 0 0 0 0 9,000 18,000 37,000 2,000 Mid-Eastern 0 Essex, K<strong>in</strong>g <strong>and</strong> Queen, & K<strong>in</strong>g William 54,500 35,000 0 0 0 0 0 0 0 0 0 0 500 0 0 40,000 35,500 4,000 500 Gloucester 10,000 6,000 1,500 0 0 1,000 0 0 0 500 0 0 0 0 0 7,000 9,000 1,500 400 Mathews 3,000 1,500 500 0 0 100 0 0 0 100 0 0 0 0 0 2,000 2,200 500 250 Middlesex 9,000 6,000 1,000 0 0 500 0 0 0 500 0 0 0 0 0 6,000 8,000 2,000 500 Southeast 0 Chesapeake 24,285 23,000 3,000 0 0 2,000 0 0 0 0 0 0 0 300 0 10,000 28,300 0 0 D<strong>in</strong>widdie 16,000 6,000 2,000 0 0 2,000 1,000 0 1,000 0 0 200 0 0 0 1,000 12,200 2,000 2,000 Isle of Wight 17,025 8,512 8,512 0 0 0 0 0 0 0 0 0 0 0 0 12,768 17,024 0 0 Pr<strong>in</strong>ce George 10,500 2,500 0 0 0 1,000 0 0 200 0 0 100 0 0 0 9,500 3,800 500 0 Southampton 24,788 21,000 3,500 0 0 2,500 0 0 500 0 0 0 0 4,500 0 18,000 32,000 1,500 500 Surry 18,500 10,000 Sussex 24,500 5,500 400 0 0 0 0 0 0 0 0 175 0 0 0 12,000 6,075 760 0 Virg<strong>in</strong>ia Beach 13,284 12,500 2,500 0 0 800 0 0 0 500 0 0 0 200 0 9,000 16,500 0 0 GRAND TOTAL 272,840 145,512 27,912 1,200 593 14,900 1,000 100 1,700 1,600 0 975 500 5,000 10,900 158,518 213,392 13,560 7,000 1 Corn earworm-1 <strong>and</strong> Native st<strong>in</strong>k bug-1= acres treated once for the pest; Corn earworm-2 <strong>and</strong> Native st<strong>in</strong>k bug-2= acres treated twice for the pest; BMSB = brown marmorated st<strong>in</strong>k bug. 2 Other pests <strong>and</strong>/or species complexes consisted of the follow<strong>in</strong>g: Rock<strong>in</strong>gham/Augusta/Rockbridge—grasshopper, bean leaf beetle, <strong>and</strong> green cloverworm; Northampton—defoliators (7,500 acres) <strong>and</strong> beet armyworm (1,500 acres). 3 Treated acreage may exceed actual acreage due to some acres be<strong>in</strong>g treated more than once. Spider mite Bean leaf beetle Grasshopper Thrips <strong>Soybean</strong> looper Other pests <strong>and</strong>/or complex 2 Acres scouted Acres treated 3 Acres over-treated Acres undertreated
- Page 1 and 2:
2011 Insect Pest Management in Virg
- Page 3 and 4:
ACKNOWLEDGMENTS The authors wish to
- Page 5 and 6:
INDEPENDENT CROP CONSULTANTS Chad H
- Page 7 and 8:
Contents Acknowledgments ..........
- Page 9 and 10:
Climatological Summary of the 2011
- Page 11 and 12:
Table 2. Daily precipitation (inche
- Page 13 and 14:
Table 3. Soil types, nutrient analy
- Page 15 and 16:
Test: CT11-THP-Regional-Irrigated,
- Page 17 and 18:
Table 4. Thrips injury ratings 1 ,
- Page 19 and 20:
Table 6. Plant height 1 , number of
- Page 21 and 22:
Test: CT11-THP-Regional-Dryland, Ef
- Page 23 and 24:
Table 8. Thrips injury ratings 1 ,
- Page 25 and 26:
Table 10. Plant height 1 , number o
- Page 27 and 28:
Test: CT11-THP-Regional-Foliar, Eff
- Page 29 and 30:
Table 12. Thrips injury ratings 1 ,
- Page 31 and 32:
Table 14. Plant height 1 , number o
- Page 33 and 34:
Test: CT11-THP-Regional-Eastern, Va
- Page 35 and 36:
Table 16. Thrips injury ratings and
- Page 37 and 38:
Test: CT11-THP-Bayer, Evaluation of
- Page 39 and 40:
Table 19. Thrips injury ratings and
- Page 41 and 42:
Test: CT11-THP-Dow, Efficacy of fol
- Page 43 and 44:
Table 21. Stand counts, thrips inju
- Page 45 and 46:
Test: CT11-THP-PHY, Test to evaluat
- Page 47 and 48:
Table 23. Stand counts, thrips inju
- Page 49 and 50:
Table 24. Stand counts, number of n
- Page 51 and 52:
Table 26. Mean number of thrips per
- Page 53 and 54:
Treatment application(s): Liquid in
- Page 55 and 56:
Table 28. Mean number of thrips per
- Page 57 and 58:
Table 29. Stand counts, plant heigh
- Page 59 and 60:
Treatment application(s): Broadcast
- Page 61 and 62:
Treatment means (% bollworm damage,
- Page 63 and 64:
Table 31. Percent external bollworm
- Page 65 and 66:
Table 32. Percent external bollworm
- Page 67 and 68:
Test: CT11-BW4, Efficacy of selecte
- Page 69 and 70:
Table 34. Percent external bollworm
- Page 71 and 72:
Lint 2 Table 35. Percent external b
- Page 73 and 74:
Table 36. Percent external bollworm
- Page 75 and 76:
Table 37. Percent external bollworm
- Page 77 and 78:
Treatment application(s): Broadcast
- Page 79 and 80:
Test: CT11-SBUG-Valent, Evaluation
- Page 81 and 82:
Table 39. Percent internal boll dam
- Page 83 and 84:
Table 40. Percent internal boll dam
- Page 85 and 86:
Table 41. Percent internal boll dam
- Page 87 and 88:
Test: PT11-THP-1, Evaluation of in-
- Page 89 and 90:
Table 42. Stand counts, PT11-THP-1.
- Page 91 and 92:
Table 44. Mean number of thrips per
- Page 93 and 94:
Test: PT11-THP-2, Evaluation of liq
- Page 95 and 96:
Table 46. Stand counts and yield, P
- Page 97 and 98:
Table 48. Mean number of thrips per
- Page 99 and 100:
Treatment application(s): Liquid in
- Page 101 and 102:
Table 50. Thrips injury ratings 1 ,
- Page 103 and 104: Treatment application(s): Broadcast
- Page 105 and 106: Table 52. Thrips injury ratings 1 ,
- Page 107 and 108: Test: PT11-THP-Syngenta-1, Evaluati
- Page 109 and 110: Table 54. Stand counts and thrips i
- Page 111 and 112: Table 56. Tomato spotted wilt virus
- Page 113 and 114: Treatment application(s): Granular
- Page 115 and 116: Table 58. Mean number of thrips per
- Page 117 and 118: Test: PT11-THP-VA Lines, Evaluation
- Page 119 and 120: Table 61. Thrips injury ratings and
- Page 121 and 122: Table 62. Stand counts on May 19 an
- Page 123 and 124: Table 63. Mean number of larvae per
- Page 125 and 126: Treatment application(s): Full cove
- Page 127 and 128: Test: PT11-CEW-3, Evaluation of fol
- Page 129 and 130: Table 65. Mean number of larvae per
- Page 131 and 132: Table 66. Southern corn rootworm me
- Page 133 and 134: Test: SB11-SEED-1, Evaluation of se
- Page 135 and 136: Table 68. Thrips injury ratings 1 a
- Page 137 and 138: Table 69. Stand counts, thrips coun
- Page 139 and 140: Test: SB11-BMSB-1, Efficacy of foli
- Page 141 and 142: Table 71 (continued). Mean number o
- Page 143 and 144: Table 72. Mean number of brown marm
- Page 145 and 146: Table 73. Mean number of brown marm
- Page 147 and 148: Table 74. Mean number of larvae per
- Page 149 and 150: Table 75. Mean number of larvae per
- Page 151 and 152: Table 76. Mean number of larvae per
- Page 153: Table 77. Mean number of insects pe
- Page 157 and 158: Figure 1. Corn earworm regression.