Adjustment of Cotton Fiber Length by the Statistical Normal ...
Adjustment of Cotton Fiber Length by the Statistical Normal ...
Adjustment of Cotton Fiber Length by the Statistical Normal ...

Create successful ePaper yourself
Turn your PDF publications into a flip-book with our unique Google optimized e-Paper software.
10<br />
ML 1 =ML 2 =24<br />
σ 1 = 4<br />
28<br />
ML 1 =20<br />
σ 1 = σ 2 =6<br />
ML 2<br />
σ 2<br />
4<br />
20<br />
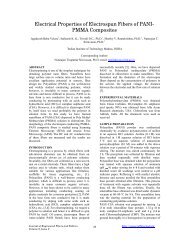
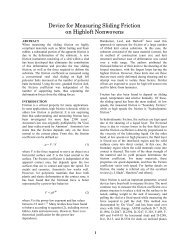
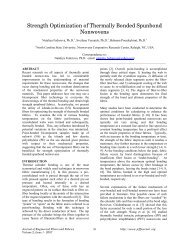
FIGURE 22. Variation <strong>of</strong> blend II SL 2,5% versus x<br />
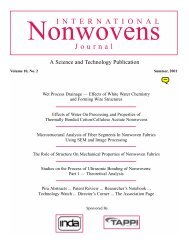
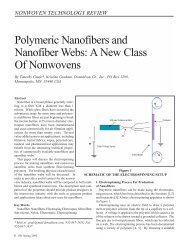
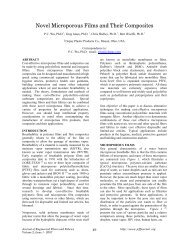
FIGURE 25. Variation <strong>of</strong> blend I UR% versus x<br />
28<br />
ML 1 =20<br />
σ 1 = σ 2 =6<br />
4<br />
ML 2<br />
σ 2<br />
20<br />
10<br />
ML 1 =ML 2 =24<br />
σ 1 = 4<br />
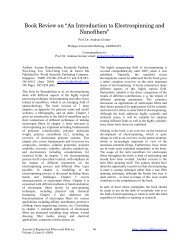
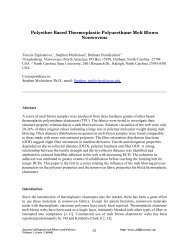
FIGURE 23. Variation <strong>of</strong> blend I UI% versus x<br />
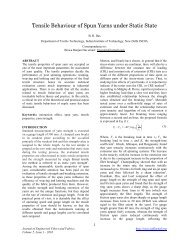
FIGURE 26. Variation <strong>of</strong> blend II UR% versus x<br />
σ 2<br />
4<br />
10<br />
ML 1 =ML 2 =24<br />
σ 1 = 4<br />
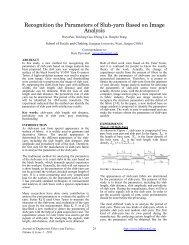
FIGURE 24. Variation <strong>of</strong> blend II UI% versus x<br />
Figures 19 and 20 show that for <strong>the</strong> type I and type II<br />
<strong>of</strong> blends <strong>the</strong> variation <strong>of</strong> SL50% versus x is linear.<br />
Figures 13, 15, 17 and 21 show that in <strong>the</strong> case <strong>of</strong> <strong>the</strong><br />
type I <strong>of</strong> blend <strong>the</strong> variation <strong>of</strong> UQL, UHML, UQML<br />
and SL2,5% become more to more nonlinear when<br />
<strong>the</strong> difference between <strong>the</strong> two mean lengths is<br />
important. These figures show also that <strong>the</strong> variation<br />
curve <strong>of</strong> <strong>the</strong> blend parameter, for example UQL, <strong>of</strong><br />
<strong>the</strong> blend is upstairs <strong>of</strong> <strong>the</strong> linear line that relates <strong>the</strong><br />
two components UQL. Then <strong>the</strong> blend parameter<br />
UQL is greater than <strong>the</strong> value xUQL 1 + (1-x) UQL 2 .<br />
In <strong>the</strong> case <strong>of</strong> type II <strong>of</strong> blend, Figures 16 and 18<br />
show that <strong>the</strong> variation <strong>of</strong> UHML and UQML is<br />
nearly linear. But <strong>the</strong> variation <strong>of</strong> UQL and SL2,5%<br />
shown in Figures 14 and are nonlinear mainly when<br />
<strong>the</strong> difference between <strong>the</strong> two standard deviation is<br />
important. The UQL <strong>of</strong> <strong>the</strong> blend is less than <strong>the</strong><br />
value xUQL1+ (1-x) UQL2. But <strong>the</strong> SL2,5% <strong>of</strong> <strong>the</strong><br />
blend is greater than xSL2,5%1+ (1-x )SL2,5%2<br />
The variation <strong>of</strong> UI% (Figure 23) is nonlinear in <strong>the</strong><br />
case <strong>of</strong> type I <strong>of</strong> blend and it less than xUI%1+ (1-x)<br />
UI%2 it can be less than <strong>the</strong> minimum value <strong>of</strong><br />
Journal <strong>of</strong> Engineered <strong>Fiber</strong>s and Fabrics<br />
Volume 3, Issue 3 - 2008<br />
44<br />
http://www.jeffjournal.org