Adjustment of Cotton Fiber Length by the Statistical Normal ...
Adjustment of Cotton Fiber Length by the Statistical Normal ...
Adjustment of Cotton Fiber Length by the Statistical Normal ...

Create successful ePaper yourself
Turn your PDF publications into a flip-book with our unique Google optimized e-Paper software.
100<br />
UI%<br />
= 100×<br />
100 + 0.<br />
8CV%<br />
(35)<br />
⎛<br />
⎞<br />
⎜<br />
1 − 12.<br />
7 / ML<br />
SFC % = 50 − 100erf 100<br />
⎟<br />
⎝ 2CV%<br />
⎠<br />
(36)<br />
(mm)<br />
42<br />
40<br />
38<br />
36<br />
11<br />
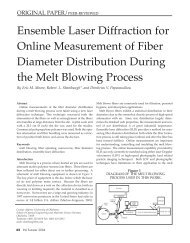
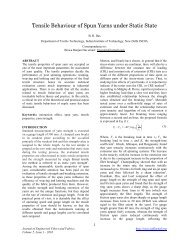
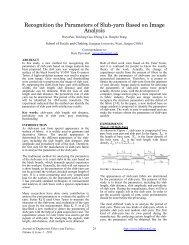
For 50%, 2.5% span lengths and UR%, analytic<br />
equations expressing <strong>the</strong>m according to ML and CV%<br />
could not be found. Numerical solutions are <strong>the</strong>refore<br />
generated <strong>by</strong> solving <strong>the</strong> equation (19) for t equal to<br />
50 and t equal to 2,5 and UR% is obtained <strong>by</strong> using<br />
<strong>the</strong> relationship given <strong>by</strong> <strong>the</strong> equation (23). The<br />
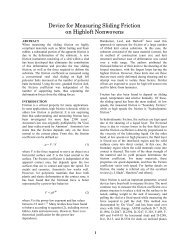
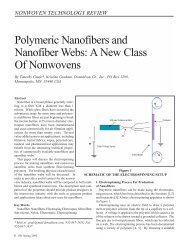
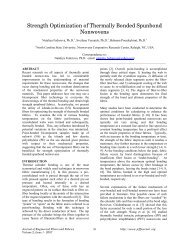
Figures 5, 6, 7, 8, 9 and 10 show <strong>the</strong> variation <strong>of</strong><br />
SL 50% , SL 2,5% and UR% versus ML and σ.<br />
15<br />
14<br />
SL2,5%<br />
34<br />
32<br />
30<br />
28<br />
26<br />
24<br />
σ(mm)<br />
22<br />
18 20 22 24 26 28<br />
ML<br />
5<br />
(mm)<br />
FIGURE 7. Variation <strong>of</strong> SL 2,5% % versus ML for different σ levels<br />
SL50% (mm)<br />
13<br />
12<br />
11<br />
10<br />
11<br />
σ(mm)<br />
5<br />
(mm)<br />
SL2,5%<br />
42<br />
40<br />
38<br />
36<br />
34<br />
32<br />
30<br />
28<br />
ML<br />
(mm)<br />
9<br />
18 19 20 21 22 23 24 25 26 27 28<br />
ML<br />
(mm)<br />
FIGURE 5. Variation <strong>of</strong> SL 50% versus ML for different σ levels<br />
28<br />
26<br />
24<br />
18<br />
(mm)<br />
SL50%<br />
15<br />
14<br />
13<br />
12<br />
28<br />
ML<br />
(mm)<br />
22<br />
5 6 7 8 9 10 11<br />
σ(mm)<br />
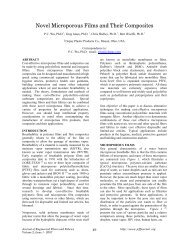
FIGURE 8. Variation <strong>of</strong> SL 2,5% versus σ for different ML levels<br />
11<br />
σ(mm)<br />
10<br />
18<br />
9<br />
5 6 7 8 9 10 11<br />
σ(mm)<br />
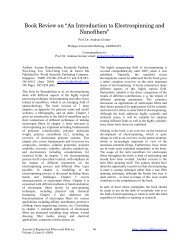
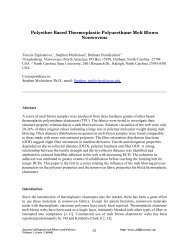
FIGURE 6. Variation <strong>of</strong> SL<br />
50%<br />
versus σ for different ML levels<br />
(mm)<br />
FIGURE 9. Variation <strong>of</strong> UR% versus ML for different σ levels<br />
Journal <strong>of</strong> Engineered <strong>Fiber</strong>s and Fabrics<br />
Volume 3, Issue 3 - 2008<br />
40<br />
http://www.jeffjournal.org