market watch office space - Transwestern
market watch office space - Transwestern
market watch office space - Transwestern

Create successful ePaper yourself
Turn your PDF publications into a flip-book with our unique Google optimized e-Paper software.
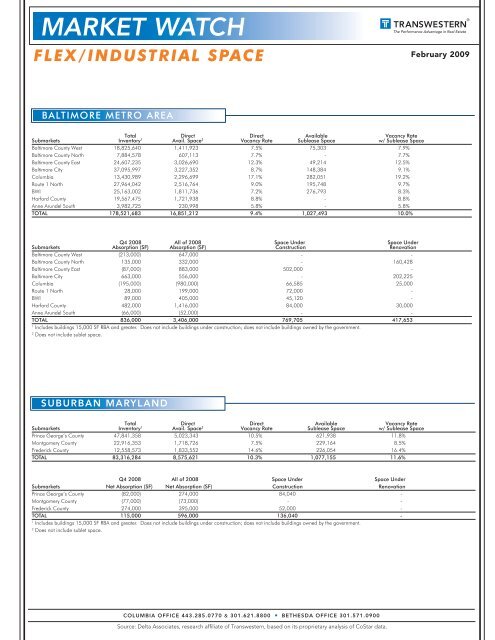
MARKET WATCH<br />
FLEX/INDUSTRIAL SPACE<br />
February 2009<br />
BALTIMORE METRO AREA<br />
Total Direct Direct Available Vacancy Rate<br />
Sub<strong>market</strong>s Inventory 1 Avail. Space 2 Vacancy Rate Sublease Space w/ Sublease Space<br />
Baltimore County West 18,825,640 1,411,923 7.5% 75,303 7.9%<br />
Baltimore County North 7,884,578 607,113 7.7% - 7.7%<br />
Baltimore County East 24,607,235 3,026,690 12.3% 49,214 12.5%<br />
Baltimore City 37,095,997 3,227,352 8.7% 148,384 9.1%<br />
Columbia 13,430,989 2,296,699 17.1% 282,051 19.2%<br />
Route 1 North 27,964,042 2,516,764 9.0% 195,748 9.7%<br />
BWI 25,163,002 1,811,736 7.2% 276,793 8.3%<br />
Harford County 19,567,475 1,721,938 8.8% - 8.8%<br />
Anne Arundel South 3,982,725 230,998 5.8% - 5.8%<br />
TOTAL 178,521,683 16,851,212 9.4% 1,027,493 10.0%<br />
Q4 2008 All of 2008 Space Under Space Under<br />
Sub<strong>market</strong>s Absorption (SF) Absorption (SF) Construction Renovation<br />
Baltimore County West (213,000) 647,000 - -<br />
Baltimore County North 135,000 332,000 - 160,428<br />
Baltimore County East (87,000) 883,000 502,000 -<br />
Baltimore City 663,000 556,000 - 202,225<br />
Columbia (195,000) (980,000) 66,585 25,000<br />
Route 1 North 28,000 199,000 72,000 -<br />
BWI 89,000 405,000 45,120 -<br />
Harford County 482,000 1,416,000 84,000 30,000<br />
Anne Arundel South (66,000) (52,000) - -<br />
TOTAL 836,000 3,406,000 769,705 417,653<br />
1<br />
Includes buildings 15,000 SF RBA and greater. Does not include buildings under construction; does not include buildings owned by the government.<br />
2<br />
Does not include sublet <strong>space</strong>.<br />
SUBURBAN MARYLAND<br />
Total Direct Direct Available Vacancy Rate<br />
Sub<strong>market</strong>s Inventory 1 Avail. Space 2 Vacancy Rate Sublease Space w/ Sublease Space<br />
Prince George’s County 47,841,358 5,023,343 10.5% 621,938 11.8%<br />
Montgomery County 22,916,353 1,718,726 7.5% 229,164 8.5%<br />
Frederick County 12,558,573 1,833,552 14.6% 226,054 16.4%<br />
TOTAL 83,316,284 8,575,621 10.3% 1,077,155 11.6%<br />
Q4 2008 All of 2008 Space Under Space Under<br />
Sub<strong>market</strong>s Net Absorption (SF) Net Absorption (SF) Construction Renovation<br />
Prince George’s County (82,000) 274,000 84,040 -<br />
Montgomery County (77,000) (73,000) - -<br />
Frederick County 274,000 395,000 52,000 -<br />
TOTAL 115,000 596,000 136,040 -<br />
1<br />
Includes buildings 15,000 SF RBA and greater. Does not include buildings under construction; does not include buildings owned by the government.<br />
2<br />
Does not include sublet <strong>space</strong>.<br />
COLUMBIA OFFICE 443.285.0770 & 301.621.8800 • BETHESDA OFFICE 301.571.0900<br />
Source: Delta Associates, research affiliate of <strong>Transwestern</strong>, based on its proprietary analysis of CoStar data.