market watch office space - Transwestern
market watch office space - Transwestern
market watch office space - Transwestern

Create successful ePaper yourself
Turn your PDF publications into a flip-book with our unique Google optimized e-Paper software.
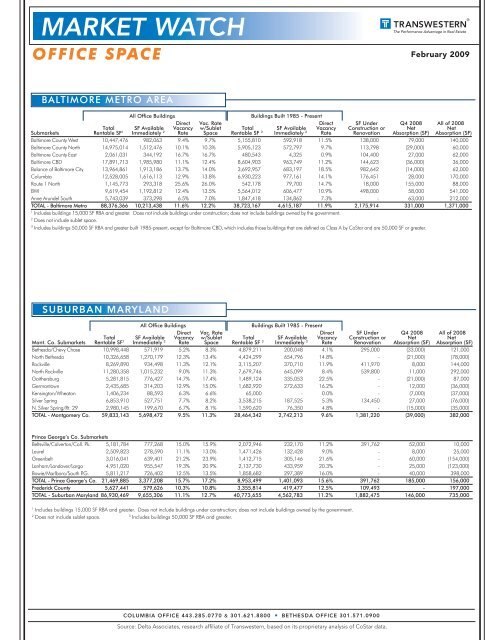
MARKET WATCH<br />
OFFICE SPACE<br />
February 2009<br />
BALTIMORE METRO AREA<br />
All Office Buildings<br />
Buildings Built 1985 - Present<br />
Direct Vac. Rate Direct SF Under Q4 2008 All of 2008<br />
Total SF Available Vacancy w/Sublet Total SF Available Vacancy Construction or Net Net<br />
Sub<strong>market</strong>s Rentable SF 1 Immediately 2 Rate Space Rentable SF 3 Immediately 2 Rate Renovation Absorption (SF) Absorption (SF)<br />
Baltimore County West 10,447,476 982,063 9.4% 9.7% 5,155,810 592,918 11.5% 138,000 79,000 140,000<br />
Baltimore County North 14,975,014 1,512,476 10.1% 10.3% 5,905,123 572,797 9.7% 113,798 (29,000) 60,000<br />
Baltimore County East 2,061,031 344,192 16.7% 16.7% 480,543 4,325 0.9% 104,400 27,000 62,000<br />
Baltimore CBD 17,891,713 1,985,980 11.1% 12.4% 8,604,903 963,749 11.2% 144,623 (36,000) 36,000<br />
Balance of Baltimore City 13,964,861 1,913,186 13.7% 14.0% 3,692,957 683,197 18.5% 982,642 (14,000) 62,000<br />
Columbia 12,528,005 1,616,113 12.9% 13.8% 6,930,223 977,161 14.1% 176,451 28,000 170,000<br />
Route 1 North 1,145,773 293,318 25.6% 26.0% 542,178 79,700 14.7% 18,000 155,000 88,000<br />
BWI 9,619,454 1,192,812 12.4% 13.5% 5,564,012 606,477 10.9% 498,000 58,000 541,000<br />
Anne Arundel South 5,743,039 373,298 6.5% 7.0% 1,847,418 134,862 7.3% - 63,000 212,000<br />
TOTAL - Baltimore Metro 88,376,366 10,213,438 11.6% 12.2% 38,723,167 4,615,187 11.9% 2,175,914 331,000 1,371,000<br />
1<br />
Includes buildings 15,000 SF RBA and greater. Does not include buildings under construction; does not include buildings owned by the government.<br />
2<br />
Does not include sublet <strong>space</strong>.<br />
3 Includes buildings 50,000 SF RBA and greater built 1985-present, except for Baltimore CBD, which includes those buildings that are defined as Class A by CoStar and are 50,000 SF or greater.<br />
SUBURBAN MARYLAND<br />
All Office Buildings<br />
Buildings Built 1985 - Present<br />
Direct Vac. Rate Direct SF Under Q4 2008 All of 2008<br />
Total SF Available Vacancy w/Sublet Total SF Available Vacancy Construction or Net Net<br />
Mont. Co. Sub<strong>market</strong>s Rentable SF 1 Immediately 2 Rate Space Rentable SF 3 Immediately 2 Rate Renovation Absorption (SF) Absorption (SF)<br />
Bethesda/Chevy Chase 10,998,448 571,919 5.2% 8.3% 4,879,211 200,048 4.1% 295,000 (33,000) 121,000<br />
North Bethesda 10,326,658 1,270,179 12.3% 13.4% 4,424,299 654,796 14.8% - (21,000) (78,000)<br />
Rockville 8,269,890 934,498 11.3% 12.1% 3,115,207 370,710 11.9% 411,970 8,000 144,000<br />
North Rockville 11,280,358 1,015,232 9.0% 11.3% 7,679,746 645,099 8.4% 539,800 11,000 292,000<br />
Gaithersburg 5,281,815 776,427 14.7% 17.4% 1,489,124 335,053 22.5% - (21,000) 87,000<br />
Germantown 2,435,685 314,203 12.9% 15.0% 1,682,920 272,633 16.2% - 12,000 (36,000)<br />
Kensington/Wheaton 1,406,234 88,593 6.3% 6.6% 65,000 - 0.0% - (7,000) (37,000)<br />
Silver Spring 6,853,910 527,751 7.7% 8.2% 3,538,215 187,525 5.3% 134,450 27,000 (76,000)<br />
N. Silver Spring/Rt. 29 2,980,145 199,670 6.7% 8.1% 1,590,620 76,350 4.8% - (15,000) (35,000)<br />
TOTAL - Montgomery Co. 59,833,143 5,698,472 9.5% 11.3% 28,464,342 2,742,213 9.6% 1,381,220 (39,000) 382,000<br />
Prince George’s Co. Sub<strong>market</strong>s<br />
Beltsville/Calverton/Coll. Pk. 5,181,784 777,268 15.0% 15.9% 2,072,946 232,170 11.2% 391,762 52,000 10,000<br />
Laurel 2,509,823 278,590 11.1% 13.0% 1,471,426 132,428 9.0% - 8,000 25,000<br />
Greenbelt 3,016,041 639,401 21.2% 23.9% 1,412,715 305,146 21.6% - 60,000 (154,000)<br />
Lanham/Landover/Largo 4,951,020 955,547 19.3% 20.9% 2,137,730 433,959 20.3% - 25,000 (123,000)<br />
Bowie/Marlboro/South P.G. 5,811,217 726,402 12.5% 13.5% 1,858,682 297,389 16.0% - 40,000 398,000<br />
TOTAL - Prince George’s Co. 21,469,885 3,377,208 15.7% 17.2% 8,953,499 1,401,093 15.6% 391,762 185,000 156,000<br />
Frederick County 5,627,441 579,626 10.3% 10.8% 3,355,814 419,477 12.5% 109,493 - 197,000<br />
TOTAL - Suburban Maryland 86,930,469 9,655,306 11.1% 12.7% 40,773,655 4,562,783 11.2% 1,882,475 146,000 735,000<br />
1<br />
Includes buildings 15,000 SF RBA and greater. Does not include buildings under construction; does not include buildings owned by the government.<br />
2<br />
Does not include sublet <strong>space</strong>.<br />
3<br />
Includes buildings 50,000 SF RBA and greater.<br />
COLUMBIA OFFICE 443.285.0770 & 301.621.8800 • BETHESDA OFFICE 301.571.0900<br />
Source: Delta Associates, research affiliate of <strong>Transwestern</strong>, based on its proprietary analysis of CoStar data.
MARKET WATCH<br />
FLEX/INDUSTRIAL SPACE<br />
February 2009<br />
BALTIMORE METRO AREA<br />
Total Direct Direct Available Vacancy Rate<br />
Sub<strong>market</strong>s Inventory 1 Avail. Space 2 Vacancy Rate Sublease Space w/ Sublease Space<br />
Baltimore County West 18,825,640 1,411,923 7.5% 75,303 7.9%<br />
Baltimore County North 7,884,578 607,113 7.7% - 7.7%<br />
Baltimore County East 24,607,235 3,026,690 12.3% 49,214 12.5%<br />
Baltimore City 37,095,997 3,227,352 8.7% 148,384 9.1%<br />
Columbia 13,430,989 2,296,699 17.1% 282,051 19.2%<br />
Route 1 North 27,964,042 2,516,764 9.0% 195,748 9.7%<br />
BWI 25,163,002 1,811,736 7.2% 276,793 8.3%<br />
Harford County 19,567,475 1,721,938 8.8% - 8.8%<br />
Anne Arundel South 3,982,725 230,998 5.8% - 5.8%<br />
TOTAL 178,521,683 16,851,212 9.4% 1,027,493 10.0%<br />
Q4 2008 All of 2008 Space Under Space Under<br />
Sub<strong>market</strong>s Absorption (SF) Absorption (SF) Construction Renovation<br />
Baltimore County West (213,000) 647,000 - -<br />
Baltimore County North 135,000 332,000 - 160,428<br />
Baltimore County East (87,000) 883,000 502,000 -<br />
Baltimore City 663,000 556,000 - 202,225<br />
Columbia (195,000) (980,000) 66,585 25,000<br />
Route 1 North 28,000 199,000 72,000 -<br />
BWI 89,000 405,000 45,120 -<br />
Harford County 482,000 1,416,000 84,000 30,000<br />
Anne Arundel South (66,000) (52,000) - -<br />
TOTAL 836,000 3,406,000 769,705 417,653<br />
1<br />
Includes buildings 15,000 SF RBA and greater. Does not include buildings under construction; does not include buildings owned by the government.<br />
2<br />
Does not include sublet <strong>space</strong>.<br />
SUBURBAN MARYLAND<br />
Total Direct Direct Available Vacancy Rate<br />
Sub<strong>market</strong>s Inventory 1 Avail. Space 2 Vacancy Rate Sublease Space w/ Sublease Space<br />
Prince George’s County 47,841,358 5,023,343 10.5% 621,938 11.8%<br />
Montgomery County 22,916,353 1,718,726 7.5% 229,164 8.5%<br />
Frederick County 12,558,573 1,833,552 14.6% 226,054 16.4%<br />
TOTAL 83,316,284 8,575,621 10.3% 1,077,155 11.6%<br />
Q4 2008 All of 2008 Space Under Space Under<br />
Sub<strong>market</strong>s Net Absorption (SF) Net Absorption (SF) Construction Renovation<br />
Prince George’s County (82,000) 274,000 84,040 -<br />
Montgomery County (77,000) (73,000) - -<br />
Frederick County 274,000 395,000 52,000 -<br />
TOTAL 115,000 596,000 136,040 -<br />
1<br />
Includes buildings 15,000 SF RBA and greater. Does not include buildings under construction; does not include buildings owned by the government.<br />
2<br />
Does not include sublet <strong>space</strong>.<br />
COLUMBIA OFFICE 443.285.0770 & 301.621.8800 • BETHESDA OFFICE 301.571.0900<br />
Source: Delta Associates, research affiliate of <strong>Transwestern</strong>, based on its proprietary analysis of CoStar data.
MARKET WATCH<br />
MARKET ACTIVITY<br />
February 2009<br />
BALTIMORE METRO AREA - OFFICE<br />
Leases<br />
Tenant Address Sq. Ft.<br />
DaimlerChrysler Financial Services Americas (Renewal) 6085 Marshalee Drive 18,000<br />
Investment Sales<br />
No notable sales.<br />
Leases<br />
BALTIMORE METRO AREA - FLEX/INDUSTRIAL<br />
Tenant Address Sq. Ft.<br />
Boise Cascade 7700 Rolling Mill Road (warehouse) 204,000<br />
Turkey Greek Trading Co. 1-208 Azar Court (warehouse) 25,000<br />
The Baltimore Rigging Company, Inc. 8149 Norris Lane (warehouse) 16,000<br />
Transcare Corporation 1125 DeSoto Road (warehouse) 15,000<br />
Investment Sales<br />
No notable sales.<br />
SUBURBAN MARYLAND - FLEX/INDUSTRIAL & OFFICE<br />
Leases<br />
Tenant Address Sq. Ft.<br />
Department of Defense (Renewal) 6340 Columbia Park Road (warehouse) 60,000<br />
SRA International 8490 Progress Drive (<strong>office</strong>) 31,000<br />
Vietnam Veterans of America 8719 Colesville Road (<strong>office</strong>) 17,000<br />
Scientific Hospital Supplies, Inc. (Renewal) 9900 Belward Campus Drive (<strong>office</strong>) 16,000<br />
Bechtel National (Renewal) 7435 New Technology Way (warehouse) 10,000<br />
National Association of Realtors Federal Credit Union 9707 Key West Avenue (<strong>office</strong>) 10,000<br />
Investment Sales<br />
No notable sales.<br />
COLUMBIA OFFICE 443.285.0770 & 301.621.8800 • BETHESDA OFFICE 301.571.0900<br />
Source: Delta Associates, research affiliate of <strong>Transwestern</strong>, based on its proprietary analysis of CoStar data.