Distracted Driving presentation - National Safety Council
Distracted Driving presentation - National Safety Council
Distracted Driving presentation - National Safety Council

You also want an ePaper? Increase the reach of your titles
YUMPU automatically turns print PDFs into web optimized ePapers that Google loves.
<strong>Distracted</strong> t <strong>Driving</strong><br />
i<br />
James A. Solomon<br />
Director<br />
Program Development<br />
And Training<br />
Defensive <strong>Driving</strong><br />
Courses<br />
<strong>National</strong> <strong>Safety</strong><br />
<strong>Council</strong><br />
James.Solomon@nsc.org<br />
June 2011
Thank you to our sponsors:<br />
13%<br />
www.firstgroupamerica.com
The Big Picture
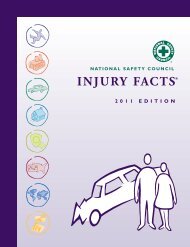
Injury Data Highlights<br />
Injury Facts®<br />
2011 Edition<br />
Most current data<br />
available<br />
– 2009, 2008, or 2007 –<br />
depending on the<br />
source
Unintentional Injuries<br />
# 1 cause of death for people 1 to<br />
42 years old<br />
# 5 cause of death for all ages
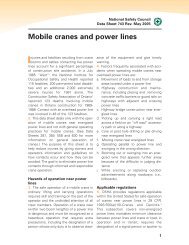
Leading Causes of Death<br />
Heart disease 616,067<br />
Cancer 562,875<br />
Stroke 135,952<br />
Chronic lower respiratory disease<br />
127,924<br />
Unintentional injuries 123,706<br />
Alzheimer’s disease 74,632
Leading Causes of Death<br />
Yea ars<br />
90<br />
80<br />
70<br />
60<br />
50<br />
40<br />
30<br />
20<br />
10<br />
0<br />
11<br />
77<br />
Heart<br />
Disease<br />
10 12<br />
15<br />
40<br />
71<br />
78 76<br />
41<br />
Cancer Stroke CLRD* U-I<br />
Average<br />
Remaining<br />
Lifetime<br />
Average Age<br />
at Death
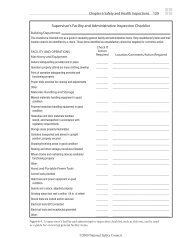
Highway Venue<br />
211 million drivers (+1%)<br />
259 million vehicles (+
40<br />
30<br />
20<br />
10<br />
0<br />
Drivers Involved in Fatal<br />
Crashes, 2009<br />
19 and under<br />
20-24<br />
25-34<br />
35-44<br />
45-54<br />
55-64<br />
65-74<br />
75+<br />
Involveme<br />
ent per 100,000 Dri<br />
vers
Highway <strong>Safety</strong> Issues<br />
Alcohol<br />
– 21 year drinking age in all states<br />
t<br />
and D.C.<br />
– 0.08 BAC threshold in all states<br />
and D.C.<br />
– Zero tolerance for minors in all<br />
states and D.C.
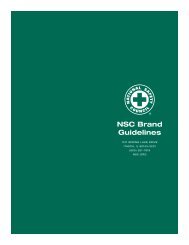
Alcohol<br />
10,839 alcohol-<br />
impaired<br />
deaths<br />
in 2009<br />
32% of deaths<br />
60%<br />
50%<br />
40%<br />
30%<br />
20%<br />
10%<br />
Percent of Alcohol-Impaired<br />
Deaths, 1982-2009<br />
0%<br />
1982<br />
1986<br />
1990<br />
1994<br />
1998<br />
2002<br />
2006<br />
2010
Occupant Protection<br />
12,432 deaths of unrestrained occupants<br />
Down 3% from 12,865 in 2008<br />
49 states & D.C. have mandatory use<br />
laws<br />
85% belt use overall in 2010<br />
88% belt use in “primary” enforcement<br />
states vs. 77% in other states
Young Drivers<br />
Total fatalities in crashes involving 15-20<br />
year old drivers exceeded 5,623 in 2009.<br />
The latest 2007 mortality figures show that<br />
motor-vehicle crashes are the leading cause<br />
of death for 15-20 year olds.<br />
Young driver fatalities account for only<br />
about half of the overall fatalities associated<br />
with young drivers.
Young Drivers<br />
Historical Trend of Young Driver Related Fatalities<br />
12,000<br />
Deaths<br />
10,000<br />
8,000<br />
6,000<br />
4,000<br />
2,000<br />
0<br />
Nonoccupant Fatalities<br />
Occupant Fatalities of all<br />
Other Vehicles<br />
Passenger Fatalities of<br />
Young Drivers<br />
Young Drivers (Age 15 to<br />
20)
<strong>Distracted</strong> <strong>Driving</strong><br />
In 2009, 5,474 people lost their lives and an<br />
estimated 448,000 people were injured in<br />
police reported crashes that involved<br />
distraction (NHTSA).<br />
9% of drivers were using cell phones in 2009.<br />
– Use was highest among young<br />
drivers 16 – 24 years old and<br />
higher among females than<br />
males.
Defensive <strong>Driving</strong><br />
<strong>Driving</strong> to save<br />
lives, time and money<br />
in spite of<br />
the conditions<br />
around you<br />
and<br />
the actions of others
Preventable Collision<br />
A collision<br />
in which the driver<br />
failed to do everything<br />
reasonable<br />
to prevent it<br />
is a<br />
preventable collision.<br />
i
Preventable Collision<br />
A true defensive driver does<br />
everything reasonable to avoid a<br />
crash event, incident, or traffic<br />
violation.<br />
The facts show that the majority<br />
of collisions are preventable.<br />
More important is that violations<br />
More important is that violations<br />
are the cause of most collisions.
Definition: <strong>Distracted</strong><br />
dis-tract-ed d<br />
(dĭ-strāk’-tĭd)<br />
adjective<br />
Having the<br />
attention<br />
divided.<br />
2. Rendered<br />
incapable of<br />
behaving,<br />
reacting, etc.,<br />
in a normal<br />
manner.
WhyWeDONOT<br />
We Use a Cell Phone and Drive!<br />
A distraction is anything that:<br />
Takes your eyes off the road – a<br />
visual distraction.<br />
Takes your mind off the road – a<br />
cognitive distraction.<br />
Takes your hands off the wheel –<br />
manual ldistraction.<br />
i
The Ticking Time Bomb<br />
Scope of the Problem<br />
Nature and Magnitude of the Risk<br />
Comparing the Risk<br />
Implications to Employers
Scope of the Issue<br />
Inattention involved in 78% of all<br />
observed crashes and 66% of all crash<br />
events (crash / near crash).<br />
(Virginia Tech)<br />
9% of drivers are using handheld cell<br />
phones at any one time.<br />
(NHTSA)<br />
236 million cell phone subscribers in the<br />
U.S. (CTIA, May 2007)
Scope of the Issue<br />
73% talked on cell phones while driving<br />
and 19% admitted text messaging while<br />
driving.<br />
(Nationwide Insurance)<br />
2/3 of teens admit to text messaging<br />
while driving; 16% of all cell phone<br />
users.<br />
(Zogby)
Measuring the Risk<br />
Relative risk of cell phone use is similar<br />
to the hazard associated with driving<br />
with a BAC of .08.<br />
(Redelmeier & Tibshirani)<br />
Slower reaction times caused by cell<br />
phone use are comparable to that of a<br />
.08 BAC.<br />
(Strayer)
Measuring the Risk<br />
In an observational study, 75% of cell<br />
phone users committed a traffic violation.<br />
(Strayer)<br />
Cell phone users s are 4 times as likely to be<br />
involved in injury crashes.<br />
(Insurance Institute for Highway <strong>Safety</strong>)<br />
Simulator study showed cell phone users<br />
were5timesmorelikelytobeinacrash<br />
more to in crash.<br />
(Strayer)
Effects on <strong>Driving</strong><br />
It is well established that cell-phone usage<br />
significantly impairs driving performance.<br />
“Inattention blindness” – looking but not<br />
seeing.<br />
(James, Neisser, Simmons)<br />
Drivers talking on a cell phone look but fail<br />
to see up to half of the information in the<br />
driving environment.
Inattention Blindness<br />
The mental images coming<br />
through the eyes to the brain<br />
are overwritten<br />
by the thought images<br />
of the words being<br />
spoken/heard or keyed.
Effects on <strong>Driving</strong><br />
“Dual-task Interference” – Active<br />
engagement g in conversation raises the<br />
impairment.<br />
Attention is withdrawn from the<br />
processing of the information in the<br />
driving environment necessary for safe<br />
operation of the vehicle.<br />
Impairments occur from both hand held<br />
Impairments occur from both hand-held<br />
and hands-free units.
Cell Phones vs.<br />
Other Distractions<br />
Cell phone use is more distracting than<br />
radio broadcasts, books on tape, recorded<br />
conversations and passengers.<br />
(Strayer)<br />
Cell phone use is less distracting than certain<br />
other activities (applying makeup, reaching for<br />
a moving object, reading) but their lower<br />
frequency lowers the involvement in crashes<br />
below that of cell phones.<br />
(Virginia Tech)
Cell Phones vs.<br />
Passenger Conversations<br />
Passengers provide collaborative<br />
problem-solving, shared situation<br />
awareness and active support of the<br />
driver by the passenger.<br />
(Strayer)<br />
Af front seat passenger reduces the risk<br />
of a crash to 38% of that of a cell phone<br />
conversation.<br />
(Virginia Tech)
Hand-Held vs. Hands Free<br />
No difference in the interference from a<br />
hands-free or hand-held conversation.<br />
(Strayer)<br />
– Dialing increases missed signals,<br />
reduces reaction time, and<br />
increases mental workload.<br />
– Conversing is less distracting, but<br />
endures much longer, which<br />
leads to higher crash<br />
involvement.
Other Factors<br />
Significant factors in the magnitude of<br />
the distraction:<br />
– Content of the conversation<br />
– Age of the driver<br />
– Conditions outside the vehicle.
Other Factors<br />
Multiple tasks or distractions are the<br />
most demanding.<br />
– Interaction with music or<br />
navigation systems<br />
– High speed<br />
– Following another vehicle
Text-Messaging: drv + txt = :(<br />
9 out of 10 people believe that text messaging<br />
while driving is dangerous and distracting.<br />
(Harris Interactive & Pinger)<br />
91% of American adults believe that those who<br />
text message while driving are as dangerous<br />
as those who have had a couple alcoholic<br />
drinks.<br />
(Harris Interactive & Pinger)<br />
Almost 80% of crashes and 65% of near<br />
misses occur within three seconds of some<br />
form of driver distraction.<br />
(NHTSA)
Implications for Employers<br />
Injuries to employees; lost time on the<br />
job<br />
– Motor vehicle crashes are the #1<br />
cause of work-related related fatalities<br />
(2,800 in 2006)<br />
– Average cost per crash is $16,500<br />
– Average cost per crash injury:<br />
$74,000
Implications for Employers<br />
Employers are being sued for liability<br />
associated with crashes involving<br />
i<br />
employees conducting company<br />
business on cell phones.<br />
– One recent case settled out of<br />
course for $5,000,000.
Strategies for Employers<br />
Ensure Leadership reflects values & goals of<br />
the Organization<br />
Establish Motor Vehicle Policies that set<br />
expectations<br />
Provide motor vehicle safety Training &<br />
Education that improves skills<br />
Monitor, evaluate, and counsel employee<br />
Performance to improve behavior
Strategies for Employers<br />
Provide your employees with<br />
the knowledge and tools<br />
to use both<br />
ON and OFF<br />
the job.
What’s the Actual Costs<br />
NSC estimates that the<br />
costs of all crashes<br />
attributable to cellular<br />
phone usage is<br />
$13 Billion
Off vs On the Job Injuries – 2:7<br />
8<br />
6<br />
M illions s)<br />
4<br />
8.2<br />
On-the-Job<br />
Off-the-Job<br />
(<br />
2<br />
3.7<br />
0<br />
Disabling Injuries
Off vs On the Job Deaths – 11:1<br />
50,000<br />
40,000<br />
30,000000<br />
20,000<br />
49,300<br />
On-the-Job<br />
Off-the-Job<br />
10,000<br />
0<br />
4961 4,961<br />
Deaths
Green Age 0-14 Yellow Age 15-64<br />
Red Age 65+<br />
40,000<br />
35,000<br />
30,000<br />
25,000<br />
20,000000<br />
15,000<br />
10,000<br />
5,000<br />
0<br />
Poisonin<br />
ing<br />
Fal<br />
alls<br />
Choking*<br />
Drownin<br />
ing<br />
Fires/Flames
Red = Drugs, medicatments, biologicals<br />
Yellow = Other substances<br />
30,000<br />
25,000<br />
20,000<br />
15,000<br />
10,000<br />
5000 5,000<br />
0<br />
199393<br />
199595<br />
1997 97<br />
1999<br />
200101<br />
200303<br />
200505<br />
200707
www.distracteddriving.nsc.org