Fitzroy River Fish Pathology Report - Department of Primary ...
Fitzroy River Fish Pathology Report - Department of Primary ...
Fitzroy River Fish Pathology Report - Department of Primary ...

You also want an ePaper? Increase the reach of your titles
YUMPU automatically turns print PDFs into web optimized ePapers that Google loves.
<strong>Department</strong> <strong>of</strong> Agriculture, <strong>Fish</strong>eries and Forestry<br />
Biosecurity Queensland<br />
<strong>Fitzroy</strong> <strong>River</strong> <strong>Fish</strong> <strong>Pathology</strong> <strong>Report</strong><br />
May 2012<br />
<strong>Fitzroy</strong> <strong>River</strong> <strong>Fish</strong> <strong>Pathology</strong> <strong>Report</strong> May 2012<br />
1
© State <strong>of</strong> Queensland, <strong>Department</strong> <strong>of</strong> Agriculture, <strong>Fish</strong>eries and Forestry, 2012.<br />
The Queensland Government supports and encourages the dissemination and exchange <strong>of</strong> its information. The<br />
copyright in this publication is licensed under a Creative Commons Attribution 3.0 Australia (CC BY) licence.<br />
Under this licence you are free, without having to seek permission from DAFF, to use this publication in accordance with<br />
the licence terms.<br />
You must keep intact the copyright notice and attribute the State <strong>of</strong> <strong>Department</strong> <strong>of</strong> Agriculture, <strong>Fish</strong>eries and Forestry as<br />
the source <strong>of</strong> the publication.<br />
For more information on this licence visit http://creativecommons.org/licenses/by/3.0/au/deed.en<br />
<strong>Fitzroy</strong> <strong>River</strong> <strong>Fish</strong> <strong>Pathology</strong> <strong>Report</strong> May 2012<br />
2
Contents<br />
Contents 3<br />
Executive Summary 4<br />
Background 5<br />
Methods 6<br />
Study design 6<br />
Variations to study design 7<br />
Sampling method 8<br />
Laboratory testing 8<br />
Gross pathology 8<br />
Histopathology 8<br />
Metal and metalloid residues 9<br />
Statistical analysis <strong>of</strong> metal and metalloid residues 9<br />
Results 10<br />
<strong>Fish</strong> catch summary 10<br />
September 2008 10<br />
January 2009 10<br />
May 2009 10<br />
<strong>Fish</strong> length 10<br />
Gross pathology and histopathology 10<br />
Discussion 25<br />
Gross pathology and histopathology 25<br />
Metal and metalloid residues 26<br />
Appendix 1: <strong>Fish</strong> sampling procedure 27<br />
Appendix 2: <strong>Pathology</strong> lesion severity 30<br />
Appendix 3: Gross pathology and histopathology for species, site and sampling occasion 36<br />
Appendix 4: Concentrations (mg/kg) <strong>of</strong> metals and metalloids in gill, liver and muscle<br />
sampled from A. graeffei at Bedford Weir and Tartrus Weir, and M. Ambigua at Fairbairn<br />
Dam in September 2008, January 2009 and May 2009 41<br />
<strong>Fitzroy</strong> <strong>River</strong> <strong>Fish</strong> <strong>Pathology</strong> <strong>Report</strong> May 2012<br />
3
Executive Summary<br />
In November 2008, Pr<strong>of</strong>essor Barry Hart prepared a report for the Queensland Government that<br />
reviewed concerns over water quality in the <strong>Fitzroy</strong> <strong>River</strong>. The review addressed the potential<br />
impacts associated with the discharge <strong>of</strong> water from the Ensham coal mine between February and<br />
September 2008. The review recommended that the Biosecurity Queensland study that had been<br />
conducted on the health <strong>of</strong> the fish in weirs in 2008, be repeated, to focus on other fish species<br />
and storages, and with an improved study design. By late January 2009, heavy rainfall had<br />
effectively flushed the mine water from the river system.<br />
This report summarises the findings from an additional two sampling occasions which occurred in<br />
January 2009 and May 2009. Sampling was undertaken at two reference sites that were<br />
unaffected by the mine water discharge, and four investigation sites, that were downstream <strong>of</strong> the<br />
discharge and potentially affected. <strong>Fish</strong> were sampled to determine their disease status and their<br />
tissues were analysed for concentrations <strong>of</strong> a range <strong>of</strong> metals and metalloids.<br />
The lack <strong>of</strong> baseline data (i.e. pre-impact data) for fish in the river systems <strong>of</strong> concern makes it<br />
difficult to attribute differences between sites to the mine water discharge. Unfortunately, it is<br />
common in impact assessments to only have comparisons between affected and non-affected<br />
sites. Evidence <strong>of</strong> an effect and its size are therefore only suggestive.<br />
The study did not identify any evidence by gross pathology (external and internal evidence <strong>of</strong><br />
disease) or histopathology (microscopic evidence <strong>of</strong> disease) associated with any significant<br />
infectious agents <strong>of</strong> concern for fish health. A number <strong>of</strong> parasite species, both metazoan and<br />
protozoan, were identified for each <strong>of</strong> the fish species examined, but both the variety and level <strong>of</strong><br />
infection in investigation sites were comparable with observations in reference samples. These<br />
types <strong>of</strong> endemic parasites do not normally cause serious disease in wild fish populations in<br />
freshwater systems.<br />
Red marks and lesions were observed on the skin and fins <strong>of</strong> a number <strong>of</strong> fish in all sites. The fish<br />
were tested for Epizootic Ulcerative Syndrome (EUS), otherwise known as red spot disease. EUS<br />
was found in two bony bream, one from the <strong>Fitzroy</strong> Barrage and one from Bingegang Weir. The<br />
cause <strong>of</strong> lesions in other fish remains unknown, however EUS has been ruled out. EUS is an<br />
endemic ulcerative disease <strong>of</strong> fish caused by the fungus Aphanomyces invadans and occurs<br />
spasmodically in fish along the east coast and in the Gulf <strong>of</strong> Carpentaria.<br />
The major findings in the report include:<br />
<br />
<br />
<br />
<br />
A large proportion <strong>of</strong> fish at investigation sites downstream <strong>of</strong> the mine water discharge did<br />
display signs <strong>of</strong> ill-health but the proportion declined over time suggesting that a change in<br />
water conditions had occurred.<br />
Signs <strong>of</strong> ill-health were also apparent in areas that were not affected by the discharge <strong>of</strong><br />
Ensham mine water indicating that some signs were typical <strong>of</strong> these river systems and<br />
potentially independent <strong>of</strong> mine water discharge.<br />
A number <strong>of</strong> metals and metalloids were recorded in fish, with concentrations greater at the<br />
investigation sites compared to the reference sites.<br />
The concentration <strong>of</strong> many metals and metalloids in fish at investigation sites had diminished<br />
over time to levels similar to those in fish at reference sites. This is consistent with a recovery<br />
following cessation <strong>of</strong> discharge and flushing from heavy rainfall.<br />
<strong>Fitzroy</strong> <strong>River</strong> <strong>Fish</strong> <strong>Pathology</strong> <strong>Report</strong> May 2012<br />
4
Background<br />
The Ensham Coal Mine pits are situated adjacent to the Nogoa section <strong>of</strong> the <strong>Fitzroy</strong> <strong>River</strong>. On<br />
19 January 2008, the pits were inundated with water following the flooding <strong>of</strong> the Emerald region<br />
due to heavy rains.<br />
Dewatering <strong>of</strong> the pits occurred over a period <strong>of</strong> seven months between 3 February 2008 and<br />
9 September 2008 with approximately 138 gigalitres (GL) <strong>of</strong> water released. During the release, it<br />
was reported that there was no significant dilution <strong>of</strong> the discharge as the river flow was very low,<br />
except for the dewatering period from 19 June 2008 to 8 September 2008. During this period <strong>of</strong><br />
time, a reported rate <strong>of</strong> 69.3 megalitres (ML) per day from Fairbairn Dam mixed with the<br />
discharged water. This volume amounted to approximately 5.7 GL or 4 per cent <strong>of</strong> the total<br />
dewatering volume.<br />
In conjunction with reports <strong>of</strong> the release <strong>of</strong> waters from the Ensham Coal Mine pits, communities<br />
<strong>of</strong> Blackwater, Bluff and Tieri raised concerns regarding the water quality in the <strong>Fitzroy</strong> <strong>River</strong><br />
catchment in August 2008. A fisherman from Tartrus Weir reported several forked-tail catfish (Arius<br />
graeffei) with redness <strong>of</strong> all fins and tails to Biosecurity Queensland on 2 September 2008.<br />
Following these reports, Biosecurity Queensland participated in a whole-<strong>of</strong>-government response<br />
and undertook a study in September 2008 <strong>of</strong> the Bedford and Tartrus Weirs. The aim <strong>of</strong> the study<br />
was to examine the health <strong>of</strong> fish from gross pathological and histopathological perspectives. A<br />
limited survey <strong>of</strong> fish health in the areas was undertaken with results indicating that the catfish<br />
sampled from the sites were in poor health at that time i,ii,iii .<br />
Pr<strong>of</strong>essor Barry Hart was commissioned in late 2008 to review the situation regarding the<br />
discharge <strong>of</strong> water from the Ensham Coal Mine pits and report findings and recommendations to<br />
the Premier <strong>of</strong> Queensland. In November, Hart (2008) iv concluded there had not been any<br />
catastrophic effects (e.g. major fish kills) on the fish population in the Nogoa-Mackenzie-<strong>Fitzroy</strong><br />
<strong>River</strong> system during the time <strong>of</strong> the Ensham Coal Mine water discharge. This conclusion was<br />
consistent with available evidence indicating that most Australian adult fish species are relatively<br />
tolerant <strong>of</strong> salinity increases, and unlikely to be adversely affected v,vi . Hart (2008) further stated<br />
that there was no evidence <strong>of</strong> adverse effects on the aquatic biota due to metals and metalloids in<br />
the pit water.<br />
As part <strong>of</strong> the Hart (2008) review, the study undertaken by Biosecurity Queensland in September<br />
2008 was assessed. The Hart review recommended that the “Biosecurity Queensland study <strong>of</strong> the<br />
‘health’ <strong>of</strong> the fish in weirs be repeated with other fish species and other storages included, and the<br />
study design improved’. The Hart review also commented that “it is not possible to relate the<br />
results <strong>of</strong> this study back to the mine-affected water because there is no information on:<br />
i<br />
<strong>Department</strong> <strong>of</strong> Employment, Economic Development and Innovation. (2008). <strong>Fitzroy</strong> Catchment <strong>Fish</strong> Sampling and Health Assessment<br />
Final <strong>Report</strong> 2008.<br />
ii<br />
<strong>Department</strong> <strong>of</strong> Environment and Resource Management. (2008). Ecosystem Heath Evaluation – Bedford Weir.<br />
iii<br />
<strong>Department</strong> <strong>of</strong> Environment and Resource Management. (2008). Ecosystem Health Evaluation – Tartrus Weir.<br />
iv<br />
Hart, B.T. (2008). <strong>Report</strong> to Queensland Premier – Review <strong>of</strong> the <strong>Fitzroy</strong> <strong>River</strong> Water Quality Issues.<br />
v<br />
Hart, B.T., Bailey, P., Edwards, R., James, K., Swadling, K., Meredith, C., McMahon, A. and Hortle, K. (1990). Effects <strong>of</strong> saline<br />
discharges on aquatic ecosystems. Water Research, 24: 1103-1117.<br />
vi<br />
Hart, B.T., Bailey, P., Edwards, R., James, K., Swadling, K., Meredith, C., McMahon, A. and Hortle, K. (1990). Biological effects <strong>of</strong><br />
saline discharges to streams ad wetlands: a review. Hydrobiologia, 210: 105-144.<br />
<strong>Fitzroy</strong> <strong>River</strong> <strong>Fish</strong> <strong>Pathology</strong> <strong>Report</strong> May 2012<br />
5
a. water quality in the weirs at the time <strong>of</strong> sampling (e.g. was dissolved oxygen concentration<br />
low?)<br />
b. the age <strong>of</strong> the fish, necessary to assess the potential bioaccumulation <strong>of</strong> metals and metalloids<br />
c. the health or metal and metalloid concentrations <strong>of</strong> the fish species before the mine-affected<br />
water was added to the system”.<br />
In addition, the Hart (2008) review also recommended that the then <strong>Department</strong> <strong>of</strong> Environment<br />
and Resource Management continue their study “because there is little baseline information<br />
available, this study will be challenged in determining if any short-term biological impacts have<br />
occurred due to the mine-affected water. For this reason, it is recommended that the study<br />
continues for at least 2 years (3 wet-dry cycles) so that any recovery in the condition <strong>of</strong> the biota<br />
can be measured”.<br />
By late January 2009, flooding rainfall had effectively flushed the mine water from the system,<br />
resulting in similar water quality between downstream ‘affected’ sites and sites upstream and<br />
elsewhere vii .<br />
This study, <strong>Fitzroy</strong> <strong>River</strong> <strong>Fish</strong> <strong>Pathology</strong> <strong>Report</strong>, was conducted in response to five<br />
recommendations outlined in the Hart (2008) review.<br />
Methods<br />
Study design<br />
The aim <strong>of</strong> this study was to describe the health <strong>of</strong> fish at a number <strong>of</strong> sites in the <strong>Fitzroy</strong> <strong>River</strong><br />
system over a nine month timeframe commencing in January 2009. Sampling was planned to be<br />
conducted three times during this period at both ‘investigation’ sites (sites potentially affected by<br />
mine water discharge) and ‘reference’ sites (sites not affected by mine water discharge), see<br />
Figure 1.<br />
The investigation sites chosen were:<br />
Bedford Weir (also sampled in September 2008);<br />
Tartrus Weir (also sampled in September 2008);<br />
Bingegang Weir; and<br />
<strong>Fitzroy</strong> Barrage.<br />
The reference sites selected were:<br />
<br />
<br />
Comet Weir; and<br />
Moura on the Dawson <strong>River</strong>.<br />
Samples <strong>of</strong> four species <strong>of</strong> fish were sought from each <strong>of</strong> the six sites during each sampling<br />
occasion. The fish species were:<br />
<br />
Fork-tailed catfish, Arius graeffei;<br />
vii Tripodi, N. and Limpus, C. 2011. Assessment <strong>of</strong> the <strong>Fitzroy</strong> <strong>River</strong> Aquatic Ecosystem following the 2008 Discharge <strong>of</strong><br />
Coal Mine-affected Floodwaters from the Ensham Coal Mine. <strong>Report</strong> to Queensland <strong>Department</strong> <strong>of</strong> Environment and<br />
Resource Management.<br />
<strong>Fitzroy</strong> <strong>River</strong> <strong>Fish</strong> <strong>Pathology</strong> <strong>Report</strong> May 2012<br />
6
Golden perch, Macquaria ambigua;<br />
Sleepy cod, Oxyeleotris lineolatus; and<br />
Saratoga, Scleropages leichardti.<br />
Target numbers were five individuals from each <strong>of</strong> the four species to be collected from the six<br />
sites described above during each sampling occasion (i.e. 5 x 4 x 6 = 120 fish). Animal ethics<br />
approval (CA 2007/10/217) covered the ethical and scientific use <strong>of</strong> fish in this work.<br />
The following data were scheduled to be collected for each fish:<br />
<br />
<br />
<br />
<br />
body length and weight;<br />
qualitative assessment <strong>of</strong> general fish health;<br />
signs <strong>of</strong> clinical disease and exclusion <strong>of</strong> an infectious pathogen as the casual agent; and<br />
concentration <strong>of</strong> a range <strong>of</strong> metals and metalloids.<br />
The scope <strong>of</strong> this study did not extend to the collection <strong>of</strong> water for water quality parameters such<br />
as dissolved oxygen and pH.<br />
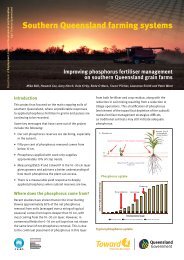
Figure 1: Map showing sites (solid red circles) where fish were sampled<br />
Variations to study design<br />
During the course <strong>of</strong> this study, four amendments were made to the study design. These were:<br />
1. The investigation was limited to two sampling events. These were conducted in January and<br />
May 2009.<br />
<strong>Fitzroy</strong> <strong>River</strong> <strong>Fish</strong> <strong>Pathology</strong> <strong>Report</strong> May 2012<br />
7
2. Fairbairn Dam, highlighted in Figure 1, also sampled in 2008, was chosen as a replacement<br />
reference sampling site due to difficulty in accessing Comet Weir.<br />
3. Scleropages leichardti was unavailable, so leathery grunter (Scortum hillii) and Bony Bream<br />
(Nematolosa erebi) were sampled in addition to the other three target species.<br />
4. <strong>Fish</strong> weights were not taken prior to necropsy. <strong>Fish</strong> length was used as an indicator <strong>of</strong> age.<br />
Sampling method<br />
<strong>Fish</strong> were collected by a combination <strong>of</strong> electro-fishing, gill nets or fyke nets. <strong>Fish</strong> that were caught<br />
were kept live and placed in a basket held in the river until necropsy. This method <strong>of</strong> holding live<br />
fish meant that supplementary aeration was not required. Water exchange occurred naturally with<br />
the river water flow. When fish were required for necropsy, they were placed in a plastic container<br />
filled with fresh river water and anaesthetised using anaesthetic AQUI-S (isoeugenol).<br />
Once a fish reached an appropriate level <strong>of</strong> anaesthesia, it was removed from the AQUI-S bath<br />
and placed on the necropsy table. Over a collection tray, the fish was rinsed down with distilled<br />
water to remove any extraneous sediments/soil on the fish and skin mucus. The fish was then<br />
placed on a dissecting board which had been wiped down with a 70 per cent ethanol spray and<br />
tissue paper. A measurement <strong>of</strong> fish length was made, followed by photography <strong>of</strong> the whole fish<br />
including the accession number for the sample and any external abnormalities <strong>of</strong> the fish.<br />
While still anaesthetised, the cervical spine <strong>of</strong> the fish was severed with a pair <strong>of</strong> secateurs, which<br />
had been wiped down with a 70 per cent ethanol spray and tissue paper, and the fish bled out to<br />
complete euthanasia. Necropsy commenced as soon as possible to minimise possible post<br />
mortem change due to high ambient temperature and humidity.<br />
During necropsy, tissue samples, including gills, liver and muscle, were obtained from each fish<br />
collected. For the full details on the process for fish necropsy and tissue collection for analysis,<br />
see Appendix 1. Tissue samples for histology testing were prepared on site and held in 10 per cent<br />
formalin while being transported to the Biosecurity Sciences Laboratory at Coopers Plains in<br />
Brisbane. At the laboratory, fish tissues in formalin were trimmed into histology holding cassettes<br />
and embedded in wax for processing, sectioning and staining by hematoxylin and eosin.<br />
Tissue samples for metal and metalloid residue testing were prepared on site and kept frozen<br />
during delivery to the Queensland Health Scientific Services Laboratory at Coopers Plains in<br />
Brisbane.<br />
Laboratory testing<br />
Gross pathology<br />
<strong>Fish</strong> were initially examined for external abnormalities. Gross signs related to handling were<br />
identified as artifactual. The measurement <strong>of</strong> the fish length was then made and the fish<br />
photographed against the accession number for the sample.<br />
Histopathology<br />
Histopathology was used to investigate the role, if any, <strong>of</strong> infectious and parasitic pathogens in the<br />
health <strong>of</strong> the fish. Non-infectious abnormalities thought to be caused by environmental, physical or<br />
nutritional factors were also assessed by histopathology.<br />
Histopathology assessments were made on tissues including the eyes, gills, liver, heart, spleen,<br />
spine, kidney, gastrointestinal tract, pancreas, skin/muscle and gonads. Prepared sections were<br />
examined by light microscopy at 40x, 100x, 200x, 400x or 1000x magnification as required.<br />
<strong>Fitzroy</strong> <strong>River</strong> <strong>Fish</strong> <strong>Pathology</strong> <strong>Report</strong> May 2012<br />
8
Diagnostic interpretation was made utilising fish pathology reference tests and experience with<br />
previous fish pathology cases.<br />
Metal and metalloid residues<br />
Tissue samples were analysed for ten metals and metalloids: aluminium (Al), selenium (Se), iron<br />
(Fe), cadmium (Cd), lead (Pb), chromium (Cr), copper (Cu), zinc (Zn), mercury (Hg) and arsenic<br />
(As). All analyses were undertaken on a wet weight basis.<br />
Each sample, as received, was homogenised and a sub-sample was taken for analysis. The<br />
concentrations <strong>of</strong> metals and metalloids were analysed by ICP-MS after microwave digestion. The<br />
analyses were carried out with appropriate standard reference materials, where available, as a<br />
quality control for the recoveries <strong>of</strong> elements.<br />
Statistical analysis <strong>of</strong> metal and metalloid residues<br />
Residue concentrations were significantly skewed and so were log-transformed prior to analysis.<br />
Residual Maximum Likelihood (REML) analyses were conducted using Genstat viii . The fixed effects<br />
included treatment (reference vs investigation sites), time (January 2009 and May 2009), species<br />
<strong>of</strong> fish, and tissue (gill, liver and muscle), along with their respective interactions as appropriate.<br />
Sites (2 x reference, 4 x investigation) were taken as the random effect in the REML models.<br />
Investigative general linear model analyses were also conducted, using sites as a fixed effect and<br />
having no treatment effect. Where residues for Al, As and Hg were below the level <strong>of</strong> detection on<br />
some samples, the standard assumption <strong>of</strong> taking half the limit <strong>of</strong> detection was adopted. The data<br />
were weighted with the number <strong>of</strong> fish contributing to a sample. If an interaction was not significant<br />
it was dropped from the model.<br />
For A. graeffei and M. ambigua, the analyses were repeated with 2008 data included (i.e.<br />
September 2008, January 2009 and May 2009).<br />
To provide an overview, the concentrations <strong>of</strong> metals and metalloids in fish tissues in January and<br />
May 2009 at all six sites was further examined using a principal component analysis ix . This<br />
reduces a large number <strong>of</strong> variables into a smaller, more manageable set <strong>of</strong> new variables that are<br />
correlated with the original set. The variables here are the concentrations (adjusted for species and<br />
tissue in the generalised linear model above) <strong>of</strong> each <strong>of</strong> the metals and metalloids. The locations <strong>of</strong><br />
objects <strong>of</strong> interest, in this case the six sampling sites, can then be examined in the two or three<br />
dimensional space described by the new variables. Most <strong>of</strong> the variation in the original variables is<br />
explained in the first principal component, while the second principal component contains the next<br />
most amount <strong>of</strong> the variation, and so on. The expectation was that the investigation sites would<br />
move closer to the reference sites between January and May 2009.<br />
viii<br />
Payne, R.W., Harding, S.A., Murray, D.A., Soutar, D.M. Baird, D.B., Wlham, S.J., Kane, A.F., Gilmour, A.R., Thompson, R. and<br />
Tunnicliffe Wilson, G. (2007). The Guide to Genstat Release 10, Part 2: Statistics. VSN International, Hemel Hempstead.<br />
ix<br />
Tabachnick, B.G. and Fidell, L.S. (1996). Using multivariate statistics. 3 rd edn. Harper Collins: New York.<br />
<strong>Fitzroy</strong> <strong>River</strong> <strong>Fish</strong> <strong>Pathology</strong> <strong>Report</strong> May 2012<br />
9
Results<br />
<strong>Fish</strong> catch summary<br />
September 2008<br />
A total <strong>of</strong> 15 target fish were collected for testing from three sites:<br />
<br />
<br />
A. graeffei – 10 (10 from investigation sites)<br />
M. ambigua – 5 (5 from reference sites).<br />
January 2009<br />
A total <strong>of</strong> 114 target fish were collected for testing from six sites:<br />
<br />
<br />
<br />
<br />
<br />
A. graeffei – 24 (5 from reference sites; 19 from investigation sites)<br />
M. ambigua – 21 (7 from reference sites; 14 from investigation sites)<br />
O. lineolatus – 18 (6 from reference sites; 12 from investigation sites)<br />
N. erebi – 30 (10 from reference sites; 20 from investigation sites)<br />
S. hillii – 21 (9 from reference sites; 12 from investigation sites).<br />
May 2009<br />
A total <strong>of</strong> 114 target fish were collected for testing from six sites:<br />
<br />
<br />
<br />
<br />
<br />
A. graeffei – 23 (6 from reference sites; 17 from investigation sites)<br />
M. ambigua – 16 (4 from reference sites; 12 from investigation sites)<br />
O. lineolatus – 19 (9 from reference sites; 10 from investigation sites)<br />
N. erebi – 32 (10 from reference sites; 22 from investigation sites)<br />
S. hillii – 24 (10 from reference sites; 14 from investigation sites).<br />
<strong>Fish</strong> length<br />
<strong>Fish</strong> length varied somewhat between samples at each site and time period (Table 1), but with no<br />
consistent pattern and no significant differences between sites and sampling occasions for each<br />
species. In some cases, (e.g. S. hillii in May 2009), there was a tendency for fish at references<br />
sites to be larger than those sampled at investigation sites. The tendency would therefore be for<br />
fish at reference sites to have higher metal and metalloid concentrations. The pooling <strong>of</strong> fish for the<br />
metal and metalloid samples, along with the large number <strong>of</strong> missing values, precluded using<br />
length as a covariate in the metals and metalloids analysis.<br />
Gross pathology and histopathology<br />
The gross pathology and histopathology findings for each <strong>of</strong> the sampling sites are summarised in<br />
Table 2. These findings are further summarised in Table 3 by combining reference sites and<br />
investigation sites. In both tables, the percentage <strong>of</strong> fish showing the pathology lesion type with<br />
three levels <strong>of</strong> severity is given for each <strong>of</strong> the sampling occasions, pooled across species. For<br />
descriptions <strong>of</strong> the pathology lesion types and the levels <strong>of</strong> severity, see Appendix 2. Notably,<br />
sample size is low in September 2008 relative to January and May 2009.<br />
At the reference sites, there is an increase in the incidence and severity <strong>of</strong> many pathology types<br />
between September 2008 and May 2009. In contrast, at the investigation sites, there is a decrease<br />
in the incidence <strong>of</strong> gill-related pathologies between September 2008 and May 2009. There is also a<br />
decrease in the incidence <strong>of</strong> melanomacrophage centres over this period.<br />
<strong>Fitzroy</strong> <strong>River</strong> <strong>Fish</strong> <strong>Pathology</strong> <strong>Report</strong> May 2012<br />
10
Table 1: Average ± standard error (s.e.) fish length (cm) in samples at the six sites in January and<br />
May 2009<br />
Species<br />
A. graeffei<br />
M. ambigua<br />
O. lineolata<br />
Legend:<br />
N. erebi<br />
S. hillii<br />
Jan 2009 May 2009<br />
Site<br />
Standard<br />
Standard<br />
Average<br />
Average<br />
error<br />
error<br />
Fairbairn Dam - N/A - N/A<br />
Moura, Dawson <strong>River</strong> 46.2 1.5 35.1 2.4<br />
Bedford Weir 39.5 2.3 34.5 2.0<br />
Bingegang Weir 41.0 5.3 25.2 2.2<br />
Tartrus Weir 34.0 * 34.5 4.8<br />
<strong>Fitzroy</strong> Barrage 40.0 * 38.0 6.0<br />
Fairbairn Dam 24.0 3.3 22.0 N/A<br />
Moura, Dawson <strong>River</strong> 38.0 1.3 34.5 0.8<br />
Bedford Weir - N/A 23.0 5.5<br />
Bingegang Weir 29.6 1.4 33.7 1.4<br />
Tartrus Weir 31.6 3.6 26.0 2.4<br />
<strong>Fitzroy</strong> Barrage 15.5 0.9 - N/A<br />
Fairbairn Dam 31.0 * 31.5 2.9<br />
Moura, Dawson <strong>River</strong> 28.8 2.2 32.3 2.2<br />
Bedford Weir 29.3 4.5 - N/A<br />
Bingegang Weir 31.3 3.3 26.4 1.5<br />
Tartrus Weir 31.8 3.7 - N/A<br />
<strong>Fitzroy</strong> Barrage - N/A 34.7 3.3<br />
Fairbairn Dam 21.1 2.5 27.2 1.1<br />
Moura, Dawson <strong>River</strong> 22.3 2.7 25.2 1.8<br />
Bedford Weir 28.4 1.7 25.6 0.2<br />
Bingegang Weir 23.5 0.8 25.1 1.2<br />
Tartrus Weir 26.7 3.9 24.7 2.0<br />
<strong>Fitzroy</strong> Barrage - N/A 24.3 1.7<br />
Fairbairn Dam 21.8 0.9 32.5 2.9<br />
Moura, Dawson <strong>River</strong> 27.8 2.6 32.6 0.2<br />
Bedford Weir - N/A 20.0 3.1<br />
Bingegang Weir 31.8 0.6 19.8 1.4<br />
Tartrus Weir 24.8 3.4 24.7 0.9<br />
<strong>Fitzroy</strong> Barrage - N/A 26.5 *<br />
<strong>Fitzroy</strong> Barrage 40.0 * 38.0 6.0<br />
- – length not recorded<br />
N/A – not available due to no length measurement<br />
* – One length recorded, standard error not available<br />
Comparing investigation and reference sites at each time period (Table 3), there was a higher<br />
incidence <strong>of</strong> gill-related pathologies, parasites and melanomacrophages centres at investigation<br />
sites in September 2008. The incidence <strong>of</strong> gill-related pathologies and melanomacrophage centres<br />
at the investigation sites were only marginally higher than their incidence at the reference sites in<br />
January 2009. Incidence <strong>of</strong> organ congestion, gonad lesions and parasites and other lesions were<br />
also higher at the investigation sites in January 2009. In May 2009, the incidence <strong>of</strong> severe gillrelated<br />
pathologies and the incidence <strong>of</strong> melanomacrophage centres at investigation sites were<br />
lower than their incidence at the reference sites.<br />
Red marks and lesions were observed on the skin and fins <strong>of</strong> a number <strong>of</strong> fish at all sites. EUS<br />
(red-spot disease) was diagnosed in the May 2009 samplings in one bony bream from the <strong>Fitzroy</strong><br />
Barrage in May 2009 and one bony bream from the Bingegang Weir in May 2009.<br />
<strong>Fitzroy</strong> <strong>River</strong> <strong>Fish</strong> <strong>Pathology</strong> <strong>Report</strong> May 2012<br />
11
Table 2: Percentage <strong>of</strong> fish with lesions and their severity for all species combined for the<br />
reference and investigation sites during the September 2008, January 2009 and May 2009<br />
sampling occasions<br />
Site Reference Site 1<br />
Reference<br />
Site 2<br />
Investigation Site 1<br />
Investigation Site 2<br />
Investigation<br />
Site 3<br />
Investigation<br />
Site 4<br />
Severity<br />
Fairbairn Dam<br />
Moura,<br />
Dawson<br />
<strong>River</strong><br />
Jan May<br />
09 09<br />
Bedford Weir<br />
Tartrus Weir<br />
Bingengang<br />
Weir<br />
<strong>Fitzroy</strong><br />
Barrage<br />
Sampling occasion Sep<br />
08<br />
Jan<br />
09<br />
May<br />
09<br />
Sep<br />
08<br />
Jan<br />
09<br />
May<br />
09<br />
Sep<br />
08<br />
Jan<br />
09<br />
May<br />
09<br />
Jan<br />
09<br />
May<br />
09<br />
Jan<br />
09<br />
May<br />
09<br />
Total no. <strong>of</strong> fish 5 16 16 21 23 5 15 15 5 30 21 22 23 10 16<br />
collected<br />
<strong>Pathology</strong> Lesion Type (%)<br />
Gill hyperplasia M - 38 12 29 26 60 33 13 - 23 10 27 - - 31<br />
D 40 12 12 5 30 40 27 33 20 33 52 27 61 - 12<br />
S 20 - 6 - 22 - - 13 80 - - - 17 - -<br />
Gill lamellar lifting<br />
Bronchitis<br />
Lamellar fusion<br />
Granulomasnematodes<br />
etc<br />
Trematodes<br />
Cestodes<br />
Gill/skin parasites<br />
Melanomacrophage<br />
centres<br />
Kidney eosinophilic<br />
change<br />
Kidney vacuolar<br />
change<br />
Organ congestion<br />
Myopathy<br />
Gonad lesion,<br />
parasites<br />
Other lesions<br />
M<br />
D<br />
S<br />
M<br />
D<br />
S<br />
M<br />
D<br />
S<br />
M<br />
D<br />
S<br />
M<br />
D<br />
S<br />
M<br />
D<br />
S<br />
M<br />
D<br />
S<br />
M<br />
D<br />
S<br />
M<br />
D<br />
S<br />
M<br />
D<br />
S<br />
M<br />
D<br />
S<br />
M<br />
D<br />
S<br />
M<br />
D<br />
S<br />
M<br />
D<br />
S<br />
-<br />
-<br />
-<br />
-<br />
-<br />
-<br />
-<br />
-<br />
-<br />
-<br />
-<br />
-<br />
-<br />
-<br />
-<br />
-<br />
-<br />
-<br />
40<br />
-<br />
-<br />
40<br />
20<br />
-<br />
-<br />
-<br />
-<br />
-<br />
-<br />
-<br />
40<br />
40<br />
-<br />
-<br />
-<br />
-<br />
-<br />
-<br />
-<br />
40<br />
40<br />
-<br />
-<br />
25<br />
-<br />
-<br />
-<br />
-<br />
19<br />
-<br />
-<br />
25<br />
25<br />
6<br />
25<br />
-<br />
-<br />
6<br />
-<br />
-<br />
31<br />
-<br />
-<br />
-<br />
12<br />
-<br />
-<br />
19<br />
-<br />
-<br />
-<br />
-<br />
-<br />
6<br />
-<br />
31<br />
-<br />
-<br />
-<br />
-<br />
-<br />
-<br />
6<br />
-<br />
-<br />
6<br />
6<br />
-<br />
-<br />
-<br />
6<br />
-<br />
19<br />
38<br />
12<br />
-<br />
19<br />
-<br />
-<br />
12<br />
-<br />
-<br />
31<br />
-<br />
-<br />
31<br />
6<br />
12<br />
6<br />
6<br />
-<br />
-<br />
-<br />
-<br />
-<br />
31<br />
6<br />
-<br />
-<br />
-<br />
-<br />
-<br />
-<br />
19<br />
-<br />
-<br />
5<br />
-<br />
-<br />
-<br />
-<br />
-<br />
5<br />
-<br />
-<br />
38<br />
-<br />
-<br />
62<br />
-<br />
5<br />
19<br />
-<br />
-<br />
19<br />
-<br />
5<br />
24<br />
29<br />
5<br />
14<br />
-<br />
-<br />
-<br />
-<br />
-<br />
-<br />
10<br />
-<br />
5<br />
-<br />
-<br />
-<br />
-<br />
-<br />
29<br />
-<br />
-<br />
4<br />
13<br />
17<br />
-<br />
9<br />
17<br />
-<br />
17<br />
4<br />
39<br />
-<br />
13<br />
57<br />
4<br />
4<br />
9<br />
-<br />
-<br />
43<br />
-<br />
-<br />
39<br />
35<br />
22<br />
-<br />
-<br />
-<br />
4<br />
4<br />
-<br />
-<br />
17<br />
9<br />
-<br />
-<br />
-<br />
4<br />
-<br />
-<br />
17<br />
-<br />
-<br />
40<br />
40<br />
-<br />
-<br />
-<br />
-<br />
20<br />
-<br />
-<br />
-<br />
-<br />
-<br />
80<br />
-<br />
-<br />
-<br />
-<br />
-<br />
60<br />
-<br />
-<br />
40<br />
40<br />
-<br />
-<br />
-<br />
-<br />
-<br />
-<br />
-<br />
-<br />
60<br />
-<br />
-<br />
-<br />
-<br />
-<br />
-<br />
-<br />
7<br />
20<br />
-<br />
20<br />
13<br />
-<br />
-<br />
-<br />
-<br />
33<br />
-<br />
7<br />
33<br />
-<br />
-<br />
-<br />
-<br />
-<br />
27<br />
-<br />
-<br />
33<br />
-<br />
13<br />
-<br />
13<br />
-<br />
-<br />
-<br />
-<br />
-<br />
-<br />
7<br />
40<br />
-<br />
-<br />
-<br />
-<br />
-<br />
-<br />
20<br />
-<br />
-<br />
13<br />
7<br />
7<br />
7<br />
7<br />
-<br />
7<br />
7<br />
40<br />
-<br />
-<br />
7<br />
-<br />
-<br />
13<br />
7<br />
-<br />
40<br />
20<br />
-<br />
-<br />
-<br />
-<br />
-<br />
20<br />
-<br />
-<br />
47<br />
-<br />
7<br />
-<br />
-<br />
-<br />
-<br />
-<br />
20<br />
-<br />
-<br />
-<br />
60<br />
20<br />
-<br />
-<br />
-<br />
60<br />
-<br />
-<br />
40<br />
-<br />
-<br />
40<br />
-<br />
-<br />
-<br />
-<br />
-<br />
20<br />
-<br />
-<br />
40<br />
60<br />
-<br />
-<br />
-<br />
-<br />
-<br />
-<br />
-<br />
-<br />
80<br />
-<br />
-<br />
-<br />
-<br />
-<br />
-<br />
-<br />
17<br />
-<br />
-<br />
-<br />
3<br />
-<br />
17<br />
-<br />
-<br />
27<br />
3<br />
23<br />
33<br />
7<br />
-<br />
10<br />
-<br />
-<br />
63<br />
-<br />
13<br />
27<br />
10<br />
13<br />
-<br />
-<br />
-<br />
-<br />
7<br />
-<br />
-<br />
10<br />
-<br />
10<br />
-<br />
-<br />
7<br />
3<br />
3<br />
-<br />
19<br />
-<br />
-<br />
19<br />
-<br />
5<br />
-<br />
5<br />
24<br />
24<br />
10<br />
43<br />
14<br />
5<br />
24<br />
-<br />
-<br />
52<br />
-<br />
10<br />
52<br />
10<br />
-<br />
-<br />
-<br />
-<br />
-<br />
-<br />
-<br />
-<br />
24<br />
Legend: - – pathology lesion type not observed M – mild D – moderate S – severe<br />
20<br />
60<br />
-<br />
13<br />
73<br />
-<br />
80<br />
-<br />
-<br />
7<br />
-<br />
-<br />
-<br />
-<br />
-<br />
-<br />
-<br />
5<br />
-<br />
24<br />
5<br />
24<br />
-<br />
9<br />
-<br />
-<br />
-<br />
-<br />
5<br />
-<br />
-<br />
45<br />
-<br />
9<br />
36<br />
-<br />
9<br />
-<br />
-<br />
-<br />
41<br />
-<br />
-<br />
23<br />
14<br />
18<br />
-<br />
-<br />
-<br />
-<br />
-<br />
-<br />
-<br />
23<br />
-<br />
-<br />
-<br />
-<br />
-<br />
9<br />
-<br />
23<br />
9<br />
-<br />
4<br />
17<br />
-<br />
-<br />
17<br />
-<br />
-<br />
9<br />
4<br />
22<br />
17<br />
17<br />
43<br />
4<br />
-<br />
9<br />
-<br />
-<br />
48<br />
-<br />
-<br />
43<br />
4<br />
4<br />
4<br />
9<br />
-<br />
-<br />
35<br />
-<br />
-<br />
52<br />
4<br />
13<br />
-<br />
-<br />
4<br />
-<br />
-<br />
26<br />
4<br />
13<br />
-<br />
10<br />
-<br />
-<br />
-<br />
-<br />
10<br />
-<br />
-<br />
30<br />
10<br />
-<br />
60<br />
-<br />
-<br />
10<br />
-<br />
-<br />
50<br />
-<br />
-<br />
30<br />
10<br />
20<br />
-<br />
-<br />
-<br />
-<br />
-<br />
-<br />
-<br />
20<br />
-<br />
-<br />
-<br />
-<br />
10<br />
-<br />
-<br />
-<br />
-<br />
-<br />
12<br />
19<br />
-<br />
6<br />
12<br />
-<br />
6<br />
-<br />
-<br />
75<br />
6<br />
-<br />
44<br />
-<br />
12<br />
12<br />
-<br />
-<br />
25<br />
6<br />
-<br />
31<br />
12<br />
6<br />
-<br />
-<br />
6<br />
6<br />
6<br />
-<br />
-<br />
19<br />
25<br />
-<br />
6<br />
-<br />
6<br />
-<br />
-<br />
6<br />
12<br />
-<br />
<strong>Fitzroy</strong> <strong>River</strong> <strong>Fish</strong> <strong>Pathology</strong> <strong>Report</strong> May 2012<br />
12
Table 3: Percentage <strong>of</strong> fish with lesions and their severity for all species combined for the<br />
reference sites combined and the investigation sites combined for the September 2008, January<br />
2009 and May 2009 sampling occasions<br />
Site Reference Sites Combined Investigation Sites Combined<br />
Sampling occasion Sep 08 Jan 09 May 09 Sep 08 Jan 09 May 09<br />
Total no. <strong>of</strong> fish collected 5 37 39 10 77 75<br />
<strong>Pathology</strong> Lesion Type<br />
Gill hyperplasia<br />
M -<br />
32<br />
21<br />
30<br />
23<br />
12<br />
D 40<br />
8<br />
23<br />
30<br />
26<br />
43<br />
S 20<br />
-<br />
15<br />
40<br />
-<br />
8<br />
Total %<br />
60 40 59 100 49 55<br />
Gill lamellar lifting<br />
Bronchitis<br />
Lamellar fusion<br />
Total %<br />
Total %<br />
Total %<br />
Granulomas-nematodes etc<br />
Trematodes<br />
Cestodes<br />
Gill/skin parasites<br />
Total %<br />
Total %<br />
Total %<br />
Total %<br />
Melanomacrophage centres<br />
Total %<br />
Kidney eosinophilic change<br />
Total %<br />
Kidney vacuolar change<br />
Organ congestion<br />
Myopathy<br />
Total %<br />
Total %<br />
Total %<br />
Gonad lesion, parasites<br />
Total %<br />
Severity<br />
M<br />
D<br />
S<br />
M<br />
D<br />
S<br />
M<br />
D<br />
S<br />
M<br />
D<br />
S<br />
M<br />
D<br />
S<br />
M<br />
D<br />
S<br />
M<br />
D<br />
S<br />
M<br />
D<br />
S<br />
M<br />
D<br />
S<br />
M<br />
D<br />
S<br />
M<br />
D<br />
S<br />
M<br />
D<br />
S<br />
M<br />
D<br />
S<br />
-<br />
-<br />
-<br />
3<br />
11<br />
-<br />
3<br />
10<br />
13<br />
20<br />
50<br />
10<br />
8<br />
9<br />
-<br />
4<br />
19<br />
-<br />
0 14 26 80 17 23<br />
-<br />
-<br />
-<br />
-<br />
-<br />
-<br />
-<br />
-<br />
-<br />
-<br />
-<br />
-<br />
4<br />
4<br />
-<br />
1<br />
16<br />
1<br />
0 0 0 0 8 18<br />
-<br />
-<br />
-<br />
11<br />
-<br />
-<br />
3<br />
10<br />
10<br />
0 0 23 40 9 12<br />
-<br />
-<br />
-<br />
32<br />
11<br />
3<br />
38<br />
5<br />
8<br />
20<br />
-<br />
-<br />
34<br />
13<br />
3<br />
29<br />
15<br />
9<br />
0 46 51 20 50 53<br />
-<br />
-<br />
-<br />
46<br />
-<br />
3<br />
41<br />
3<br />
3<br />
0 49 47 60 44 52<br />
-<br />
-<br />
-<br />
14<br />
-<br />
-<br />
10<br />
-<br />
-<br />
-<br />
-<br />
-<br />
5<br />
-<br />
-<br />
13<br />
-<br />
-<br />
0 14 10 0 5 13<br />
40<br />
-<br />
-<br />
24<br />
-<br />
3<br />
38<br />
-<br />
-<br />
40 27 38 40 53 43<br />
40<br />
20<br />
-<br />
14<br />
22<br />
3<br />
36<br />
23<br />
18<br />
40<br />
-<br />
-<br />
60<br />
-<br />
-<br />
40<br />
-<br />
-<br />
40<br />
50<br />
-<br />
60 39 77 90 52 57<br />
-<br />
-<br />
-<br />
8<br />
8<br />
-<br />
3<br />
3<br />
-<br />
-<br />
-<br />
-<br />
-<br />
3<br />
-<br />
1<br />
3<br />
1<br />
0 16 6 0 3 4<br />
-<br />
-<br />
-<br />
40<br />
40<br />
-<br />
-<br />
-<br />
-<br />
-<br />
-<br />
-<br />
-<br />
-<br />
-<br />
9<br />
-<br />
-<br />
38<br />
3<br />
3<br />
48<br />
-<br />
5<br />
27<br />
9<br />
16<br />
-<br />
3<br />
-<br />
4<br />
4<br />
4<br />
43<br />
5<br />
4<br />
37<br />
3<br />
3<br />
43<br />
11<br />
3<br />
1<br />
16<br />
-<br />
0 0 0 0 3 17<br />
-<br />
-<br />
-<br />
-<br />
-<br />
8<br />
23<br />
70<br />
13<br />
36<br />
-<br />
8<br />
-<br />
1<br />
7<br />
80 8 31 70 14 43<br />
-<br />
-<br />
-<br />
16<br />
-<br />
-<br />
-<br />
-<br />
-<br />
-<br />
-<br />
-<br />
12<br />
-<br />
-<br />
5<br />
1<br />
-<br />
0 16 0 0 12 6<br />
-<br />
-<br />
-<br />
-<br />
-<br />
-<br />
-<br />
-<br />
-<br />
0 0 0 0 9 4<br />
16<br />
18<br />
50<br />
12<br />
20<br />
3<br />
-<br />
30<br />
17<br />
5<br />
-<br />
-<br />
-<br />
-<br />
11<br />
Other lesions<br />
M<br />
D<br />
S<br />
40<br />
40<br />
-<br />
Total %<br />
80 19 18 80 29 36<br />
Legend: - – pathology lesion type not observed M – mild D – moderate S – severe<br />
-<br />
-<br />
-<br />
4<br />
4<br />
1<br />
3<br />
1<br />
-<br />
<strong>Fitzroy</strong> <strong>River</strong> <strong>Fish</strong> <strong>Pathology</strong> <strong>Report</strong> May 2012<br />
13
Metal and metalloid residues<br />
Changes in the concentrations <strong>of</strong> metals and metalloids in fish tissues over time are presented in<br />
five ways.<br />
1. Average concentrations <strong>of</strong> each metal and metalloid at each site in each time period were<br />
tabulated. These concentrations are the adjusted means from the overall analysis, so are<br />
correctly balanced for any missing values (primarily, when a fish species was not captured at<br />
a location on a date).<br />
2. These adjusted concentrations <strong>of</strong> individual metals and metalloids at each site in January and<br />
May 2009 are also expressed as a percentage <strong>of</strong> the mean concentration for two reference<br />
sites across both time periods.<br />
3. Plots <strong>of</strong> metal and metalloid concentrations in fish over time for each site and metal and<br />
metalloid.<br />
4. Following the principal component analysis, the location <strong>of</strong> each site and time combination<br />
was graphed in two dimensions described by the first two principal components.<br />
5. Significant differences in metal and metalloid concentrations for particular tissues and species<br />
between reference and investigation sites were identified separately for January and May<br />
2009.<br />
Adjusted mean concentrations <strong>of</strong> metals and metalloids at each site in January and May 2009 are<br />
shown in Table 4. Notably high values are Al, Fe, Cr and Cd at Bedford Weir in January 2009.<br />
The percentage differences between adjusted concentrations <strong>of</strong> metals and metalloids at each site<br />
relative to the average at reference sites over January and May 2009 are shown in Figure 2.<br />
Separate calculations were made for January and May 2009. There is considerable variation<br />
among metals and metalloids, even at the reference sites. Particularly high values (>200%) in<br />
January 2009 are for Al (328%), Cr (326%) and Se (289%) at Bedford Weir, and Al (237%) at<br />
Bingegang Weir, and Cr (243%) and Se (249%) at Tartrus Weir. In May 2009, Al (222%) was<br />
particularly high at Tartrus Weir.<br />
The relevant comparisons in Figure 2 are between January and May 2009 for the four investigation<br />
sites. For each site, there is a tendency for most metals and metalloids to be closer to 100% (i.e.<br />
closer to the reference site concentrations) in May than in January. This is most noticeable for<br />
Bedford Weir, which is the site closest downstream to the mine water discharge.<br />
Adjusted concentrations <strong>of</strong> metals and metalloids at each site in January and May 2009 are shown<br />
in Figure 3. Improvement in fish health would be seen as a shift in metal and metalloid<br />
concentration in fish at investigation sites to concentrations recorded in fish at reference sites. This<br />
was seen for at least some investigation sites for Cr, Fe, Al, Se and Cd. In these cases, metal and<br />
metalloid concentration at Bedford Weir and sometimes other investigation sites were higher than<br />
reference site concentrations in January and declined to be at a similar concentration in May.<br />
For other metals and metalloids, there was no clear pattern <strong>of</strong> an initial state <strong>of</strong> relatively elevated<br />
concentration followed by a decline. <strong>Fish</strong> at all sites had similar concentrations <strong>of</strong> Cu, while<br />
concentrations <strong>of</strong> As declined at all sites except for the Dawson <strong>River</strong> reference site. Hg<br />
concentration was highest at the reference sites, declining at these and two <strong>of</strong> the investigation<br />
sites. Pb concentrations in fish actually increased at the two reference sites and two <strong>of</strong> the<br />
investigation sites.<br />
Actual concentrations <strong>of</strong> metals and metalloids at each site in September 2008, January 2009 and<br />
May 2009 are shown in Appendix 3. For each metal and metalloid, there are two investigation sites<br />
and one reference site. A different species <strong>of</strong> fish was sampled at the latter. Despite the limited<br />
<strong>Fitzroy</strong> <strong>River</strong> <strong>Fish</strong> <strong>Pathology</strong> <strong>Report</strong> May 2012<br />
14
sample size and different fish species sampled, it was still <strong>of</strong> interest to see if there were declines<br />
in metal and metalloid concentrations in fish at investigation sites relative to the reference site.<br />
There is a striking decline for Cr at Tartrus Weir. However, for other cases, the changes are either<br />
small, not maintained over time (e.g. increase again in May 2009) or mirrored and at the same<br />
concentration at the reference site.<br />
Table 4: Adjusted mean concentrations (mg/kg) <strong>of</strong> metals and metalloids in all species at the<br />
reference and investigation sites during the January and May 2009 sampling occasions<br />
Time Location Fe Al Cr Cu Zn As Se Cd Hg Pb<br />
Jan Fairbairn Dam 29.81 5.36 0.04 1.08 17.08 0.05 0.52 0.02 0.11 0.04<br />
2009 Moura, Dawson <strong>River</strong> 31.69 2.09 0.03 1.01 23.36 0.17 0.64 0.01 0.10 0.04<br />
Bedford Weir 59.56 10.72 0.13 0.83 21.12 0.20 1.70 0.02 0.06 0.03<br />
Tartrus Weir 37.64 4.85 0.09 1.22 23.20 0.18 1.46 0.02 0.07 0.03<br />
Bingegang Weir 37.34 7.75 0.05 1.01 19.38 0.20 0.93 0.01 0.05 0.03<br />
<strong>Fitzroy</strong> Barrage 30.72 2.01 0.03 1.03 16.81 0.21 1.14 0.02 0.04 0.03<br />
May<br />
2009<br />
Fairbairn Dam 38.94 3.87 0.05 1.04 21.65 0.08 0.68 0.01 0.09 0.07<br />
Moura, Dawson <strong>River</strong> 27.06 1.76 0.02 0.79 17.27 0.14 0.51 0.02 0.07 0.07<br />
Bedford Weir 26.63 5.55 0.03 0.91 20.41 0.15 0.75 0.01 0.03 0.03<br />
Tartrus Weir 29.67 7.24 0.03 0.66 16.54 0.10 0.63 0.01 0.04 0.11<br />
Bingegang Weir 31.98 5.09 0.04 0.81 21.41 0.11 0.82 0.01 0.07 0.03<br />
<strong>Fitzroy</strong> Barrage 42.06 2.81 0.06 1.09 22.92 0.10 0.81 0.01 0.06 0.07<br />
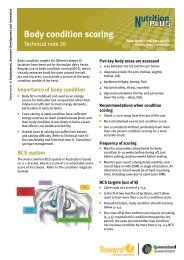
The principal component analysis reduced the ten metals and metalloids to two variables or<br />
components that explained 60% <strong>of</strong> the variation in the original data from January and May 2009.<br />
The six sites are graphed in the two-dimensional space described by these new variables in Figure<br />
4. In January 2009, the reference sites occupy an area in the top left-hand corner <strong>of</strong> the plot,<br />
whereas the investigation sites tend to be in the bottom right-hand corner. Improvement in fish<br />
health would be seen as a spatial shift in the investigation sites towards the reference sites. This<br />
occurs for Bingegang Weir and <strong>Fitzroy</strong> Barrage, but not Bedford and Tartrus Weirs. The latter two<br />
sites shift in the expected direction along the first principal component, but not the second.<br />
However, this shift is in parallel with the temporal (January to May) shift observed in the Dawson<br />
<strong>River</strong> reference site.<br />
Tables 5 and 6 identify metals and metalloids whose concentrations in fish tissues differed<br />
significantly between reference and investigation sites in January and May 2009, respectively.<br />
What is noteworthy is that there are fewer significant cases for May 2009 than in January 2009. By<br />
May 2009, Al and As no longer differ between sites, but Cu now does, albeit at a marginally<br />
significant level. Similarly, N. erebi and A. graeffei are no longer affected in May. However,<br />
differences in Se are maintained across three species.<br />
The statistical results reported in Tables 5 and 6 are consistent with the patterns described above.<br />
Figure 2 suggests that the disparity in Se concentrations between sites is diminishing.<br />
Finally, the data can also be used to indicate which species <strong>of</strong> fish and tissue should be targeted<br />
for future monitoring. The best candidates are likely to be those fish and tissues with the highest<br />
concentrations <strong>of</strong> each metal and metalloid, but particularly those apparently affected by the mine<br />
water discharge as identified above (i.e. Se, Al and possibly Cr). The liver <strong>of</strong> N. erebi had the<br />
highest concentration <strong>of</strong> Al and As and was within 20% <strong>of</strong> the highest value for Cd and Cr. Liver <strong>of</strong><br />
A. graeffei recorded the highest concentrations <strong>of</strong> Cu, Fe, Hg, Se and Zn. Liver <strong>of</strong> M. ambigua was<br />
within 20% <strong>of</strong> the maximum concentration recorded for Se. Gill <strong>of</strong> S. hillii recorded the highest<br />
concentration <strong>of</strong> Pb.<br />
<strong>Fitzroy</strong> <strong>River</strong> <strong>Fish</strong> <strong>Pathology</strong> <strong>Report</strong> May 2012<br />
15
Figure 2: The percentage difference between adjusted concentrations <strong>of</strong> metals and metalloids at each site relative to the average at reference<br />
sites over January and May 2009. Percentage differences >200% are given in the text.<br />
(a) Fairbairn Dam, January 2009, (b) Fairbairn Dam, May 2009, (c) Dawson <strong>River</strong>, January 2009, (d) Dawson <strong>River</strong>, May 2009, (e) Bedford<br />
Weir, January 2009, (f) Bedford Weir, May 2009, (g) Bingegang Weir, January 2009, (h) Bingegang Weir, May 2009, (i) Tartrus Weir, January<br />
2009, (j) Tartrus Weir, May 2009, (k) <strong>Fitzroy</strong> Barrage, January 2009, (l) <strong>Fitzroy</strong> Barrage, May 2009.<br />
Fairbairn Dam, Jan.<br />
Fairbairn Dam, May<br />
200<br />
200<br />
Percentage<br />
100<br />
Percentage<br />
100<br />
0<br />
Fe Al Cr Cu Zn As Se Cd Hg Pb<br />
0<br />
Fe Al Cr Cu Zn As Se Cd Hg Pb<br />
<strong>Fitzroy</strong> <strong>River</strong> <strong>Fish</strong> <strong>Pathology</strong> <strong>Report</strong> May 2012 16
Dawson <strong>River</strong>, Jan.<br />
Dawson <strong>River</strong>, May<br />
200<br />
200<br />
Percentage<br />
100<br />
Percentage<br />
100<br />
0<br />
Fe Al Cr Cu Zn As Se Cd Hg Pb<br />
0<br />
Fe Al Cr Cu Zn As Se Cd Hg Pb<br />
Bedford Weir, Jan.<br />
Bedford Weir, May<br />
200<br />
200<br />
Percentage<br />
100<br />
Percentage<br />
100<br />
0<br />
Fe Al Cr Cu Zn As Se Cd Hg Pb<br />
0<br />
Fe Al Cr Cu Zn As Se Cd Hg Pb<br />
<strong>Fitzroy</strong> <strong>River</strong> <strong>Fish</strong> <strong>Pathology</strong> <strong>Report</strong> May 2012 17
Bingegang Weir, Jan.<br />
Bingegang Weir, May<br />
200<br />
200<br />
Percentage<br />
100<br />
Percentage<br />
100<br />
0<br />
Fe Al Cr Cu Zn As Se Cd Hg Pb<br />
0<br />
Fe Al Cr Cu Zn As Se Cd Hg Pb<br />
Tartarus Weir, Jan.<br />
Tartarus Weir, May<br />
200<br />
200<br />
Percentage<br />
100<br />
Percentage<br />
100<br />
0<br />
Fe Al Cr Cu Zn As Se Cd Hg Pb<br />
0<br />
Fe Al Cr Cu Zn As Se Cd Hg Pb<br />
<strong>Fitzroy</strong> <strong>River</strong> <strong>Fish</strong> <strong>Pathology</strong> <strong>Report</strong> May 2012 18
<strong>Fitzroy</strong> Barrage, Jan.<br />
<strong>Fitzroy</strong> Barrage, May<br />
200<br />
200<br />
Percentage<br />
100<br />
Percentage<br />
100<br />
0<br />
Fe Al Cr Cu Zn As Se Cd Hg Pb<br />
0<br />
Fe Al Cr Cu Zn As Se Cd Hg Pb<br />
<strong>Fitzroy</strong> <strong>River</strong> <strong>Fish</strong> <strong>Pathology</strong> <strong>Report</strong> May 2012 19
Figure 3: Adjusted (for fish species and tissue) concentrations (mg/kg) <strong>of</strong> metals and metalloids in fish at reference (open symbols) and<br />
investigations sites (closed symbols) in January and May 2009.<br />
(a) chromium, (b) copper, (c) iron, (d) aluminium, (e) zinc, (f) arsenic, (g) selenium, (h) cadmium, (i) mercury, and (j) lead.<br />
Arrows connect samples taken in January and May 2009<br />
Cr<br />
Cu<br />
Fe<br />
0.15<br />
Bedford Weir<br />
Bingegang Weir<br />
Dawson <strong>River</strong><br />
Fairbairn Dam<br />
<strong>Fitzroy</strong> Barrage<br />
Tartarus Weir<br />
1.5<br />
80<br />
60<br />
Bedford Weir<br />
Bingegang Weir<br />
Dawson <strong>River</strong><br />
Fairbairn Dam<br />
<strong>Fitzroy</strong> Barrage<br />
Tartarus Weir<br />
0.1<br />
1<br />
Concentration<br />
Concentration<br />
Concentration<br />
40<br />
0.05<br />
0.5<br />
Bedford Weir<br />
Bingegang Weir<br />
Dawson <strong>River</strong><br />
Fairbairn Dam<br />
<strong>Fitzroy</strong> Barrage<br />
Tartarus Weir<br />
20<br />
0<br />
Jan 2009 May 2009<br />
0<br />
Jan 2009 May 2009<br />
Jan 2009 May 2009<br />
<strong>Fitzroy</strong> <strong>River</strong> <strong>Fish</strong> <strong>Pathology</strong> <strong>Report</strong> May 2012 20
Al<br />
Zn<br />
As<br />
12<br />
10<br />
Bedford Weir<br />
Bingegang Weir<br />
Dawson <strong>River</strong><br />
Fairbairn Dam<br />
<strong>Fitzroy</strong> Barrage<br />
Tartarus Weir<br />
25<br />
Bedford Weir<br />
Bingegang Weir<br />
Dawson <strong>River</strong><br />
Fairbairn Dam<br />
<strong>Fitzroy</strong> Barrage<br />
Tartarus Weir<br />
0.25<br />
0.2<br />
Bedford Weir<br />
Bingegang Weir<br />
Dawson <strong>River</strong><br />
Fairbairn Dam<br />
<strong>Fitzroy</strong> Barrage<br />
Tartarus Weir<br />
Concentration<br />
8<br />
6<br />
Concentration<br />
20<br />
Concentration<br />
0.15<br />
0.1<br />
4<br />
0.05<br />
2<br />
Jan 2009 May 2009<br />
15<br />
Jan 2009 May 2009<br />
0<br />
Jan 2009 May 2009<br />
<strong>Fitzroy</strong> <strong>River</strong> <strong>Fish</strong> <strong>Pathology</strong> <strong>Report</strong> May 2012 21
Se<br />
Cd<br />
Hg<br />
2<br />
1.5<br />
Bedford Weir<br />
Bingegang Weir<br />
Dawson <strong>River</strong><br />
Fairbairn Dam<br />
<strong>Fitzroy</strong> Barrage<br />
Tartarus Weir<br />
0.025<br />
0.02<br />
Bedford Weir<br />
Bingegang Weir<br />
Dawson <strong>River</strong><br />
Fairbairn Dam<br />
<strong>Fitzroy</strong> Barrage<br />
Tartarus Weir<br />
0.15<br />
0.1<br />
Bedford Weir<br />
Bingegang Weir<br />
Dawson <strong>River</strong><br />
Fairbairn Dam<br />
<strong>Fitzroy</strong> Barrage<br />
Tartarus Weir<br />
Concentration<br />
1<br />
Concentration<br />
0.015<br />
0.01<br />
Concentration<br />
0.05<br />
0.5<br />
0.005<br />
0<br />
Jan 2009 May 2009<br />
0<br />
Jan 2009 May 2009<br />
0<br />
Jan 2009 May 2009<br />
<strong>Fitzroy</strong> <strong>River</strong> <strong>Fish</strong> <strong>Pathology</strong> <strong>Report</strong> May 2012 22
Pb<br />
0.15<br />
0.1<br />
Bedford Weir<br />
Bingegang Weir<br />
Dawson <strong>River</strong><br />
Fairbairn Dam<br />
<strong>Fitzroy</strong> Barrage<br />
Tartarus Weir<br />
Concentration<br />
0.05<br />
0<br />
Jan 2009 May 2009<br />
Figure 4: Location <strong>of</strong> sites in space described by the first two principal components, which explains<br />
60% <strong>of</strong> the variation in the original metal and metalloid concentrations<br />
Arrows connect samples taken in January and May 2009.<br />
2.5<br />
2<br />
Fair_Jan<br />
Fair_May<br />
1.5<br />
Daws_Jan<br />
Fitz_May<br />
Dimension 2 (19% variation)<br />
1<br />
0.5<br />
0<br />
-0.5<br />
Daws_May<br />
Bing_May<br />
Bing_Jan<br />
Tart_Jan<br />
Bedf_Jan<br />
-1<br />
-1.5<br />
Tart_May<br />
Bedf_May<br />
Fitz_Jan<br />
-2 -1 0 1 2 3 4 5<br />
Dimension 1 (41% variation)<br />
<strong>Fitzroy</strong> <strong>River</strong> <strong>Fish</strong> <strong>Pathology</strong> <strong>Report</strong> May 2012 23
Table 5: Tissue samples from fish at investigation sites (I) with metal and metalloid concentrations<br />
(mg/kg) significantly (P
Discussion<br />
Gross pathology and histopathology<br />
Improvement in health <strong>of</strong> a population can be difficult to quantify. At a subjective level, the<br />
pathologist performing the necropsies in this project noted that fish health appeared to have<br />
improved in 2009 compared with the limited samples from 2008. This is consistent with the trends<br />
in fish pathology reported in Tables 2 and 3. The improvement coincided with a cessation <strong>of</strong> large<br />
mine-affected water discharges and flushing rains in late January 2009 between the three<br />
sampling occasions.<br />
This overall conclusion needs to be made cautiously. There were no baseline (i.e. pre-impact) data<br />
on fish health in this river system with which to compare post-impact data and thus draw strong<br />
inference. Unfortunately, this is a common problem in impact studies. Nevertheless, some<br />
assessment can be made through comparing affected and unaffected areas as has been done<br />
here. The problem is that there is invariably environmental variation between sites and this may<br />
translate into differences in fish health and concentrations <strong>of</strong> metals and metalloids in fish tissues,<br />
making it difficult to ascribe differences between affected and unaffected sites to an event such as<br />
mine water discharge. However, trends in health or metal and metalloid concentration can be more<br />
appropriately compared between sites. Evidence <strong>of</strong> an impact and its size can thus be<br />
strengthened by monitoring over time if affected sites display an expected recovery.<br />
The sampling in September 2008, immediately post-impact, was limited as it involved only two<br />
species <strong>of</strong> fish (10 individuals) at two investigation sites and a different species sampled (5<br />
individuals) at one reference site. In addition, the small sample size (n=10 at investigation sites;<br />
n=5 at the reference site) makes it difficult to generalise. Sampling in 2009 was more substantial<br />
and indicated two contrasting trends in fish health. <strong>Fish</strong> health, while initially poorer at investigation<br />
sites, appeared to be improving there over time, but the trend was opposite at the reference sites.<br />
Skin and gill parasites are common in fish and in small numbers cause little harm. The response<br />
they evoke may vary from almost negligible and mild to severe and extensive causing lesions and<br />
tissue damage as well as producing side affects such as hyperplasia. Hyperplasia, fusion and<br />
necrosis are the dominant type <strong>of</strong> lesion with the most common response to the irritation being<br />
hyperplasia – an abnormal increase in the number <strong>of</strong> cells in an organ, in this case the gill<br />
epithelium. Many <strong>of</strong> the fish species had low levels <strong>of</strong> gill parasitism, however the pathologist<br />
noted that not all fish displaying gill hyperplasia were affected by parasites.<br />
Melanomacrophage centres are a common histological observation in fish kidney, liver and spleen.<br />
The presence and size <strong>of</strong> melanomacrophage centres is known to vary between different fish<br />
species and tissue types. Many biological functions are ascribed to melanomacrophage centres,<br />
including processing <strong>of</strong> endogenous and exogenous waste material and immune responses. An<br />
increase in the presence or size <strong>of</strong> melanomacrophage centres is <strong>of</strong>ten reported in fish exposed to<br />
metals and metalloids, but other factors such as age, diet, starvation, disease and exposure to<br />
other pollutants may also be contributing factors and have not been ruled out by the sampling<br />
conducted in this study. It is unknown whether the increase in presence or size <strong>of</strong><br />
melanomacrophage centres has long-term implications for fish health in the <strong>Fitzroy</strong> catchment.<br />
Epizootic Ulcerative Syndrome, recorded in two fish in May 2009, is an endemic ulcerative disease<br />
<strong>of</strong> fish caused by the fungus Aphanomyces invadans and occurs spasmodically in fish along the<br />
<strong>Fitzroy</strong> <strong>River</strong> <strong>Fish</strong> <strong>Pathology</strong> <strong>Report</strong> May 2012<br />
25
east coast and in the Gulf <strong>of</strong> Carpentaria. The disease is most commonly seen when there are low<br />
temperature and heavy rainfall in tropical and sub-tropical waters x .<br />
Metal and metalloid residues<br />
As with the pathology results, the lack <strong>of</strong> baseline (i.e. pre-impact) data on metal and metalloid<br />
concentration makes it difficult to ascribe differences between the sites to the mine water<br />
discharge. For many metals and metalloids, there is substantial site-to-site variation in their<br />
concentrations in fish tissues. For example, mercury concentrations were lower in fish at the<br />
investigation sites than in fish at the reference sites, suggesting pre-existing site-specific variation.<br />
This compromises an assessment <strong>of</strong> mercury contamination <strong>of</strong> the waterway from the mine water<br />
discharge. Nevertheless, an assessment <strong>of</strong> the trends in the concentrations <strong>of</strong> metals and<br />
metalloids should still be valid. To that end, an expected decline in concentration in at least some<br />
metals and metalloids was observed at investigation sites by May 2009.<br />
Regardless <strong>of</strong> these difficulties, there is good suggestive evidence that some metal and metalloid<br />
concentrations were elevated in fish tissue at sites downstream <strong>of</strong> the mine water discharge.<br />
Selenium and aluminium were <strong>of</strong> concern. There is also support for a reduction in the<br />
concentrations <strong>of</strong> these metals and metalloids over time at investigation sites. This was most<br />
noticeable at Bedford Weir, the investigation site closest downstream to the mine water discharge.<br />
Unfortunately, inclusion <strong>of</strong> the 2008 data did not clarify any <strong>of</strong> the patterns observed in just the<br />
2009 data. The 2008 data were limited in that fewer sites and fish species were sampled.<br />
x<br />
Bondad-Reantaso, M. G., Lumanlan, S. C., Natividad, J. M. and Phillips, M. J. (1992). Environmental monitoring <strong>of</strong> the epizootic<br />
ulcerative syndrome (EUS) in fish from Munoz, Nueva Ecija in the Philippines. In: Shariff, M., Subasinghe, R. P, Arthur, J. R. eds.<br />
Diseases in Asian Aquaculture 1. Manila, The Philippines: <strong>Fish</strong> Health Section, Asian <strong>Fish</strong>eries Society, 475-490.<br />
<strong>Fitzroy</strong> <strong>River</strong> <strong>Fish</strong> <strong>Pathology</strong> <strong>Report</strong> May 2012<br />
26
Appendix 1: <strong>Fish</strong> sampling procedure<br />
Flow <strong>of</strong> sampling:<br />
a. Sample gill for histology<br />
b. Sample gill for metals and metalloids<br />
c. Gill scraping<br />
d. Skin scraping<br />
e. Examine gill and skin scrapings under microscope<br />
f. Open fish abdomen<br />
g. Sample liver for histology<br />
h. Sample liver for metals and metalloids<br />
i. Sample internal organs for histology<br />
j. Sample muscle for histology<br />
k. Sample muscle for metals and metalloids<br />
A. Perform a gill scraping (use external instrument set)<br />
1. Open the gill cover<br />
2. Using scissors snip 2-3 tips <strong>of</strong> the gill filaments<br />
3. Place the sample on a clean glass slide<br />
4. Add 2-3 drops <strong>of</strong> water to the sample<br />
5. Cover sample with a glass cover slip<br />
6. Label the slide with the fish number<br />
B. Perform a skin scraping (use external instrument set)<br />
1. Attach a clean blade to the scalpel handle<br />
2. Using the blunt edge <strong>of</strong> a scalpel, scrape from the head to tail direction the skin mucus <strong>of</strong><br />
the fish. Some scales may be included<br />
3. Place the sample on a clean glass slide<br />
4. Add 2-3 drops <strong>of</strong> water to the sample<br />
5. Cover sample with a glass cover slip<br />
6. Label the slide with the fish number<br />
C. Examine the gill and skin scraping samples under the light microscope<br />
7. Adjust the focus and light intensity<br />
8. Use the 4X objective first<br />
9. Then use the 10X and 20X objectives for more magnification<br />
10. Photograph any parasites that may be found in the samples<br />
D. Dissect and observe the internal organs <strong>of</strong> the fish specimen<br />
Part I. Tissues for metal and metalloid analysis<br />
1. Use external sample instruments for gills/skin-muscle. Use internal sample instruments for<br />
liver. Alternatively, if only a single set <strong>of</strong> instruments is available, then, clean and rinse<br />
down the instruments with 70% ethanol and distilled water prior to working on internal<br />
<strong>Fitzroy</strong> <strong>River</strong> <strong>Fish</strong> <strong>Pathology</strong> <strong>Report</strong> May 2012<br />
27
organs or between fish or batches <strong>of</strong> fish. Take photograph <strong>of</strong> any gross abnormality with<br />
the identifying accession no. 1. Remove the gill cover to expose the gills. With scissors, cut<br />
1 gill arch. Rinse gill sample with distilled water. Place in yellow top sterile plastic bottle.<br />
Label – ‘gills’ and add accession sticker. Pool 5 gills from 5 fish into 1 bottle <strong>of</strong> the same<br />
species <strong>of</strong> fish.<br />
2. Cut open the abdominal flank muscle. Identify following organs: heart, liver, stomach,<br />
spleen, intestines, gall bladder, swim bladder, kidney-spinal cord, pyloric caeca and<br />
gonads.<br />
3. Cut a 1 cm X 1cm X 1 cm piece <strong>of</strong> liver. Rinse liver sample with distilled water. Place in<br />
yellow top sterile plastic bottle. Label – ‘liver’ and add accession sticker. Pool 5 liver<br />
samples from 5 fish into 1 bottle <strong>of</strong> the same species <strong>of</strong> fish.<br />
4. Using a new scalpel blade, cut a 1 cm X 1cm X 1 cm piece <strong>of</strong> muscle with skin from the<br />
dorsal flank area. Rinse muscle with distilled water. Then place in yellow top sterile plastic<br />
bottle. Label – ‘muscle’ and add accession number. Pool 5 muscle samples from 5 fish into<br />
1 bottle <strong>of</strong> the same species <strong>of</strong> fish.<br />
5. Place bottles <strong>of</strong> gill, liver and muscle samples into the freezing-refrigeration unit.<br />
6. Wipe down instruments with 70% ethanol using paper tissues.<br />
Part II. Histology sampling<br />
1. Use external sample instruments for gills/skin-muscle. Use internal sample instruments for<br />
internal organs. Alternatively, if only a single set <strong>of</strong> instruments is available, then, clean and<br />
rinse down the instruments with 70% ethanol and distilled water prior to working on internal<br />
organs. Take photograph <strong>of</strong> any gross abnormality with the identifying accession number.<br />
2. Remove the gill cover to expose the gills. With scissors, cut 1 gill arch and place in 10%<br />
formalin bottle.<br />
3. Sample up to 1 cm x 1 cm x 1 cm piece <strong>of</strong> liver, stomach, spleen, intestines, gall bladder,<br />
swim bladder, kidney-spinal cord, pyloric caeca and gonads. Sample whole heart. Place<br />
these into the 10% formalin bottle.<br />
4. Open the skull, exposing the brain. Remove the brain. Remove an eye. Place the brain and<br />
eye into the 10% formalin bottle.<br />
5. With a scalpel blade, cut a 1 cm x 1 cm x 1 cm piece <strong>of</strong> skin with muscle including the<br />
lateral line - place these into the 10% formalin bottle.<br />
6. Tissues from 5 fish can be placed into 1 formalin bottle. Wipe down instruments with 70%<br />
ethanol using paper tissues.<br />
E. Measures to exclude contamination risks <strong>of</strong> samples for metals and metalloids analysis –<br />
<br />
<br />
<br />
<br />
<br />
<br />
<br />
<strong>Fish</strong> caught should be held in water collected from the river <strong>of</strong> which the sampling site is set<br />
up.<br />
Avoid holding fish from different sites together in the same live fish tank.<br />
Do not use water from other sites to keep fish caught in the sampling area/site.<br />
Rinsing down <strong>of</strong> whole fish with distilled water from the catch/euthanasia container to remove<br />
any attached sediment/mucus before necropsy.<br />
Rinsing <strong>of</strong> tissues for metals and metalloids analysis in distilled water prior to placement into<br />
sterile containers.<br />
Use new sterile, packed instruments and scalpel blades for each batch <strong>of</strong> fish. A batch <strong>of</strong> fish<br />
is fish <strong>of</strong> the one species sampled from one site.<br />
Different sets <strong>of</strong> instruments for external (gills, skin-muscle) and internal (viscera/brain) tissue<br />
samples, or clean instruments between uses with distilled water and 70% ethanol.<br />
<strong>Fitzroy</strong> <strong>River</strong> <strong>Fish</strong> <strong>Pathology</strong> <strong>Report</strong> May 2012<br />
28
Wipe down <strong>of</strong> dissection board with 70% ethanol and paper tissues.<br />
Wear new and clean gloves for each batch <strong>of</strong> fish.<br />
Tissue samples were held in 10% formalin and transported by road to the Biosecurity<br />
Sciences Laboratory.<br />
Tissue samples including gills, liver and muscle were prepared on site and kept frozen in a<br />
freezer for metals and metalloids residue analysis. Samples were kept frozen using a portable<br />
freezer unit during delivery to the Queensland Health Scientific Services Laboratory.<br />
<strong>Fitzroy</strong> <strong>River</strong> <strong>Fish</strong> <strong>Pathology</strong> <strong>Report</strong> May 2012<br />
29
Appendix 2: <strong>Pathology</strong> lesion severity<br />
<strong>Pathology</strong> Lesion Type Mild Moderate Severe<br />
Gill hyperplasia<br />
The section <strong>of</strong> gill<br />
showing primary<br />
filaments and secondary<br />
lamellae demonstrating<br />
filling <strong>of</strong> the interlamellar<br />
space with gill epithelial<br />
cell types between the<br />
secondary lamellae to up<br />
to 25% <strong>of</strong> the space.<br />
The section <strong>of</strong> gill<br />
showing primary<br />
filaments and secondary<br />
lamellae demonstrating<br />
filling <strong>of</strong> the interlamellar<br />
space with gill epithelial<br />
cell types between the<br />
secondary lamellae to up<br />
to 50% <strong>of</strong> the space.<br />
The section <strong>of</strong> gill<br />
showing primary<br />
filaments and secondary<br />
lamellae demonstrating<br />
filling <strong>of</strong> the interlamellar<br />
space with gill epithelial<br />
cell types between the<br />
secondary lamellae to<br />
greater than 50% <strong>of</strong> the<br />
space.<br />
Gill lamellar lifting<br />
The section <strong>of</strong> gill<br />
showing secondary<br />
lamellae where the<br />
epithelial membrane<br />
which is normally<br />
attached to the epithelial<br />
cells is detached from<br />
those cells in up to 25%<br />
<strong>of</strong> the section.<br />
The section <strong>of</strong> gill<br />
showing secondary<br />
lamellae where the<br />
epithelial membrane<br />
which is normally<br />
attached to the epithelial<br />
cells is detached from<br />
those cells in up to 50%<br />
<strong>of</strong> the section.<br />
The section <strong>of</strong> gill<br />
showing secondary<br />
lamellae where the<br />
epithelial membrane<br />
which is normally<br />
attached to the epithelial<br />
cells is detached from<br />
those cells in greater<br />
than 50% <strong>of</strong> the section.<br />
Branchitis<br />
The section <strong>of</strong> gill<br />
showing an infiltration <strong>of</strong><br />
the subepithelial space<br />
with inflammatory cells<br />
such as lumphocytes,<br />
macrophages in up to<br />
25% <strong>of</strong> the section.<br />
The section <strong>of</strong> gill<br />
showing an infiltration <strong>of</strong><br />
the subepithelial space<br />
with inflammatory cells<br />
such as lumphocytes,<br />
macrophages in up to<br />
50% <strong>of</strong> the section.<br />
The section <strong>of</strong> gill<br />
showing an infiltration <strong>of</strong><br />
the subepithelial space<br />
with inflammatory cells<br />
such as lumphocytes,<br />
macrophages in greater<br />
than 50% <strong>of</strong> the section.<br />
Lamellar fusion<br />
The section <strong>of</strong> gill<br />
showing a complete loss<br />
<strong>of</strong> the interlamellar space<br />
with adjacent lamellae<br />
joined together in up to<br />
25% <strong>of</strong> the section.<br />
The section <strong>of</strong> gill<br />
showing a complete loss<br />
<strong>of</strong> the interlamellar space<br />
with adjacent lamellae<br />
joined together in up to<br />
50% <strong>of</strong> the section.<br />
The section <strong>of</strong> gill<br />
showing a complete loss<br />
<strong>of</strong> the interlamellar space<br />
with adjacent lamellae<br />
joined together in greater<br />
than 50% <strong>of</strong> the section.<br />
Granulomas-nematodes<br />
etc<br />
The section <strong>of</strong> organ<br />
(e.g. stomach, gut etc)<br />
with the presence <strong>of</strong><br />
encapsulating lesions<br />
comprised <strong>of</strong><br />
inflammatory cells,<br />
fibrous connective tissue<br />
and degenerate cellular<br />
material or nematode<br />
The section <strong>of</strong> organ<br />
(e.g. stomach, gut etc)<br />
with the presence <strong>of</strong><br />
encapsulating lesions<br />
comprised <strong>of</strong><br />
inflammatory cells,<br />
fibrous connective tissue<br />
and degenerate cellular<br />
material or nematode<br />
The section <strong>of</strong> organ<br />
(e.g. stomach, gut etc)<br />
with the presence <strong>of</strong><br />
encapsulating lesions<br />
comprised <strong>of</strong><br />
inflammatory cells,<br />
fibrous connective tissue<br />
and degenerate cellular<br />
material or nematode<br />
<strong>Fitzroy</strong> <strong>River</strong> <strong>Fish</strong> <strong>Pathology</strong> <strong>Report</strong> May 2012<br />
30
<strong>Pathology</strong> Lesion Type Mild Moderate Severe<br />
tissue in the central area.<br />
Granulomas may be due<br />
to non-nematode<br />
causes. Where the<br />
granulomas take up to<br />
25% <strong>of</strong> the section <strong>of</strong><br />
organ either by number<br />
or size <strong>of</strong> granulomas.<br />
tissue in the central area.<br />
Granulomas may be due<br />
to non-nematode<br />
causes. Where the<br />
granulomas take up to<br />
50% <strong>of</strong> the section <strong>of</strong><br />
organ either by number<br />
or size <strong>of</strong> granulomas.<br />
tissue in the central area.<br />
Granulomas may be due<br />
to non-nematode<br />
causes. Where the<br />
granulomas take up<br />
greater than 50% <strong>of</strong> the<br />
section <strong>of</strong> organ either by<br />
number or size <strong>of</strong><br />
granulomas.<br />
Trematodes<br />
The presence <strong>of</strong><br />
trematode metacercarial<br />
life stage <strong>of</strong> the parasite<br />
occurring in the target<br />
organ (e.g. gills, liver,<br />
muscle etc) <strong>of</strong> the<br />
section at up to 10<br />
individual parasites.<br />
Localised distribution up<br />
to 25% <strong>of</strong> organ section.<br />
The presence <strong>of</strong><br />
trematode metacercarial<br />
life stage <strong>of</strong> the parasite<br />
occurring in the target<br />
organ (e.g. gills, liver,<br />
muscle etc) <strong>of</strong> the<br />
section at greater than<br />
10 individual parasites.<br />
Typically 10-50 parasites<br />
per section, some<br />
variation depending on<br />
size <strong>of</strong> parasite.<br />
Distribution <strong>of</strong> parasite<br />
up to 50% <strong>of</strong> organ<br />
section.<br />
The presence <strong>of</strong><br />
trematode metacercarial<br />
life stage <strong>of</strong> the parasite<br />
occurring in the target<br />
organ (e.g. gills, liver,<br />
muscle etc) <strong>of</strong> the<br />
section at greater than<br />
10 individual parasites.<br />
Typically 50-100 or<br />
greater parasites per<br />
section, some variation<br />
depending on size <strong>of</strong><br />
parasite. Distribution <strong>of</strong><br />
parasite up to 50% <strong>of</strong><br />
organ section.<br />
Cestodes<br />
The presence <strong>of</strong> either<br />
larval or adult life stages<br />
<strong>of</strong> cestode in the target<br />
organ (gastrointestinal<br />
tract for adults, nongastrointestinal<br />
tissues<br />
for larvae) <strong>of</strong> the section<br />
at up to 2-3 individual<br />
parasites. Localised<br />
distribution up to 25% <strong>of</strong><br />
organ section.<br />
The presence <strong>of</strong> either<br />
larval or adult life stages<br />
<strong>of</strong> cestode in the target<br />
organ (gastrointestinal<br />
tract for adults, nongastrointestinal<br />
tissues<br />
for larvae) <strong>of</strong> the section<br />
at greater than 2-3<br />
individual parasites.<br />
Typically up to 5-6<br />
parasites per section,<br />
some variation<br />
depending on size <strong>of</strong><br />
parasite. Distribution <strong>of</strong><br />
parasite up to 50% <strong>of</strong><br />
organ section.<br />
The presence <strong>of</strong> either<br />
larval or adult life stages<br />
<strong>of</strong> cestode in the target<br />
organ (gastrointestinal<br />
tract for adults, nongastrointestinal<br />
tissues<br />
for larvae) <strong>of</strong> the section<br />
at greater than 2-3<br />
individual parasites.<br />
Typically 10 parasites or<br />
greater per section,<br />
some variation<br />
depending on size <strong>of</strong><br />
parasite. Distribution <strong>of</strong><br />
parasite greater than<br />
50% <strong>of</strong> organ section.<br />
Gill/skin parasites<br />
The presence <strong>of</strong><br />
ectoparasites and<br />
endoparasites on/in the<br />
gill and skin tissues. A<br />
mix <strong>of</strong> parasites is <strong>of</strong>ten<br />
The presence <strong>of</strong><br />
ectoparasites and<br />
endoparasites on/in the<br />
gill and skin tissues. A<br />
mix <strong>of</strong> parasites is <strong>of</strong>ten<br />
The presence <strong>of</strong><br />
ectoparasites and<br />
endoparasites on/in the<br />
gill and skin tissues. A<br />
mix <strong>of</strong> parasites is <strong>of</strong>ten<br />
<strong>Fitzroy</strong> <strong>River</strong> <strong>Fish</strong> <strong>Pathology</strong> <strong>Report</strong> May 2012<br />
31
<strong>Pathology</strong> Lesion Type Mild Moderate Severe<br />
encountered. Each<br />
individual parasite<br />
species up to 10 per<br />
section and localised<br />
distribution up to 25% <strong>of</strong><br />
organ section.<br />
encountered. Each<br />
individual parasite<br />
species greater than 10<br />
per section. Typically<br />
10-50 parasites per<br />
section, some variation<br />
depending on size <strong>of</strong><br />
parasite. Distribution up<br />
to 50% <strong>of</strong> organ section.<br />
encountered. Each<br />
individual parasite<br />
species greater than 10<br />
per section. Typically<br />
50-100 parasites or<br />
greater per section,<br />
some variation<br />
depending on size <strong>of</strong><br />
parasite. Distribution up<br />
to 50% <strong>of</strong> organ section.<br />
Melanomacrophage<br />
centres (MMCs)<br />
The presence <strong>of</strong> distinct<br />
aggregates <strong>of</strong><br />
macrophages which<br />
produce melanin pigment<br />
localised in kidney, liver<br />
or spleen sections. Mild<br />
MMCs reaction is<br />
typically identified by<br />
presence <strong>of</strong> low numbers<br />
(10-20), small MMCs<br />
with limited melanin<br />
content<br />
The presence <strong>of</strong> distinct<br />
aggregates <strong>of</strong><br />
macrophages which<br />
produce melanin pigment<br />
localised in kidney, liver<br />
or spleen sections.<br />
Moderate MMCs reaction<br />
is typically identified by<br />
presence <strong>of</strong> increased<br />
numbers (greater than<br />
10-20), larger MMCs with<br />
increased melanin<br />
content (more dark,<br />
some brown) and<br />
occupying up to 50% <strong>of</strong><br />
organ section.<br />
The presence <strong>of</strong> distinct<br />
aggregates <strong>of</strong><br />
macrophages which<br />
produce melanin pigment<br />
localised in kidney, liver<br />
or spleen sections.<br />
Severe MMCs reaction is<br />
typically identified by<br />
presence <strong>of</strong> high<br />
numbers (20-50 or<br />
greater) <strong>of</strong> large MMCs<br />
with mostly melanin<br />
content (dark mostly)<br />
and occupying greater<br />
than 50% <strong>of</strong> organ<br />
section.<br />
Kidney eosinophilic<br />
change<br />
The presence <strong>of</strong> renal<br />
tubules with epithelial<br />
cells that contain<br />
granules <strong>of</strong> eosinophilic<br />
(pink) in the cytoplasm.<br />
There will be a minimal<br />
degree <strong>of</strong> tubular cell<br />
degeneration. Localised<br />
lesion limited to 25% <strong>of</strong><br />
section <strong>of</strong> kidney.<br />
The presence <strong>of</strong> renal<br />
tubules with epithelial<br />
cells that contain<br />
granules <strong>of</strong> eosinophilic<br />
(pink) in the cytoplasm.<br />
There will be an<br />
increasing degree <strong>of</strong><br />
tubular cell degeneration.<br />
Lesion up to 50% <strong>of</strong><br />
section <strong>of</strong> kidney.<br />
The presence <strong>of</strong> renal<br />
tubules with epithelial<br />
cells that contain<br />
granules <strong>of</strong> eosinophilic<br />
(pink) in the cytoplasm.<br />
There will be an<br />
extensive degree <strong>of</strong><br />
tubular cell degeneration.<br />
Lesion greater than 50%<br />
<strong>of</strong> section <strong>of</strong> kidney.<br />
Kidney vacuolar change<br />
The presence <strong>of</strong> renal<br />
tubules with epithelial<br />
cells that have<br />
vacuolated cytoplasm.<br />
There will be a minimal<br />
degree <strong>of</strong> tubular cell<br />
degeneration. Localised<br />
lesion limited to 25% <strong>of</strong><br />
The presence <strong>of</strong> renal<br />
tubules with epithelial<br />
cells that have<br />
vacuolated cytoplasm.<br />
There will be an<br />
increasing degree <strong>of</strong><br />
tubular cell degeneration.<br />
Lesion up to 50% <strong>of</strong><br />
The presence <strong>of</strong> renal<br />
tubules with epithelial<br />
cells that have<br />
vacuolated cytoplasm.<br />
There will be an<br />
extensive degree <strong>of</strong><br />
tubular cell degeneration.<br />
Lesion greater than 50%<br />
<strong>Fitzroy</strong> <strong>River</strong> <strong>Fish</strong> <strong>Pathology</strong> <strong>Report</strong> May 2012<br />
32
<strong>Pathology</strong> Lesion Type Mild Moderate Severe<br />
section <strong>of</strong> kidney. section <strong>of</strong> kidney. <strong>of</strong> section <strong>of</strong> kidney.<br />
Organ congestion<br />
The presence <strong>of</strong><br />
increased amount <strong>of</strong><br />
erythrocytes within the<br />
blood vessels and<br />
channels invarious<br />
organs mainly spleen,<br />
liver or kidney but also<br />
external symptoms <strong>of</strong><br />
reness due to blood<br />
pooling or hyperaemia.<br />
Some organs normally<br />
contain more blood as<br />
part <strong>of</strong> their function to<br />
filter the blood e.g.<br />
spleen and kidney.<br />
Organ congestion<br />
typically results in organ<br />
swelling and erythrocytes<br />
which don’t appear well<br />
spaced in the vessel.<br />
The erythrocytes are<br />
clumped together and<br />
there may be distension<br />
<strong>of</strong> the blood vessel or<br />
channel.<br />
Moderate congestion in<br />
spleen – reduced spaces<br />
in the splenic trabeculae,<br />
bulging <strong>of</strong> splenic<br />
capsule, spleen section<br />
with up to 50% red blood<br />
cells.<br />
Moderate congestion in<br />
the liver – more blood<br />
vessels fully filled with<br />
blood, hepatic canaliculi<br />
with more erythrocytes.<br />
Moderate congestion in<br />
the kidney –<br />
compression <strong>of</strong> the<br />
haematopoetic cells with<br />
erythrocytes, some<br />
displacement <strong>of</strong> other<br />
kidney structures with<br />
blood cells.<br />
Severe congestion in<br />
spleen – no spaces in<br />
the splenic trabeculae,<br />
bulging <strong>of</strong> splenic<br />
capsule, spleen section<br />
with greater than 50%<br />
red blood cells.<br />
Severe congestion in the<br />
liver – most blood<br />
vessels fully filled with<br />
blood, hepatic canaliculi<br />
with more erythrocytes,<br />
areas <strong>of</strong> blood pooling in<br />
liver parenchyma outside<br />
<strong>of</strong> main hepatic blood<br />
vessels.<br />
Severe congestion in the<br />
kidney – compression <strong>of</strong><br />
the haematopoietic cells<br />
with erythrocytes,<br />
significant displacement<br />
<strong>of</strong> other kidney structures<br />
with blood cells.<br />
Mild congestion in spleen<br />
– visible spaces in the<br />
splenic trabeculae, no<br />
bulging <strong>of</strong> splenic<br />
capsule.<br />
Mild congestion in the<br />
liver – some blood<br />
vessels fully filled with<br />
blood, a few cells in the<br />
hepatic canaliculi.<br />
Mild congestion in the<br />
kidney – minimal<br />
compression <strong>of</strong> the<br />
haematopoietic cells with<br />
erythrocytes although<br />
most cells are<br />
erythrocytes.<br />
<strong>Fitzroy</strong> <strong>River</strong> <strong>Fish</strong> <strong>Pathology</strong> <strong>Report</strong> May 2012<br />
33
<strong>Pathology</strong> Lesion Type Mild Moderate Severe<br />
Myopathy<br />
The presence <strong>of</strong> muscle<br />
fibres that have a loss in<br />
staining intensity (pale),<br />
with evidence <strong>of</strong><br />
fragmentation and<br />
eventual loss <strong>of</strong> the<br />
muscle fibre or bundle<br />
leaving only the<br />
surrounding connective<br />
tissue. Muscle<br />
fragments with rounded<br />
edges <strong>of</strong> varying sizes<br />
occur in the space<br />
delimited by the<br />
muscular fascia.<br />
Surrounded by normal<br />
appearing muscle. Note:<br />
artifactual muscle<br />
fracturing is noticeable<br />
when fragments <strong>of</strong><br />
muscle have sharp<br />
edges and may float out<br />
<strong>of</strong> section.<br />
Up to 25% section<br />
affected.<br />
Up to 50% section<br />
affected.<br />
Greater than 50%<br />
section affected.<br />
Gonad lesion, parasites<br />
Parasites inside either<br />
male or female gonads.<br />
Parasites may form cysts<br />
within the gonad. Up to<br />
10 cysts per section.<br />
Parasites inside either<br />
male or female gonads.<br />
Parasites may form cysts<br />
within the gonad.<br />
Greater than 10 cysts<br />
per section. Typically<br />
10-50 parasites per<br />
section, some variation<br />
depending on size <strong>of</strong><br />
parasite<br />
Parasites inside either<br />
male or female gonads.<br />
Parasites may form cysts<br />
within the gonad.<br />
Greater than 10 cysts<br />
per section. Typically<br />
50-100 or greater<br />
parasites per section,<br />
some variation<br />
depending on size <strong>of</strong><br />
parasite<br />
<strong>Fitzroy</strong> <strong>River</strong> <strong>Fish</strong> <strong>Pathology</strong> <strong>Report</strong> May 2012<br />
34
<strong>Pathology</strong> Lesion Type Mild Moderate Severe<br />
Other lesions<br />
These are lesions which<br />
are observed<br />
infrequently, that is they<br />
are observed in<br />
individual fish. They<br />
include lesions that do<br />
not have an obvious<br />
cause or parasites that<br />
are not clearly identified.<br />
These are lesions which<br />
are observed<br />
infrequently, that is they<br />
are observed in<br />
individual fish. They<br />
include lesions that do<br />
not have an obvious<br />
cause or parasites that<br />
are not clearly identified.<br />
These are lesions which<br />
are observed<br />
infrequently, that is they<br />
are observed in<br />
individual fish. They<br />
include lesions that do<br />
not have an obvious<br />
cause or parasites that<br />
are not clearly identified.<br />
Up to 25% <strong>of</strong> target<br />
organ affected.<br />
Up to 50% <strong>of</strong> target<br />
organ affected.<br />
Greater than 50% <strong>of</strong><br />
target organ affected.<br />
<strong>Fitzroy</strong> <strong>River</strong> <strong>Fish</strong> <strong>Pathology</strong> <strong>Report</strong> May 2012<br />
35
Appendix 3: Gross pathology and histopathology for<br />
species, site and sampling occasion<br />
Table A3.1: Number and severity <strong>of</strong> pathology lesions for A. graeffei from the Reference and<br />
Investigation sites during the September 2008, January 2009 and May 2009 sampling occasions<br />
Number <strong>of</strong> fish collected in September 2008 – 10<br />
Number <strong>of</strong> fish collected in January 2009 – 24<br />
Number <strong>of</strong> fish collected in May 2009 – 23<br />
Site Reference Site 1<br />
Sampling occasion<br />
Sep<br />
08<br />
Fairbairn Dam<br />
Jan<br />
09<br />
May<br />
09<br />
Reference<br />
Site 2<br />
Moura,<br />
Dawson<br />
<strong>River</strong><br />
Jan<br />
09<br />
May<br />
09<br />
Investigation Site 1<br />
Sep<br />
08<br />
Bedford Weir<br />
Jan<br />
09<br />
May<br />
09<br />
Investigation Site 2<br />
Sep<br />
08<br />
Tartrus Weir<br />
Jan<br />
09<br />
May<br />
09<br />
Investigation<br />
Site 3<br />
Bingengang<br />
Weir<br />
Jan May<br />
09 09<br />
Investigation<br />
Site 4<br />
<strong>Fitzroy</strong><br />
Barrage<br />
Jan<br />
09<br />
May<br />
09<br />
No. <strong>of</strong> fish collected 0 0 0 5 6 5 5 5 5 5 4 5 5 4 3<br />
Range <strong>of</strong> fish length<br />
(cm)<br />
0 0 0 41-<br />
49<br />
30-<br />
44<br />
34-<br />
68<br />
36-<br />
47<br />
30-<br />
40<br />
36-<br />
72<br />
34 26-<br />
44<br />
26-<br />
59<br />
18-<br />
30<br />
40 32-<br />
44<br />
Av. fish length (cm) 0 0 0 46 N/A N/A N/A 34 47 N/A 34 41 25 N/A N/A<br />
<strong>Pathology</strong> Lesion Type<br />
Gill hyperplasia - - - M 3<br />
D 1<br />
D 2<br />
S 4<br />
M 3<br />
D 2<br />
M 2<br />
D 2<br />
M 2<br />
D 3<br />
M 1<br />
D 3<br />
D 3<br />
S 1<br />
D 1<br />
S 4<br />
M 2<br />
D 3<br />
M 2<br />
D 1<br />
D 4 M 3<br />
D 2<br />
D 4<br />
S 1<br />
* M 2<br />
D 1<br />
Gill lamellar lifting - - - M 1 D 2<br />
D 2 D 3 D 3 D2 D 3 * M 2<br />
S 4<br />
S 1<br />
D 1<br />
Bronchitis - - - - D 2 - M 3 D 2 - D 1 D 4 - D 4 * D 2<br />
S 4 D 2 S 1<br />
Lamellar fusion - - - - D 1 M 1 - M 1 M 3 - S 1 - - * M 1<br />
D 1<br />
Granulomasnematodes<br />
- - - M 1 M 1 - - - M 2 M 1 - - M 1 - M 2<br />
etc<br />
Trematodes - - - M 3 M 4 M 4 M 1 M 2 M2 M 3 M 3 M 2 M 4 M 3 M 3<br />
Cestodes - - - - - - - - - - - - - - -<br />
Gill/skin parasites - - - M 1 M 1 M 3 M 2 M 1 M 1 M 3 M 2 M 1 - M 1 M 2<br />
Melanomacrophage<br />
centres<br />
- - - M 2<br />
D 2<br />
M 3<br />
D 2<br />
S 1<br />
M 2<br />
D 2<br />
M 2 M 3<br />
D 2<br />
M 2<br />
D 3<br />
M 3<br />
D 1<br />
M 3<br />
D 1<br />
M 1<br />
D 1<br />
M 2 M 1<br />
D 1<br />
S 2<br />
Kidney eosinophilic - - - - - - - - - - - - - - -<br />
change<br />
Kidney vacuolar<br />
change<br />
- - - - M 1<br />
D 1<br />
- - D 3 - - - - D 5 - M 1<br />
D 1<br />
Organ congestion - - - - D 2 D 3 - D 5 D 4 - D 2 D 1 D 5 - D 2<br />
S 1<br />
Myopathy - - - M 1 - - M 4 - - - - - - - -<br />
Gonad lesion, - - - - - - - - - - - - - - -<br />
parasites<br />
Other lesions - - - M 2 - M 1 D 5 M 1 M 4 - M 1 M 1 M 1 - -<br />
D 3<br />
Legend: - – pathology lesion type not observed<br />
M – mild<br />
D – moderate<br />
S – severe<br />
N/A – not available due to length measurements not taken on all <strong>of</strong> the samples<br />
* – gill samples not taken<br />
D 2<br />
S 1<br />
<strong>Fitzroy</strong> <strong>River</strong> <strong>Fish</strong> <strong>Pathology</strong> <strong>Report</strong> May 2012<br />
36
Table A3.2: Number and severity <strong>of</strong> pathology lesions for M. ambigua from the Reference and<br />
Investigation sites during the September 2008, January 2009 and May 2009 sampling occasions<br />
Number <strong>of</strong> fish collected in September 2008 – 5<br />
Number <strong>of</strong> fish collected in January 2009 – 21<br />
Number <strong>of</strong> fish collected in May 2009 – 16<br />
Site Reference Site 1<br />
Sampling occasion<br />
Sep<br />
08<br />
Fairbairn Dam<br />
Jan<br />
09<br />
May<br />
09<br />
Reference<br />
Site 2<br />
Moura,<br />
Dawson<br />
<strong>River</strong><br />
Jan<br />
09<br />
May<br />
09<br />
Investigation Site 1<br />
Sep<br />
08<br />
Bedford Weir<br />
Jan<br />
09<br />
May<br />
09<br />
Investigation Site 2<br />
Sep<br />
08<br />
Tartrus Weir<br />
Jan<br />
09<br />
May<br />
09<br />
Investigation<br />
Site 3<br />
Bingengang<br />
Weir<br />
Jan May<br />
09 09<br />
Investigation<br />
Site 4<br />
<strong>Fitzroy</strong><br />
Barrage<br />
Jan<br />
09<br />
May<br />
09<br />
No. <strong>of</strong> fish collected 5 5 1 2 3 0 0 2 0 7 7 5 3 2 0<br />
Range <strong>of</strong> fish length 25- 19- 22 36- 34- 0 0 18- 0 18- 21- 25- 31- 14- 0<br />
(cm)<br />
39 37<br />
40 36<br />
28<br />
45 39 32 36 17<br />
Av. fish length (cm) N/A 24 22 38 34 0 0 23 0 32 26 N/A 34 16 0<br />
<strong>Pathology</strong> Lesion Type<br />
Gill hyperplasia D 2 M 3 - - M 2 - - M 1 - M 1 M 2 D 1 D 1 - -<br />
S 1 D 1<br />
D 1<br />
D 1<br />
D 5 S 2<br />
Gill lamellar lifting - - - - - - - - - - D 1 - M 1 - -<br />
D 1<br />
Bronchitis - - - - - - - - - - - - - - -<br />
Lamellar fusion - M 2 - M 1 - - - - - M 3 M 1 M 1 S 1 M 1 -<br />
Granulomasnematodes<br />
- D 4 M 1 - S 3 - - D 1 - M 2 M 3 M 3 S 3 M 1 -<br />
etc<br />
S 1<br />
S 1 D 1<br />
S 4<br />
D 2<br />
S 2<br />
S 2 D 1<br />
Trematodes - M 1 - M 1 M 2 - - - - M 2 M 2 M 1 M 1 - -<br />
Cestodes - - - - - - - - - - - - - M 1 -<br />
Gill/skin parasites M 2 M 4 - M 1 M 1 - - D 1 - M 6 M 5 M 4 M 2 M 2 -<br />
Melanomacrophage<br />
centres<br />
M 2<br />
D 1<br />
D 1 - M 1<br />
D 1<br />
M 2<br />
D 1<br />
- - - - M 3 M 6 M 2<br />
D 1<br />
M 2<br />
S 1<br />
- -<br />
Kidney eosinophilic - - - - - - - - - - - - - - -<br />
change<br />
Kidney vacuolar - - - - - - - - - - - - - - -<br />
change<br />
Organ congestion M 2 - - - D 1 - - - - D 1 - D 1 D 2 - -<br />
D 2<br />
Myopathy - M 1 - - - - - - - M 2 - - - -<br />
Gonad lesion, - - - - - - - - - - - - M 1 - -<br />
parasites<br />
Other lesions M 2 D 1 - - - - - M 2 - M 1 M 1 D 2 M 3 - -<br />
D 2<br />
Legend: - – pathology lesion type not observed<br />
M – mild<br />
D – moderate<br />
S – severe<br />
N/A – not available due to length measurements not taken on all <strong>of</strong> the samples<br />
<strong>Fitzroy</strong> <strong>River</strong> <strong>Fish</strong> <strong>Pathology</strong> <strong>Report</strong> May 2012<br />
37
Table A3.3: Number and severity <strong>of</strong> pathology lesions for O. lineolatus from the Reference and<br />
Investigation sites during the January 2009 and May 2009 sampling occasions<br />
Number <strong>of</strong> fish collected in January 2009 – 18<br />
Number <strong>of</strong> fish collected in May 2009 – 19<br />
Site<br />
Reference<br />
Site 1<br />
Reference<br />
Site 2<br />
Investigation<br />
Site 1<br />
Investigation<br />
Site 2<br />
Investigation<br />
Site 3<br />
Investigation<br />
Site 4<br />
Sampling occasion<br />
Fairbairn Dam<br />
Jan<br />
09<br />
May<br />
09<br />
Moura,<br />
Dawson <strong>River</strong><br />
Jan May<br />
09 09<br />
Bedford Weir<br />
Jan<br />
09<br />
May<br />
09<br />
Tartrus Weir<br />
Jan<br />
09<br />
May<br />
09<br />
Bingengang<br />
Weir<br />
Jan May<br />
09 09<br />
<strong>Fitzroy</strong><br />
Barrage<br />
No. <strong>of</strong> fish collected 1 5 5 4 5 0 4 0 3 5 0 5<br />
Range <strong>of</strong> fish length 31 30-39 21-34 28-35 15-38 0 25-40 0 28-34 24-30 0 20-39<br />
(cm)<br />
Av. fish length (cm) 31 32 29 N/A 29 0 N/A 0 N/A 26 0 34<br />
<strong>Pathology</strong> Lesion Type<br />
Gill hyperplasia - - M 3 D 3<br />
S 1<br />
M 3<br />
D 1<br />
- M 1<br />
D 2<br />
- D 2 D 4<br />
S 1<br />
Jan<br />
09<br />
May<br />
09<br />
- M 3<br />
D 1<br />
Gill lamellar lifting - - - - - - - - - - - -<br />
Bronchitis - - - - - - - - - - - M 1<br />
Lamellar fusion M 1 - - D 1 - - M 1 - - D 2 - -<br />
S 1<br />
Granulomasnematodes<br />
etc<br />
M 1 M 2<br />
D 1<br />
M 3 M 2 M 3<br />
S 1<br />
- S 3 - M 3 M 2<br />
D 2<br />
- M 4<br />
D 1<br />
S 1<br />
Trematodes - M 2 M 3 M 1 M 1 - - - M 2 M 1 - M 2<br />
S 1 D 1<br />
Cestodes - - - - - - - - - - - M 1<br />
Gill/skin parasites - M 1 S 1 M 3 M 2 - M 4 - M 1 M 3 -<br />
Melanomacrophage - - - M 3 M 3 - - - M 1 M 4 - M 2<br />
centres<br />
Kidney eosinophilic - M 1 - - - - - - - - - -<br />
change<br />
Kidney vacuolar - - - - - - - - - - - -<br />
change<br />
Organ congestion - D 3 D 2 D 1 - - - - D 1 D 2 - D 1<br />
S 1<br />
S 2<br />
S 1<br />
S 3<br />
Myopathy - - - - M 1 - - - - M 2 - D 1<br />
Gonad lesion,<br />
- - - M 1 - - - - - - - M 1<br />
parasites<br />
Other lesions - M 1 - - M 2 - - - - - - M 1<br />
D 1<br />
Legend: - – pathology lesion type not observed<br />
M – mild<br />
D – moderate<br />
S – severe<br />
N/A – not available due to length measurements not taken on all <strong>of</strong> the samples<br />
<strong>Fitzroy</strong> <strong>River</strong> <strong>Fish</strong> <strong>Pathology</strong> <strong>Report</strong> May 2012<br />
38
Table 3.4: Number and severity <strong>of</strong> pathology lesions for N. erebi from the Reference and<br />
Investigation sites during the January 2009 and May 2009 sampling occasions<br />
Number <strong>of</strong> fish collected in January 2009 – 30<br />
Number <strong>of</strong> fish collected in May 2009 – 32<br />
Site<br />
Reference<br />
Site 1<br />
Reference<br />
Site 2<br />
Investigation<br />
Site 1<br />
Investigation<br />
Site 2<br />
Investigation<br />
Site 3<br />
Investigation<br />
Site 4<br />
Sampling occasion<br />
Fairbairn Dam<br />
Jan<br />
09<br />
May<br />
09<br />
Moura,<br />
Dawson <strong>River</strong><br />
Jan May<br />
09 09<br />
Bedford Weir<br />
Jan<br />
09<br />
May<br />
09<br />
Tartrus Weir<br />
Jan<br />
09<br />
May<br />
09<br />
Bingengang<br />
Weir<br />
Jan May<br />
09 09<br />
<strong>Fitzroy</strong><br />
Barrage<br />
No. <strong>of</strong> fish collected 5 5 5 5 5 5 7 5 4 5 4 7<br />
Range <strong>of</strong> fish length 14-29 26-32 16-30 20-30 25-35 25-26 10-35 20-30 21-25 22-29 0 18-38<br />
(cm)<br />
Av. fish length (cm) 21 27 22 25 28 N/A N/A 25 24 25 N/A 27<br />
<strong>Pathology</strong> Lesion Type<br />
Gill hyperplasia - - - - - - D 4 - - - - -<br />
Gill lamellar lifting - - - - - D 1 M 1 - - - D 1 D 2<br />
Bronchitis - - - - - - - - - - - -<br />
Lamellar fusion - - - D 1 - - - - - - - -<br />
Granulomas-<br />
M 2 M 2 M 2 M 2 M 2 - M 2 D 2 - M 1 M 2 M 5<br />
nematodes etc<br />
Trematodes M 3 M 1 M 3<br />
S 1<br />
M 2<br />
D 1<br />
S 1<br />
M 3 M 2 M2<br />
D 1<br />
M 1<br />
D 3<br />
Jan<br />
09<br />
May<br />
09<br />
M 1 M 4 M 3 M 1<br />
S 2<br />
Cestodes M 1 - M 2 M 1 - - - - - M 1 - M 1<br />
Gill/skin parasites - - - M 2 - M 1 S 4 M 1 - M 2 M 2 M 2<br />
S 2<br />
Melanomacrophage<br />
centres<br />
D 1 M 5 M 1<br />
D 2<br />
M 1<br />
D 2<br />
S 2 M 2<br />
D 1<br />
M 1<br />
D 2<br />
D 1 M 1 M 1<br />
D 1<br />
M 2 M 3<br />
S 2<br />
Kidney eosinophilic D 3 D 1 M 3 - D 2 - - - - D 2 - S 1<br />
change<br />
Kidney vacuolar - - - - - - D 2 - - D 3 - -<br />
change<br />
Organ congestion - D 1 - - S 1 D 2 - - D 1 - D 2 -<br />
Myopathy - - - - M 1 - - - - M 1 - -<br />
Gonad lesion,<br />
- - - - - - M 2 D 1 D 2 - M 1 -<br />
parasites<br />
D 1<br />
S 1<br />
Other lesions - M 1 M 3 M 2 D 5 - M 1 S 5 M 3 M 1<br />
S 3<br />
Legend: - – pathology lesion type not observed<br />
M – mild<br />
D – moderate<br />
S – severe<br />
N/A – not available due to length measurements not taken on all <strong>of</strong> the samples<br />
- M 1<br />
D 2<br />
<strong>Fitzroy</strong> <strong>River</strong> <strong>Fish</strong> <strong>Pathology</strong> <strong>Report</strong> May 2012<br />
39
Table A3.5: Number and severity <strong>of</strong> pathology lesions for S. hillii from the Reference and<br />
Investigation sites during the January 2009 and May 2009 sampling occasions.<br />
Number <strong>of</strong> fish collected in January 2009 – 21<br />
Number <strong>of</strong> fish collected in May 2009 – 24<br />
Site<br />
Reference<br />
Site 1<br />
Reference<br />
Site 2<br />
Investigation<br />
Site 1<br />
Investigation<br />
Site 2<br />
Investigation<br />
Site 3<br />
Investigation<br />
Site 4<br />
Sampling occasion<br />
Fairbairn Dam<br />
Jan<br />
09<br />
May<br />
09<br />
Moura,<br />
Dawson <strong>River</strong><br />
Jan May<br />
09 09<br />
Bedford Weir<br />
Jan<br />
09<br />
May<br />
09<br />
Tartrus Weir<br />
Jan<br />
09<br />
May<br />
09<br />
Bingengang<br />
Weir<br />
Jan May<br />
09 09<br />
<strong>Fitzroy</strong><br />
Barrage<br />
No. <strong>of</strong> fish collected 5 5 4 5 0 3 7 5 5 5 0 1<br />
Range <strong>of</strong> fish length 19-24 25-42 19-32 32-33 19-24 16-26 20-34 22-27 30-33 17-25 0 26<br />
(cm)<br />
Av. fish length (cm) 22 32 28 33 0 20 N/A 25 N/A 20 0 26<br />
<strong>Pathology</strong> Lesion Type<br />
Gill hyperplasia M 3 M 2 - M 4 - M 1 M 3 D 2 M 3 D 5 - -<br />
D 1 D 2<br />
S 1<br />
D 1<br />
D 1<br />
S 1<br />
D 1<br />
D 1<br />
Gill lamellar lifting D 4 D 1 - M 1 - - M 2 - - - - -<br />
S 1<br />
D 1<br />
Bronchitis - - - - - - - - - - - -<br />
Lamellar fusion - M 1 - D 1 - S 1 M 1 - - - - -<br />
Granulomasnematodes<br />
etc<br />
S 3<br />
M 1 M 3<br />
D 1<br />
M 2 M4 - - M 3 M 2<br />
M 1<br />
M 4 M 1<br />
D 2<br />
Jan<br />
09<br />
May<br />
09<br />
- M 1<br />
Trematodes - - M 3 M 4 - M 2 M 3 M 3 M 2 - - M 1<br />
D 1 S 1 S 1<br />
Cestodes - M 2 M 2 M 1 - M 1 M 3 M 5 - M 1 - -<br />
Gill/skin parasites M 1 M 4 M 2 M 3 - - M 6 M 3 M 3 M 4 - D 1<br />
Melanomacrophage - D 1 M 1 D 3 - M 1 M 1 M 2 D 1 M 1 - -<br />
centres<br />
S 2 D 1<br />
S 1<br />
S 2<br />
S 4<br />
S 4<br />
Kidney eosinophilic - - - - - - - - - M 1 - -<br />
change<br />
Kidney vacuolar - - - - - - - - - - - -<br />
change<br />
Organ congestion D 1 D 1 - - - - D 2 D 3 D 1 D 3 - -<br />
Myopathy M 4 - - - - M 1 M 1 - - - - -<br />
Gonad lesion,<br />
- - - - - - - - - - - -<br />
parasites<br />
Other lesions - M 1 M 1 M 2 - - - M 3<br />
D 1<br />
Legend: - – pathology lesion type not observed<br />
M – mild<br />
D – moderate<br />
S – severe<br />
N/A – not available due to length measurements not taken on all <strong>of</strong> the samples<br />
M 1 M 1<br />
D 1<br />
- -<br />
<strong>Fitzroy</strong> <strong>River</strong> <strong>Fish</strong> <strong>Pathology</strong> <strong>Report</strong> May 2012<br />
40
Appendix 4: Concentrations (mg/kg) <strong>of</strong> metals and metalloids in gill, liver and<br />
muscle sampled from A. graeffei at Bedford Weir and Tartrus Weir, and M.<br />
Ambigua at Fairbairn Dam in September 2008, January 2009 and May 2009<br />
(a) iron, (b) aluminium, (c) chromium, (d) copper, (e) zinc, (f) arsenic, (g) selenium, (h) cadmium, (i) mercury and (j) lead<br />
Concentrations are shown on a log 10 scale.<br />
Bedford Weir, Fe<br />
Fairbairn Dam, Fe<br />
Tartarus Weir, Fe<br />
10000<br />
Gill<br />
Liver<br />
Muscle<br />
10000<br />
Gill<br />
Liver<br />
Muscle<br />
10000<br />
Gill<br />
Liver<br />
Muscle<br />
1000<br />
1000<br />
1000<br />
Concentration<br />
100<br />
Concentration<br />
100<br />
Concentration<br />
100<br />
10<br />
10<br />
10<br />
1<br />
Sept 2008 Jan 2009 May 2009<br />
1<br />
Sept 2008 Jan 2009 May 2009<br />
1<br />
Sept 2008 Jan 2009 May 2009<br />
<strong>Fitzroy</strong> <strong>River</strong> <strong>Fish</strong> <strong>Pathology</strong> <strong>Report</strong> xx June 2012 41
Bedford Weir, Al<br />
Fairbairn Dam, Al<br />
Tartarus Weir, Al<br />
100<br />
Gill<br />
Liver<br />
Muscle<br />
100<br />
100<br />
Gill<br />
Liver<br />
Muscle<br />
Concentration<br />
10<br />
Concentration<br />
10<br />
Concentration<br />
10<br />
1<br />
1<br />
Gill<br />
Liver<br />
Muscle<br />
1<br />
0.1<br />
Sept 2008 Jan 2009 May 2009<br />
0.1<br />
Sept 2008 Jan 2009 May 2009<br />
0.1<br />
Sept 2008 Jan 2009 May 2009<br />
<strong>Fitzroy</strong> <strong>River</strong> <strong>Fish</strong> <strong>Pathology</strong> <strong>Report</strong> May 2012 42
Bedford Weir, Cr<br />
Fairbairn Dam, Cr<br />
Tartarus Weir, Cr<br />
1<br />
Gill<br />
Liver<br />
Muscle<br />
1<br />
Gill<br />
Liver<br />
Muscle<br />
1<br />
Gill<br />
Liver<br />
Muscle<br />
Concentration<br />
0.2<br />
0.1<br />
Concentration<br />
0.2<br />
0.1<br />
Concentration<br />
0.2<br />
0.1<br />
0.02<br />
0.02<br />
0.02<br />
Sept 2008 Jan 2009 May 2009<br />
Sept 2008 Jan 2009 May 2009<br />
Sept 2008 Jan 2009 May 2009<br />
<strong>Fitzroy</strong> <strong>River</strong> <strong>Fish</strong> <strong>Pathology</strong> <strong>Report</strong> May 2012 43
Bedford Weir, Cu<br />
Fairbairn Dam, Cu<br />
Tartarus Weir, Cu<br />
100<br />
100<br />
100<br />
Gill<br />
Liver<br />
Muscle<br />
10<br />
10<br />
10<br />
Concentration<br />
1<br />
Gill<br />
Liver<br />
Muscle<br />
Concentration<br />
1<br />
Concentration<br />
1<br />
Gill<br />
Liver<br />
Muscle<br />
0.1<br />
0.1<br />
0.1<br />
0.01<br />
Sept 2008 Jan 2009 May 2009<br />
0.01<br />
Sept 2008 Jan 2009 May 2009<br />
0.01<br />
Sept 2008 Jan 2009 May 2009<br />
<strong>Fitzroy</strong> <strong>River</strong> <strong>Fish</strong> <strong>Pathology</strong> <strong>Report</strong> May 2012 44
Bedford Weir, Zn<br />
Fairbairn Dam, Zn<br />
Tartarus Weir, Zn<br />
Gill<br />
Liver<br />
Muscle<br />
100<br />
100<br />
100<br />
Concentration<br />
Concentration<br />
Concentration<br />
10<br />
10<br />
10<br />
Gill<br />
Liver<br />
Muscle<br />
Gill<br />
Liver<br />
Muscle<br />
1<br />
Sept 2008 Jan 2009 May 2009<br />
1<br />
Sept 2008 Jan 2009 May 2009<br />
1<br />
Sept 2008 Jan 2009 May 2009<br />
<strong>Fitzroy</strong> <strong>River</strong> <strong>Fish</strong> <strong>Pathology</strong> <strong>Report</strong> May 2012 45
Fairbairn Dam, As<br />
Bedford Weir, As<br />
Tartarus Weir, As<br />
1<br />
1<br />
Gill<br />
Liver<br />
Muscle<br />
1<br />
Gill<br />
Liver<br />
Muscle<br />
0.2<br />
0.2<br />
0.2<br />
Concentration<br />
0.1<br />
Concentration<br />
0.1<br />
Concentration<br />
0.1<br />
0.02<br />
Gill<br />
Liver<br />
Muscle<br />
0.02<br />
0.02<br />
0.01<br />
Sept 2008 Jan 2009 May 2009<br />
0.01<br />
Sept 2008 Jan 2009 May 2009<br />
0.01<br />
Sept 2008 Jan 2009 May 2009<br />
<strong>Fitzroy</strong> <strong>River</strong> <strong>Fish</strong> <strong>Pathology</strong> <strong>Report</strong> May 2012 46
Bedford Weir, Se<br />
Fairbairn Dam, Se<br />
Tartarus Weir, Se<br />
10<br />
10<br />
10<br />
2<br />
2<br />
2<br />
Concentration<br />
1<br />
Concentration<br />
1<br />
Concentration<br />
1<br />
0.2<br />
Gill<br />
Liver<br />
Muscle<br />
0.2<br />
Gill<br />
Liver<br />
Muscle<br />
0.2<br />
Gill<br />
Liver<br />
Muscle<br />
0.1<br />
Sept 2008 Jan 2009 May 2009<br />
0.1<br />
Sept 2008 Jan 2009 May 2009<br />
0.1<br />
Sept 2008 Jan 2009 May 2009<br />
<strong>Fitzroy</strong> <strong>River</strong> <strong>Fish</strong> <strong>Pathology</strong> <strong>Report</strong> May 2012 47
Bedford Weir, Cd<br />
Fairbairn Dam, Cd<br />
Tartarus Weir, Cd<br />
0.15<br />
0.15<br />
0.15<br />
Gill<br />
Liver<br />
Muscle<br />
0.1<br />
0.1<br />
0.1<br />
Concentration<br />
0.05<br />
Concentration<br />
0.05<br />
Gill<br />
Liver<br />
Muscle<br />
Concentration<br />
0.05<br />
Gill<br />
Liver<br />
Muscle<br />
0<br />
0<br />
0<br />
Sept 2008 Jan 2009 May 2009<br />
Sept 2008 Jan 2009 May 2009<br />
Sept 2008 Jan 2009 May 2009<br />
<strong>Fitzroy</strong> <strong>River</strong> <strong>Fish</strong> <strong>Pathology</strong> <strong>Report</strong> May 2012 48
Bedford Weir, Hg<br />
Fairbairn Dam, Hg<br />
Tartarus Weir, Hg<br />
1<br />
1<br />
1<br />
0.2<br />
0.2<br />
0.2<br />
Concentration<br />
0.1<br />
Gill<br />
Liver<br />
Muscle<br />
Concentration<br />
0.1<br />
Concentration<br />
0.1<br />
Gill<br />
Liver<br />
Muscle<br />
0.02<br />
0.02<br />
Gill<br />
Liver<br />
Muscle<br />
0.02<br />
0.01<br />
Sept 2008 Jan 2009 May 2009<br />
0.01<br />
Sept 2008 Jan 2009 May 2009<br />
0.01<br />
Sept 2008 Jan 2009 May 2009<br />
<strong>Fitzroy</strong> <strong>River</strong> <strong>Fish</strong> <strong>Pathology</strong> <strong>Report</strong> May 2012 49
Bedford Weir, Pb<br />
Fairbairn Dam, Pb<br />
Tartarus Weir, Pb<br />
1<br />
1<br />
1<br />
Gill<br />
Liver<br />
Muscle<br />
Gill<br />
Liver<br />
Muscle<br />
0.2<br />
0.2<br />
0.2<br />
Concentration<br />
0.1<br />
Gill<br />
Liver<br />
Muscle<br />
Concentration<br />
0.1<br />
Concentration<br />
0.1<br />
0.02<br />
0.02<br />
0.02<br />
0.01<br />
Sept 2008 Jan 2009 May 2009<br />
0.01<br />
Sept 2008 Jan 2009 May 2009<br />
0.01<br />
Sept 2008 Jan 2009 May 2009<br />
<strong>Fitzroy</strong> <strong>River</strong> <strong>Fish</strong> <strong>Pathology</strong> <strong>Report</strong> May 2012 50