Graphics in LATEX using TikZ - TUG
Graphics in LATEX using TikZ - TUG
Graphics in LATEX using TikZ - TUG

Create successful ePaper yourself
Turn your PDF publications into a flip-book with our unique Google optimized e-Paper software.
<strong>Graphics</strong> <strong>in</strong> L A TEX us<strong>in</strong>g <strong>TikZ</strong><br />
9<br />
12<br />
clock<br />
6<br />
3<br />
12<br />
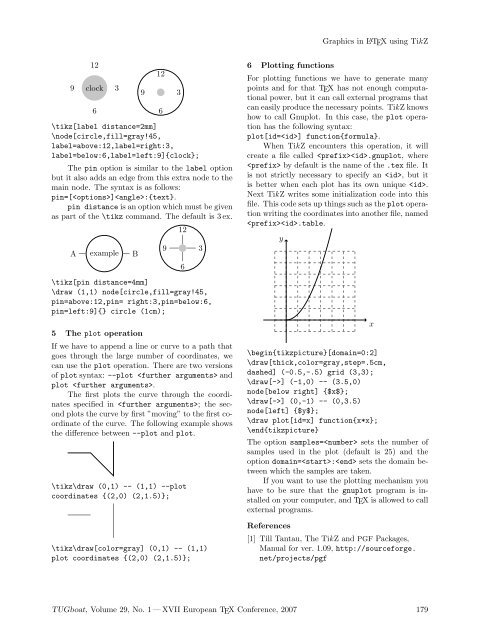
\tikz[label distance=2mm]<br />
\node[circle,fill=gray!45,<br />
label=above:12,label=right:3,<br />
label=below:6,label=left:9]{clock};<br />
9<br />
The p<strong>in</strong> option is similar to the label option<br />
but it also adds an edge from this extra node to the<br />
ma<strong>in</strong> node. The syntax is as follows:<br />
p<strong>in</strong>=[]:{text}.<br />
p<strong>in</strong> distance is an option which must be given<br />
as part of the \tikz command. The default is 3 ex.<br />
A<br />
example<br />
\tikz[p<strong>in</strong> distance=4mm]<br />
\draw (1,1) node[circle,fill=gray!45,<br />
p<strong>in</strong>=above:12,p<strong>in</strong>= right:3,p<strong>in</strong>=below:6,<br />
p<strong>in</strong>=left:9]{} circle (1cm);<br />
B<br />
5 The plot operation<br />
If we have to append a l<strong>in</strong>e or curve to a path that<br />
goes through the large number of coord<strong>in</strong>ates, we<br />
can use the plot operation. There are two versions<br />
of plot syntax: --plot and<br />
plot .<br />
The first plots the curve through the coord<strong>in</strong>ates<br />
specified <strong>in</strong> ; the second<br />
plots the curve by first ”mov<strong>in</strong>g” to the first coord<strong>in</strong>ate<br />
of the curve. The follow<strong>in</strong>g example shows<br />
the difference between --plot and plot.<br />
6<br />
9<br />
3<br />
12<br />
\tikz\draw (0,1) -- (1,1) --plot<br />
coord<strong>in</strong>ates {(2,0) (2,1.5)};<br />
\tikz\draw[color=gray] (0,1) -- (1,1)<br />
plot coord<strong>in</strong>ates {(2,0) (2,1.5)};<br />
6<br />
3<br />
6 Plott<strong>in</strong>g functions<br />
For plott<strong>in</strong>g functions we have to generate many<br />
po<strong>in</strong>ts and for that TEX has not enough computational<br />
power, but it can call external programs that<br />
can easily produce the necessary po<strong>in</strong>ts. <strong>TikZ</strong> knows<br />
how to call Gnuplot. In this case, the plot operation<br />
has the follow<strong>in</strong>g syntax:<br />
plot[id=] function{formula}.<br />
When <strong>TikZ</strong> encounters this operation, it will<br />
create a file called .gnuplot, where<br />
by default is the name of the .tex file. It<br />
is not strictly necessary to specify an , but it<br />
is better when each plot has its own unique .<br />
Next <strong>TikZ</strong> writes some <strong>in</strong>itialization code <strong>in</strong>to this<br />
file. This code sets up th<strong>in</strong>gs such as the plot operation<br />
writ<strong>in</strong>g the coord<strong>in</strong>ates <strong>in</strong>to another file, named<br />
.table.<br />
y<br />
\beg<strong>in</strong>{tikzpicture}[doma<strong>in</strong>=0:2]<br />
\draw[thick,color=gray,step=.5cm,<br />
dashed] (-0.5,-.5) grid (3,3);<br />
\draw[->] (-1,0) -- (3.5,0)<br />
node[below right] {$x$};<br />
\draw[->] (0,-1) -- (0,3.5)<br />
node[left] {$y$};<br />
\draw plot[id=x] function{x*x};<br />
\end{tikzpicture}<br />
The option samples= sets the number of<br />
samples used <strong>in</strong> the plot (default is 25) and the<br />
option doma<strong>in</strong>=: sets the doma<strong>in</strong> between<br />
which the samples are taken.<br />
If you want to use the plott<strong>in</strong>g mechanism you<br />
have to be sure that the gnuplot program is <strong>in</strong>stalled<br />
on your computer, and TEX is allowed to call<br />
external programs.<br />
References<br />
[1] Till Tantau, The <strong>TikZ</strong> and PGF Packages,<br />
Manual for ver. 1.09, http://sourceforge.<br />
net/projects/pgf<br />
x<br />
<strong>TUG</strong>boat, Volume 29, No. 1 — XVII European TEX Conference, 2007 179