Diagxy, a Lego-like diagram package - TUG
Diagxy, a Lego-like diagram package - TUG
Diagxy, a Lego-like diagram package - TUG

Create successful ePaper yourself
Turn your PDF publications into a flip-book with our unique Google optimized e-Paper software.
246 <strong>TUG</strong>boat, Volume 26 (2005), No. 3<br />
Graphics<br />
<strong>Diagxy</strong>, a <strong>Lego</strong>-<strong>like</strong> <strong>diagram</strong> <strong>package</strong><br />
Michael Barr<br />
1 Overview<br />
This is an introduction to my diagxy <strong>package</strong><br />
that sets commutative (usually) <strong>diagram</strong>s using<br />
an interface that patches pieces together, <strong>Lego</strong><br />
style. Since it comes with full documentation/<br />
tutorial, I will just hit the high points here and<br />
refer to the <strong>package</strong> for more details.<br />
There are a number of good <strong>package</strong>s for<br />
making commutative <strong>diagram</strong>s. Mostly, they<br />
are based on \halign. This has advantages and<br />
disadvantages. The advantages are that the syntax<br />
is mostly familiar and the underlying TEX<br />
engine does all the work in its native mode, at<br />
a considerable advantage in speed, not to mention<br />
relative ease in programming. The main<br />
disadvantage from my point of view is lack of<br />
flexibility. TEX makes all the spacing decisions<br />
and the user has few options. I first became<br />
aware of this when I used XY-pic to make a “W”<br />
shaped <strong>diagram</strong> and discovered that, owing to a<br />
mismatch between the various nodes of the <strong>diagram</strong>,<br />
the “W” was leaning to one side. Another<br />
problem was that a fixed distance was used for<br />
arrows and if the label on an arrow was larger<br />
than that distance, it was hard to force it to be<br />
larger and the increments available (by adding<br />
nodes) were large.<br />
In the 1980s I had designed a <strong>diagram</strong> <strong>package</strong><br />
built around L A TEX’s picture mode that was<br />
based on defining shapes that fit together <strong>like</strong><br />
<strong>Lego</strong> blocks. The sizes of the shapes were under<br />
user control. This violates the L A TEX principle<br />
of logical markup, but I do not feel that<br />
<strong>diagram</strong>s can be done using logical markup, at<br />
least not at present. The original <strong>package</strong> had<br />
defined shapes such as squares (really rectangles,<br />
but we call them squares anyway) and triangles<br />
at various orientations that would fit together.<br />
I was limited by the directions available in the<br />
picture mode (an arrow could go in only one of<br />
48 different directions, at a resolution that varies<br />
between 3 and 14 degrees). The <strong>package</strong> was not<br />
entirely satisfactory for other reasons.<br />
One real advantage of XY-pic is that it has a<br />
full 256-character font of line segments in different<br />
directions and two fonts of arrowheads that<br />
allow arrows in any of 512 directions, which is as<br />
many as one could wish for. It was also possible<br />
to make macros to replace the plain TEX arrowheads<br />
with those of XY-pic, giving a more uniform<br />
look to papers, especially ones using many<br />
arrows. Therefore I had the idea a few years ago<br />
of reimplementing my original <strong>package</strong> making<br />
use of the XY-pic arrows. When I sat down to do<br />
this I discovered that, underlying the XY-pic matrix<br />
<strong>package</strong> was a drawing engine of great generality.<br />
In fact, it turned out to be much easier<br />
to use this engine as the back end to my reimplementation<br />
than to just use the arrows. As a<br />
result, it is possible to mix my <strong>diagram</strong> <strong>package</strong><br />
with native XY-pic code with excellent results.<br />
Also, the present diagxy works with both L A TEX<br />
and plain TEX. Except for one incompatibility<br />
described below, diagxy appears to be compatible<br />
with AMS-L A TEX as well, although I have<br />
not tested that extensively.<br />
There are two kinds of people: those who<br />
can read and write syntax <strong>diagram</strong>s and those<br />
who learn by example. I am far out on the latter<br />
limb of what is really a continuum. Accordingly,<br />
most of the documentation of diagxy is in<br />
the form of a tutorial, diaxydoc.tex, that gives<br />
many examples. Even though I designed and<br />
implemented the <strong>package</strong>, I myself still refer to<br />
the tutorial all the time.<br />
2 Simple <strong>diagram</strong>s<br />
The most elementary is<br />
A<br />
g<br />
C<br />
f<br />
k<br />
B<br />
h<br />
D<br />
which is produced using the code<br />
$$\bfig\square[A‘B‘C‘D;f‘g‘h‘k]\efig$$<br />
Here I used the ‘ symbol to separate the nodes.<br />
It seemed to be the symbol that was least <strong>like</strong>ly<br />
to actually be used. If it is, it must be enclosed<br />
in braces to avoid being interpreted by TEX as<br />
a delimiter. Similarly, the ; was chosen as a<br />
character little used in mathematics (although<br />
unfortunately used a lot in computer programs)<br />
that separates the nodes from the arrow labels.<br />
Any of the entries can be left empty. Although<br />
the default is to place all four arrows, optional<br />
arguments allow omission of arrows too. Incidentally,<br />
square brackets are used internally as<br />
delimiters, so any square brackets should also
<strong>TUG</strong>boat, Volume 26 (2005), No. 3 247<br />
be enclosed in braces. Sometimes they are unnecessary,<br />
but they can never hurt and I have<br />
not actually worked out what situations require<br />
their use.<br />
Suppose the square is not large enough. If<br />
you want the <strong>diagram</strong><br />
Hom(A, B) Hom(f,B) Hom(A ′ , B)<br />
Hom(A,g)<br />
Hom(A, B ′ )<br />
Hom(A ′ , B ′ )<br />
Hom(f,B ′ )<br />
Hom(A ′ ,g)<br />
you use size parameters set off by < and > as in<br />
$$\bfig\square[\Hom(A,B)‘<br />
\Hom(A’,B) ‘\Hom(A,B’)‘\Hom(A’,B’);<br />
\Hom(f,B)‘\Hom(A,g)‘ \Hom(A’,g)<br />
‘\Hom(f,B’)]\efig$$<br />
Here the numbers 1000 and 500 refer to the<br />
width and height of the square in units of .01 em.<br />
This is doubtless too fine; I hardly ever use a distance<br />
not a multiple of 10 (or, occasionally, 5),<br />
but I feel that now I am stuck with that choice.<br />
The default is and will be supplied<br />
if not specified.<br />
3 <strong>Lego</strong> blocks<br />
Although simple <strong>diagram</strong>s are the most common,<br />
the real power of diagxy is the ease of<br />
putting blocks together to make more complicated<br />
<strong>diagram</strong>s. In order to do this, there are<br />
parameters, enclosed in (), that tell where to<br />
place a block in the given coordinate system.<br />
For example:<br />
A<br />
g<br />
C<br />
l<br />
E<br />
This is produced by<br />
f<br />
k<br />
n<br />
B<br />
h<br />
D<br />
F<br />
$$\bfig\square(0,500)[A‘B‘C‘D;f‘g‘h‘k]<br />
\square[C‘D‘E‘F;‘l‘m‘n]\efig$$<br />
This is an example of the <strong>Lego</strong> block approach.<br />
Note that C and D are repeated. This is necessary<br />
in order that the arrows be the correct<br />
lengths. On the other hand, there is no need<br />
to repeat k and, if you did, it would by default<br />
appear both above and below the middle arrow.<br />
m<br />
There are other optional parameters to tell<br />
where the arrow labels should go and to change<br />
the arrow style. The latter can get very complicated,<br />
as complicated as XY-pic allows. Arbitrary<br />
XY-pic arrow styles, including arrows that<br />
follow arbitrary Bezier curves, are allowed.<br />
There are a number of basic triangle shapes,<br />
which are named according to the letter in the<br />
alphabet that most neatly fits in the triangle.<br />
For example, a \ptriangle is a right triangle<br />
whose hypotenuse goes from east to south and<br />
an \Atriangle is an isoceles triangle whose base<br />
is horizontal. This example<br />
is produced by<br />
A<br />
h<br />
f<br />
g<br />
B<br />
C B D<br />
$$\bfig\ptriangle[A‘B‘C;f‘h‘g]<br />
\dtriangle[B‘C‘D;‘k‘l]\efig$$<br />
l<br />
An alternate way of making the same <strong>diagram</strong><br />
is given by<br />
$$\bfig\square[A‘B‘C‘D;f‘h‘k‘l]<br />
\morphism(500,500)[B‘C;g]<br />
\efig$$<br />
where \morphism creates the arrow from B to<br />
C.<br />
Incidentally, the effect of \bfig. . .\efig in<br />
a displayed <strong>diagram</strong> is nearly the same as \xy<br />
. . . \endxy except that it has the effect of enclosing<br />
the whole in a \vcenter box so that equation<br />
numbers, if any, are vertically centred. In<br />
case you are curious about the names \bfig and<br />
\efig, I used an NROFF-type system briefly in<br />
the very early 1980s (in the paleolithic era before<br />
TEX) and figures were set off using .BFIG<br />
and .EFIG.<br />
4 In-line arrows<br />
One of my minor gripes about L A TEX is that<br />
the arrows used in text look quite different from<br />
those used in <strong>diagram</strong>s. So one of the things<br />
I have done is define a macro \to that works<br />
somewhat <strong>like</strong> \rightarrow but uses the XY-pic<br />
arrowheads. It has several other features, including<br />
various options, but the most important<br />
is that it grows to accommodate long labels. An<br />
example is A<br />
a long label B, for which the<br />
source is<br />
$A\to^{\mbox{\rm a long label}}B$.<br />
k
248 <strong>TUG</strong>boat, Volume 26 (2005), No. 3<br />
S <br />
NP<br />
<br />
VP<br />
<br />
<br />
NP<br />
VP<br />
Art<br />
N<br />
V t NP<br />
<br />
the man hit<br />
Art<br />
NP<br />
N<br />
the<br />
ball<br />
Figure 1: A tree <strong>diagram</strong> from mathematical linguistics<br />
There are other macros, such as \two and three,<br />
which make double and triple arrows. The directions<br />
of the arrows (right or left) can be independently<br />
set, using standard XY-pic controls.<br />
5 Compatibility<br />
There is nothing in this code (or in XY-pic) that<br />
uses anything but plain TEX. I have used it extensively<br />
under L A TEX and never unearthed any<br />
incompatibility. I have not used it much with<br />
AMS-L A TEX but there is one known incompatibility.<br />
One of the AMS symbol fonts makes a<br />
little box which is named \square. A simple<br />
fix is to load the amsfonts first. If you actually<br />
require that character, then before loading<br />
diagxy, simply say \let\Box\square, to call it<br />
\Box. Incidentally, the @ sign is used in the<br />
XY-pic syntax, along with just about every other<br />
non-alphanumeric character. Thus you cannot<br />
change the catcodes of any of them, which means<br />
there are no private control sequences. Thus one<br />
must be careful not to redefine any of the internal<br />
sequences used.<br />
6 An alternate syntax<br />
A couple years after this <strong>package</strong> was released, I<br />
received a note from a graduate student named<br />
Gerd Zeibig who suggested an alternate syntax<br />
in which you specify the placement of nodes in<br />
the coordinate system and then draw arrows between<br />
them. He had also implemented this in a<br />
way that used two counters for each node. Given<br />
the shortage of counters in standard L A TEX, I decided<br />
to reimplement it using macro definitions<br />
in place of these counters. So it is now possible<br />
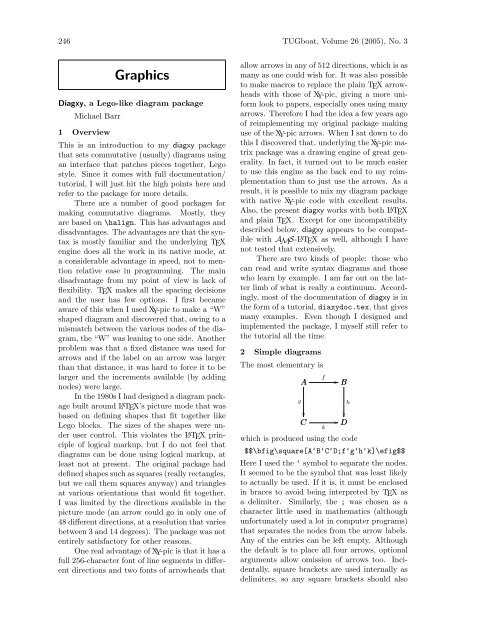
to describe <strong>diagram</strong>s as illustrated below. The<br />
<strong>diagram</strong> in Figure 1 appears in a set of notes<br />
on mathematical linguistics. While there is certainly<br />
no problem producing it using the earlier<br />
code, it is much more systematic to describe<br />
trees in this way:<br />
$$\bfig<br />
\newcommand{\NP}{\hbox{\mit NP}}<br />
\newcommand{\VP}{\hbox{\mit VP}}<br />
\newcommand{\Art}{\hbox{\mit Art}}<br />
\node 1a(0,0)[S]<br />
\node 2a(-600,-300)[\NP]<br />
\node 2b(600,-300)[\VP]<br />
\arrow/-/[1a‘2a;]<br />
\arrow/-/[1a‘2b;]<br />
\node 3a(-900,-600)[\Art]<br />
\node 3b(-300,-600)[N]<br />
\node 3c(300,-600)[V_t]<br />
\node 3d(900,-600)[\NP]<br />
\arrow/-/[2a‘3a;]<br />
\arrow/-/[2a‘3b;]<br />
\arrow/-/[2b‘3c;]<br />
\arrow/-/[2b‘3d;]<br />
\node 4a(-900,-900)[{\sf the}]<br />
\node 4b(-300,-900)[{\sf man}]<br />
\node 4c(300,-900)[{\sf hit}]<br />
\node 4d(600,-900)[\Art]<br />
\node 4e(1200,-900)[N]<br />
\arrow/-/[3a‘4a;]<br />
\arrow/-/[3b‘4b;]<br />
\arrow/-/[3c‘4c;]<br />
\arrow/-/[3d‘4d;]<br />
\arrow/-/[3d‘4e;]<br />
\node 5a(600,-1200)[{\sf the}]<br />
\node 5b(1200,-1200)[{\sf ball}]<br />
\arrow/-/[4d‘5a;]<br />
\arrow/-/[4e‘5b;]<br />
\efig$$<br />
First you define the nodes and then draw<br />
arrows between them. In this case, we wanted<br />
only lines, whence the /-/ specification on the<br />
arrows. The labels on the nodes are almost completely<br />
arbitrary (limited only by what \csname<br />
. . . \endcsname allows).
<strong>TUG</strong>boat, Volume 26 (2005), No. 3 249<br />
µ<br />
T T<br />
T<br />
<br />
T T η ′<br />
1<br />
T η<br />
T η ′ T<br />
2<br />
µT ′ <br />
T T T ′ T T ′<br />
<br />
T σ<br />
T η ′ T T ′<br />
3<br />
T T ′ T T ′<br />
T η ′ T ′<br />
6<br />
id<br />
T T ′ T T T ′ T η ′ T T ′ T T ′ T T ′σ T T ′ T ′ T µ ′ T T ′<br />
σT 4 σT T ′ 5 σT ′<br />
T ′ T<br />
T ′ T T ′<br />
T ′ T ′<br />
T ′<br />
T ′ T η ′<br />
T ′ σT ′<br />
Figure 2: A larger <strong>diagram</strong><br />
7<br />
σ<br />
T ′<br />
µ ′<br />
7 A large <strong>diagram</strong><br />
Figure 2 shows a large <strong>diagram</strong> that is taken directly<br />
from the book Toposes, Triples and Theories<br />
by Michael Barr and Charles Wells, published<br />
by Springer Verlag in 1984. It may well<br />
have been the very first book produced using<br />
L A TEX, which was not released until 1985. Using<br />
diagxy, it can be produced with the following<br />
code.<br />
$$\bfig<br />
\scalefactor{1.4}<br />
\qtriangle(0,1000)/>‘>‘/[TT‘T‘TTT’<br />
;\mu‘TT\eta’‘]<br />
\btriangle(500,1000)/‘>‘@/%<br />
[T‘TTT’‘TT’;‘T\eta‘T\sigma]<br />
\morphism(0,1500)|l|/>/%<br />
[TT‘TT’T;T\eta’T]<br />
\square(500,500)|ammx|/@‘><br />
‘>‘/[TTT’‘TT’‘TT’TT’‘TT’T’;%<br />
\mu T’‘T\eta’TT’‘T\eta’T’‘]<br />
\morphism(1000,1000)|r|/>/[TT’‘TT’;\hbox{\rm id}]<br />
\square/>‘>‘‘>/[TT’T‘TT’TT’‘T’T‘T’<br />
TT’;TT’T\eta’‘\sigma T‘‘T’T\eta’]<br />
\square(500,0)|ammb|[TT’TT’‘TT’T’‘<br />
T’TT’‘T’T’; TT’\sigma‘\sigma TT’<br />
‘\sigma T’‘T’\sigma T’]<br />
\square(1000,0)/>‘‘>‘>/[TT’T’‘TT’<br />
‘T’T’‘T’;T\mu’‘‘\sigma‘\mu’]<br />
\place(500,1250)[1]<br />
\place(215,1000)[2]<br />
\place(750,750)[3]<br />
\place(215,250)[4]<br />
\place(750,250)[5]<br />
\place(1140,750)[6]<br />
\place(1250,250)[7]<br />
\efig$$<br />
8 Availability<br />
diagxy can be found on CTAN in the directory<br />
macros/generic/<strong>diagram</strong>s/barr/, and at my<br />
own ftp site at ftp.math.mcgill.ca/pub/barr/<br />
diagxy.zip.<br />
⋄ Michael Barr<br />
Dept. of Math. and Stats.<br />
McGill University<br />
805 Sherbrooke St. W<br />
Montreal, QC H3A 2K6<br />
Canada<br />
mbarr (at) barrs.org