

solute segregation and antiphase boundary motion in a b2 single ...
solute segregation and antiphase boundary motion in a b2 single ...
solute segregation and antiphase boundary motion in a b2 single ...

You also want an ePaper? Increase the reach of your titles
YUMPU automatically turns print PDFs into web optimized ePapers that Google loves.
WANG <strong>and</strong> CHEN: SOLUTE SEGREGATION 3699<br />
Table 1. The maximum <strong>segregation</strong> (s(r)), degree of <strong>segregation</strong> (sd), the slope <strong>in</strong> the plot of area vs time, <strong>and</strong> the width of <strong>segregation</strong><br />
region as a function of temperature for c ˆ 0:5 att ˆ 37:5<br />
T* Maximum s(r) sd Slope Width (AÊ )<br />
0.123 0.222 0.445 16.6 8.40<br />
0.140 0.162 0.323 17.5 12.6<br />
0.148 0.128 0.255 17.7 12.6<br />
0.164 0.098 0.197 17.8 12.6<br />
0.189 0.078 0.155 17.8 12.6<br />
0.206 0.062 0.124 17.7 16.8<br />
0.222 0.043 0.085 17.5 21.0<br />
5(a), where the magnitude of <strong>segregation</strong> is scaled<br />
by gray-levels with the completely bright scale<br />
represent<strong>in</strong>g the maximum <strong>segregation</strong> <strong>and</strong> the dark<br />
scale represent<strong>in</strong>g no <strong>segregation</strong>. The correspond<strong>in</strong>g<br />
cross section along the ‰1, 1, 0Š-direction is<br />
shown <strong>in</strong> Fig. 5(b), where the asymmetric amplitude<br />
can be clearly seen. The cross section along the<br />
‰1, 1, 0Š-direction is presented <strong>in</strong> Fig. 5(c), which<br />
shows a non-zero concentration <strong>segregation</strong>. The<br />
anisotropy degree, sd, is 0.160 at this composition<br />
<strong>and</strong> temperature, which is less than that <strong>in</strong> the stoichiometric<br />
alloy at the same temperature. The<br />
degree of anisotropy, sd, at di€erent temperatures,<br />
is listed <strong>in</strong> Table 2. When the alloy is <strong>in</strong> the s<strong>in</strong>gle<br />
B2-ordered phase region, Table 2 shows that the<br />
width (16.8±21 A Ê ) of <strong>segregation</strong> at non-stoichiometric<br />
composition is of the same order as that<br />
(8.2±21 A Ê ) at stoichiometric composition, although<br />
the actual values are slightly greater on average <strong>in</strong><br />
the former than <strong>in</strong> the latter.<br />
For this non-stoichiometric composition<br />
(c ˆ 0:3), the size of APD <strong>and</strong> time t* deviates<br />
slightly from the l<strong>in</strong>ear relationship. Us<strong>in</strong>g the same<br />
®tt<strong>in</strong>g procedure as for the stoichiometric alloy, the<br />
best ®tt<strong>in</strong>g gives <strong>in</strong>dex m ˆ 1:98 at T ˆ 0:140,<br />
which implies the g <strong>in</strong> S ˆ k…t † g is slightly larger<br />
than 1.0. At temperature T ˆ 0:164, similar ®tt<strong>in</strong>gs<br />
have been systematically conducted for di€erent<br />
compositions, e.g. c ˆ 0:25, 0.3, 0.35, 0.4, 0.45<br />
<strong>and</strong> 0.5, <strong>and</strong> on both simulation systems, i.e. 64 <br />
64 2 <strong>and</strong> 128 128 2, <strong>in</strong> order to see the size<br />
e€ect of the computer simulation system. For the<br />
128 128 2 system, the <strong>in</strong>itial radius of the circular<br />
<strong>antiphase</strong> doma<strong>in</strong> is 60 unit. The best ®tt<strong>in</strong>gs<br />
from both simulation systems give similar values<br />
for the exponent m listed <strong>in</strong> Table 3. This implies<br />
that the relationship of S±t* at non-stoichiometric<br />
alloy is no longer rigorously l<strong>in</strong>ear, although it is<br />
very close to be<strong>in</strong>g l<strong>in</strong>ear. It is quite surpris<strong>in</strong>g that<br />
the values for m are slightly less than 2.0 for all the<br />
non-stoichiometric alloys <strong>in</strong> the s<strong>in</strong>gle B2-ordered<br />
phase; the reason that the exponent can be less than<br />
2.0 rema<strong>in</strong>s to be <strong>in</strong>vestigated.<br />
The l<strong>in</strong>ear behavior of the s±t relationship can be<br />
written as the l<strong>in</strong>ear relationship between velocity<br />
of shr<strong>in</strong>kage of APD (dR/dt) <strong>and</strong> the curvature of<br />
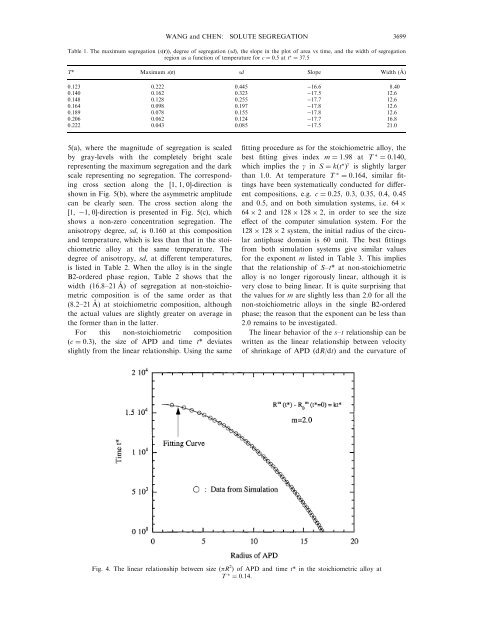
Fig. 4. The l<strong>in</strong>ear relationship between size (pR 2 ) of APD <strong>and</strong> time t* <strong>in</strong> the stoichiometric alloy at<br />
T ˆ 0:14.


