

Multiscale Modeling of Theta ' Precipitation in Al-Cu Binary Alloys
Multiscale Modeling of Theta ' Precipitation in Al-Cu Binary Alloys
Multiscale Modeling of Theta ' Precipitation in Al-Cu Binary Alloys

Create successful ePaper yourself
Turn your PDF publications into a flip-book with our unique Google optimized e-Paper software.
Acta Materialia 52 (2004) 2973–2987<br />
www.actamat-journals.com<br />
<strong>Multiscale</strong> model<strong>in</strong>g <strong>of</strong> h 0 precipitation <strong>in</strong> <strong>Al</strong>–<strong>Cu</strong> b<strong>in</strong>ary alloys<br />
V. Vaithyanathan a, *<br />
, C. Wolverton b , L.Q. Chen a<br />
a Department <strong>of</strong> Materials Science and Eng<strong>in</strong>eer<strong>in</strong>g, The Pennsylvania State University, University Park, PA 16802, USA<br />
b Ford Research and Advanced Eng<strong>in</strong>eer<strong>in</strong>g, MD3083/SRL, Dearborn, MI 48121-2053, USA<br />
Received 4 January 2004; received <strong>in</strong> revised form 4 January 2004; accepted 1 March 2004<br />
Available onl<strong>in</strong>e 8 April 2004<br />
Abstract<br />
We present a multiscale model for study<strong>in</strong>g the growth and coarsen<strong>in</strong>g <strong>of</strong> h 0 precipitates <strong>in</strong> <strong>Al</strong>–<strong>Cu</strong> alloys. Our approach utilizes a<br />
novel comb<strong>in</strong>ation <strong>of</strong> the mesoscale phase-field method with atomistic approaches such as first-pr<strong>in</strong>ciples total energy and l<strong>in</strong>ear<br />
response calculations, as well as a mixed-space cluster expansion coupled with Monte Carlo simulations. We give quantitative firstpr<strong>in</strong>ciples<br />
predictions <strong>of</strong>: (i) bulk energetics <strong>of</strong> the <strong>Al</strong>–<strong>Cu</strong> solid solution and h 0 precipitate phases, (ii) <strong>in</strong>terfacial energies <strong>of</strong> the<br />
coherent and semi-coherent h 0 /<strong>Al</strong> <strong>in</strong>terfaces, and (iii) stress-free misfit stra<strong>in</strong>s and coherency stra<strong>in</strong> energies <strong>of</strong> the h 0 /<strong>Al</strong> system. These<br />
first-pr<strong>in</strong>ciples data comprise all the necessary energetic <strong>in</strong>formation to construct our phase-field model <strong>of</strong> microstructural evolution.<br />
Us<strong>in</strong>g our multiscale approach, we elucidate the effects <strong>of</strong> various energetic contributions on the equilibrium shape <strong>of</strong> h 0 precipitates,<br />
f<strong>in</strong>d<strong>in</strong>g that both the elastic energy and <strong>in</strong>terfacial energy anisotropy contributions play critical roles <strong>in</strong> determ<strong>in</strong><strong>in</strong>g the aspect ratio<br />
<strong>of</strong> h 0 precipitates. Additionally, we have performed a quantitative study <strong>of</strong> the morphology <strong>of</strong> two-dimensional multi-precipitate<br />
microstructures dur<strong>in</strong>g growth and coarsen<strong>in</strong>g, and compared the calculated results with experimentally observed morphologies.<br />
Our multiscale first-pr<strong>in</strong>ciples/phase-field method is completely general and should therefore be applicable to a wide variety <strong>of</strong><br />
problems <strong>in</strong> microstructural evolution.<br />
Ó 2004 Acta Materialia Inc. Published by Elsevier Ltd. <strong>Al</strong>l rights reserved.<br />
Keywords: <strong>Multiscale</strong> model<strong>in</strong>g; <strong>Al</strong>–<strong>Cu</strong>; h 0 Precipitates; Equilibrium aspect ratio<br />
1. Introduction<br />
The solid-state <strong>Al</strong>-rich portion <strong>of</strong> the <strong>Al</strong>–<strong>Cu</strong> phase<br />
diagram consists <strong>of</strong> an <strong>Al</strong> solid solution and a two-phase<br />
field between the <strong>Al</strong> solid solution and h-<strong>Al</strong> 2 <strong>Cu</strong>, an ordered<br />
<strong>in</strong>termetallic phase. h is the thermodynamically<br />
stable phase at high temperatures (for a discussion <strong>of</strong> the<br />
low-temperature stability, however, see [1]) but is k<strong>in</strong>etically<br />
unfavorable for direct precipitation from the<br />
solid solution, especially at temperatures below 250 °C.<br />
The k<strong>in</strong>etically driven precipitation reaction below<br />
250 °C proceeds through a well accepted sequence <strong>of</strong><br />
transformations:<br />
<strong>Al</strong> SS ðsupersaturatedÞ !<strong>Al</strong> SS þ GP zones ! <strong>Al</strong> SS þ h 0<br />
! <strong>Al</strong> SS þ h;<br />
* Correspond<strong>in</strong>g author. Tel.: +1-814-865-0298; fax: +1-814-863-<br />
0618.<br />
E-mail address: vxv115@psu.edu (V. Vaithyanathan).<br />
where <strong>Al</strong> SS represents the alum<strong>in</strong>um solid solution, and<br />
the Gu<strong>in</strong>ier–Preston (GP) zones and h 0 are metastable<br />
precipitate phases. Experimental measurements <strong>of</strong> mechanical<br />
properties as a function <strong>of</strong> ag<strong>in</strong>g time, ag<strong>in</strong>g<br />
temperature, and alloy composition show that the<br />
maximum hardness that occurs <strong>in</strong> the temperature range<br />
<strong>of</strong> 190–230 °C <strong>in</strong> b<strong>in</strong>ary <strong>Al</strong>–<strong>Cu</strong> alloys is associated with<br />
the presence <strong>of</strong> h 0 precipitates <strong>in</strong> the alloy [2,3]. Mechanical<br />
properties, such as yield strength, are controlled<br />
not merely by the amount <strong>of</strong> h 0 present, but also<br />
by the morphology <strong>of</strong> the h 0 precipitate microstructure.<br />
Thus, understand<strong>in</strong>g the morphology and evolution <strong>of</strong><br />
precipitate microstructure is a key step towards predictive<br />
model<strong>in</strong>g <strong>of</strong> mechanical properties.<br />
A large amount <strong>of</strong> experimental work has yielded a<br />
wealth <strong>of</strong> <strong>in</strong>formation about h 0 crystal structure, morphology,<br />
and <strong>in</strong>terface structure: h 0 -<strong>Al</strong> 2 <strong>Cu</strong> is a tetragonal<br />
phase (a slight tetragonal distortion <strong>of</strong> the cubic<br />
CaF 2 structure) with the the follow<strong>in</strong>g orientation<br />
1359-6454/$30.00 Ó 2004 Acta Materialia Inc. Published by Elsevier Ltd. <strong>Al</strong>l rights reserved.<br />
doi:10.1016/j.actamat.2004.03.001
2974 V. Vaithyanathan et al. / Acta Materialia 52 (2004) 2973–2987<br />
relationship with the <strong>Al</strong>-matrix ð001Þ h<br />
0kf001g <strong>Al</strong> [4].<br />
This orientation relationship, where the c-axis <strong>of</strong> the<br />
tetragonal precipitate aligns along the cube axes <strong>of</strong> the<br />
fcc matrix, gives rise to three orientational variants. h 0<br />
precipitates possess a plate-shaped morphology with<br />
coherent ð001Þ h<br />
0kf001g <strong>Al</strong> <strong>in</strong>terfaces along the broad<br />
faces <strong>of</strong> the plates and semi-coherent <strong>in</strong>terfaces around<br />
the rim <strong>of</strong> the plates [4–8]. The observed, large aspect<br />
ratios <strong>of</strong> h 0 plates (<strong>of</strong>ten 40 and higher) vary with ag<strong>in</strong>g<br />
conditions and the process<strong>in</strong>g history <strong>of</strong> the sample.<br />
In the present work, we use a predictive, multiscale<br />
computational methodology to elucidate the physical<br />
factors controll<strong>in</strong>g the h 0 morphology <strong>in</strong> <strong>Al</strong>–<strong>Cu</strong> alloys.<br />
Despite the fact that the h 0 precipitate/matrix <strong>in</strong>terfaces<br />
are coherent along broad faces and semi-coherent<br />
around the rims <strong>of</strong> the plates, many theoretical analyses<br />
related to the equilibrium aspect ratios <strong>of</strong> h 0 plates have<br />
only considered the <strong>in</strong>terfacial energy anisotropy, i.e. the<br />
coherency stra<strong>in</strong> energy contribution to morphology is<br />
ignored. A recent study, however, has analyzed the<br />
observed morphologies <strong>of</strong> h 0 plates with<strong>in</strong> the framework<br />
<strong>of</strong> Khachaturyan–Hairapetyan thermoelastic theory,<br />
<strong>in</strong>clud<strong>in</strong>g both <strong>in</strong>terfacial and coherency stra<strong>in</strong><br />
effects [9]. These authors have found that this theory<br />
could successfully expla<strong>in</strong> many <strong>of</strong> the observed morphologies.<br />
However, the Khachaturyan–Hairapetyan<br />
thermoelastic theory is formulated <strong>in</strong> terms <strong>of</strong> such<br />
quantities as the <strong>in</strong>terfacial energies and elastic constants<br />
<strong>of</strong> precipitate and matrix, and many <strong>of</strong> these<br />
quantities are unknown for the h 0 /<strong>Al</strong> case. Therefore, the<br />
authors <strong>in</strong> [9] <strong>in</strong>ferred the unknown quantities from<br />
measured precipitate morphologies. We take a different<br />
approach. We wish to calculate all <strong>of</strong> the physical<br />
quantities controll<strong>in</strong>g the h 0 morphology start<strong>in</strong>g from<br />
highly accurate first-pr<strong>in</strong>ciples total energy calculations.<br />
We then transfer the <strong>in</strong>formation from these atomic<br />
scale first-pr<strong>in</strong>ciples derived quantities to a mesoscale<br />
phase-field model <strong>of</strong> h 0 microstructural evolution, and<br />
analyze the effects <strong>of</strong> the various physical contributions<br />
on precipitate morphology. We recently <strong>in</strong>troduced this<br />
multiscale model <strong>in</strong> [10], and the present work provides<br />
a more detailed account <strong>of</strong> the various computational<br />
models <strong>in</strong>volved as well as the l<strong>in</strong>ks between them.<br />
Further, we test the quantitative predictions <strong>of</strong> the<br />
multiscale model via a critical comparison aga<strong>in</strong>st<br />
measured data on h 0 morphologies (diameter, thickness,<br />
aspect ratio) as a function <strong>of</strong> ag<strong>in</strong>g time. In addition, we<br />
use our model to elucidate the relevant physical factors<br />
controll<strong>in</strong>g h 0 morphology.<br />
The crux <strong>of</strong> our multiscale model is the phase-field<br />
method, a powerful technique for model<strong>in</strong>g the microstructure<br />
evolution dur<strong>in</strong>g phase transformations and<br />
coarsen<strong>in</strong>g ([11] and references there<strong>in</strong>). However, the<br />
phase-field method relies on various energy contributions<br />
that drive the microstructure evolution: (i) bulk,<br />
(ii) <strong>in</strong>terfacial and (iii) coherency stra<strong>in</strong> energies. The<br />
dearth <strong>of</strong> reliable values <strong>of</strong> these energetic parameters<br />
from experiments has been one primary reason for the<br />
predom<strong>in</strong>antly qualitative nature <strong>of</strong> microstructure<br />
studies us<strong>in</strong>g phase-field. We show how first-pr<strong>in</strong>ciples<br />
calculations based on density functional theory (DFT)<br />
may be used to compute all <strong>of</strong> the energetic contributions<br />
enter<strong>in</strong>g the phase-field model. Thus, we arrive at a<br />
truly predictive model <strong>of</strong> microstructural evolution.<br />
2. Methodologies used to construct the multiscale model<br />
The multiscale model, which is an <strong>in</strong>tegration <strong>of</strong><br />
many different computational methodologies, is illustrated<br />
<strong>in</strong> Fig. 1. We next briefly describe each <strong>of</strong> these<br />
methodologies.<br />
2.1. First-pr<strong>in</strong>ciples total energies<br />
First-pr<strong>in</strong>ciples calculations used <strong>in</strong> this work are<br />
based on density functional theory with<strong>in</strong> the local<br />
density approximation (LDA) with the exchange-correlation<br />
<strong>of</strong> Ceperley and <strong>Al</strong>der [12,13]. In some cases, we<br />
have also compared the LDA results with those from<br />
generalized gradient approximation (GGA) <strong>of</strong> Perdew<br />
[14]. For total energy calculations, we use both fullpotential<br />
l<strong>in</strong>earized augmented plane wave method<br />
(FLAPW) [15] and the pseudopotential method utiliz<strong>in</strong>g<br />
ultras<strong>of</strong>t pseudopotentials as implemented <strong>in</strong> the Vienna<br />
ab <strong>in</strong>itio Simulation Package (VASP) [16]. The firstpr<strong>in</strong>ciples<br />
vibrational entropies used <strong>in</strong> this work are<br />
taken from the l<strong>in</strong>ear response calculations <strong>of</strong> Wolverton<br />
and Ozol<strong>in</strong>s [1], which utilized norm-conserv<strong>in</strong>g<br />
pseudopotentials.<br />
Us<strong>in</strong>g extensive tests, we have ensured that the firstpr<strong>in</strong>ciples<br />
energetics are converged with respect to k<br />
po<strong>in</strong>ts (up to 16 16 16 grids were used) and basis-set<br />
cut<strong>of</strong>fs (E cut ¼ 16:7 and 21.5 Ryd were used <strong>in</strong> the<br />
L<strong>in</strong>ear Response:<br />
F vibrational<br />
Bulk Free<br />
Energies<br />
Cluster Expansion<br />
+ Monte Carlo:<br />
F configurational<br />
Interfacial<br />
Free Energies<br />
First Pr<strong>in</strong>ciples<br />
Atomistics<br />
Coherency<br />
Stra<strong>in</strong> Energy<br />
Phase-field<br />
Microstructure<br />
Models<br />
Number<br />
<strong>of</strong> atoms<br />
(~10 2 ) ~1nm<br />
(~10 5 ) ~10nm<br />
“Mobility<br />
Coefficients”<br />
(~10 11 ) ~1µm<br />
Fig. 1. Schematic <strong>of</strong> the multiscale model, show<strong>in</strong>g different constituent<br />
models and their l<strong>in</strong>ks along with their associated length scales.
V. Vaithyanathan et al. / Acta Materialia 52 (2004) 2973–2987 2975<br />
∆H - FLAPW (meV/atom)<br />
0<br />
-50<br />
-100<br />
-150<br />
-200<br />
Comparison <strong>of</strong> VASP vs. FLAPW Energetics:<br />
fcc-Based <strong>Al</strong>-<strong>Cu</strong> Compounds<br />
-250<br />
-250 -200 -150 -100 -50 0<br />
∆H - VASP (meV/atom)<br />
Fig. 2. Comparison <strong>of</strong> FLAPW and VASP formation energies <strong>of</strong> more<br />
than 20 different fcc-based fully relaxed ordered compounds <strong>of</strong> <strong>Al</strong>–<strong>Cu</strong>.<br />
The average deviation between the two methodsÕ energies is extremely<br />
small (6 meV/atom out <strong>of</strong> the average formation energies <strong>of</strong> more<br />
than 100 meV/atom), thus <strong>in</strong>spir<strong>in</strong>g confidence that the FLAPW/<br />
VASP energies are basically <strong>in</strong>terchangeable for this system.<br />
FLAPW and VASP calculations, respectively). The<br />
structures, <strong>in</strong> all cases, were fully relaxed with respect to<br />
volume as well as all cell-<strong>in</strong>ternal and -external coord<strong>in</strong>ates.<br />
The comb<strong>in</strong>ation <strong>of</strong> different first-pr<strong>in</strong>ciples energetics<br />
<strong>in</strong>to a s<strong>in</strong>gle microstructural model might<br />
<strong>in</strong>itially cause concern, however, we tested the formation<br />
energies <strong>of</strong> more than 20 different fully relaxed fcc-based<br />
ordered compounds <strong>of</strong> <strong>Al</strong>–<strong>Cu</strong> with both the FLAPW<br />
and VASP methods. The average deviation between the<br />
two methodsÕ energies is extremely small (6 meV/atom<br />
out <strong>of</strong> the average formation energies <strong>of</strong> more than 100<br />
meV/atom), thus <strong>in</strong>spir<strong>in</strong>g confidence that the FLAPW/<br />
VASP energies are basically <strong>in</strong>terchangeable for this<br />
system. The comparison between FLAPW and VASP<br />
energies <strong>in</strong> <strong>Al</strong>–<strong>Cu</strong> is shown <strong>in</strong> Fig. 2.<br />
2.2. Mixed-space cluster expansion<br />
The calculation <strong>of</strong> f<strong>in</strong>ite temperature free energy <strong>of</strong> a<br />
disordered solid solution phase is outside the realm <strong>of</strong><br />
direct first-pr<strong>in</strong>ciples calculations, due to the disorder<br />
<strong>in</strong>volved as well as the configurational entropy contribution<br />
associated with it. However, the mixed-space<br />
cluster expansion (MSCE) technique parameterized<br />
from first-pr<strong>in</strong>ciples calculations enables the calculation<br />
<strong>of</strong> disordered solid solution phases at f<strong>in</strong>ite temperatures<br />
<strong>in</strong>clud<strong>in</strong>g the important energetic effects <strong>of</strong> atomic relaxations,<br />
all with the accuracy <strong>of</strong> first-pr<strong>in</strong>ciples energies<br />
[17]. In the MSCE technique, energetics <strong>of</strong> small<br />
unit cell ordered compounds are mapped onto a generalized<br />
Is<strong>in</strong>g-like model for a particular lattice type,<br />
<strong>in</strong>volv<strong>in</strong>g 2-, 3-, and 4-body <strong>in</strong>teractions plus coherency<br />
stra<strong>in</strong> energies (atomic misfit stra<strong>in</strong>). The Hamiltonian<br />
can be <strong>in</strong>corporated <strong>in</strong>to mixed-space Monte Carlo<br />
simulations <strong>of</strong> N 10 5 atoms [18], effectively allow<strong>in</strong>g<br />
one to explore the complexity <strong>of</strong> the 2 N configurational<br />
space at f<strong>in</strong>ite temperatures. The mixed-space CE<br />
Hamiltonian for fcc <strong>Al</strong>–<strong>Cu</strong> used here has been previously<br />
constructed from first-pr<strong>in</strong>ciples total energies <strong>of</strong><br />
41 ordered structures [18].<br />
2.3. Monte Carlo simulations and thermodynamic <strong>in</strong>tegration<br />
Us<strong>in</strong>g the first-pr<strong>in</strong>ciples MSCE Hamiltonian <strong>in</strong><br />
Monte Carlo simulations, we can obta<strong>in</strong> the energy (per<br />
atom) <strong>of</strong> the <strong>Al</strong>–<strong>Cu</strong> solid solution (E SS ) as a function <strong>of</strong><br />
temperature for different solute (<strong>Cu</strong>) compositions. The<br />
mix<strong>in</strong>g enthalpy <strong>of</strong> the solid solution (DH SS ) is obta<strong>in</strong>ed<br />
from E SS by subtract<strong>in</strong>g the composition-weighted average<br />
<strong>of</strong> the pure constituent energies<br />
DH SS ¼ E SS ½X <strong>Cu</strong> E <strong>Cu</strong> þð1<br />
X <strong>Cu</strong> ÞE <strong>Al</strong> Š; ð1Þ<br />
where X <strong>Cu</strong> is the concentration <strong>of</strong> copper, and E <strong>Cu</strong> and<br />
E <strong>Al</strong> are the energies per atom <strong>of</strong> copper and alum<strong>in</strong>um,<br />
respectively, <strong>in</strong> their equilibrium fcc structures. Monte<br />
Carlo simulations can give energetics such as Eq. (1)<br />
directly as an output. However, the entropy cannot be<br />
directed computed <strong>in</strong> a Monte Carlo simulation; <strong>in</strong>stead<br />
one must use techniques such as thermodynamic <strong>in</strong>tegration:<br />
The configurational entropy <strong>of</strong> the disordered<br />
alloy at any f<strong>in</strong>ite temperature T is computed from a<br />
Monte Carlo simulation start<strong>in</strong>g at very high temperatures<br />
(‘‘T ¼1’’) and slowly cool<strong>in</strong>g down [19]. The<br />
follow<strong>in</strong>g thermodynamic relation gives the configurational<br />
entropy at temperature T<br />
DS conf ðT Þ¼DS ideal þ DH Z<br />
SSðT Þ<br />
b<br />
k B DH SS ðb 0 Þ db 0 ;<br />
T<br />
0<br />
ð2Þ<br />
where DS ideal ¼ k B ½X <strong>Cu</strong> lnðX <strong>Cu</strong> Þþð1 X <strong>Cu</strong> Þ lnð1 X <strong>Cu</strong> ÞŠ<br />
is the configurational entropy <strong>of</strong> an ideal solution (reference<br />
entropy at T ¼1), and b ¼ 1=ðk B T Þ, where T is<br />
the temperature (<strong>in</strong> K) and k B is the Boltzmann constant.<br />
The free energy is then given by<br />
DF SS ðT Þ¼DH SS ðT Þ T DS conf ðT Þ<br />
Z b<br />
¼ 1 DH SS ðb 0 Þ db 0 T DS ideal : ð3Þ<br />
b 0<br />
To facilitate the <strong>in</strong>tegration <strong>in</strong> Eq. (3), we fit the mix<strong>in</strong>g<br />
enthalpy to a polynomial <strong>in</strong> b.<br />
The vibrational entropy contribution to the solid<br />
solution free energy is not <strong>in</strong>cluded <strong>in</strong> this calculation.<br />
While a systematic computation <strong>of</strong> the vibrational entropy<br />
<strong>of</strong> configurationally disordered solid solutions <strong>in</strong><br />
<strong>Al</strong>–<strong>Cu</strong> would be <strong>in</strong>terest<strong>in</strong>g, the complexity <strong>of</strong> such<br />
calculations is considerable.
2976 V. Vaithyanathan et al. / Acta Materialia 52 (2004) 2973–2987<br />
2.4. Phase-field model<br />
In the phase-field methodology, a precipitate microstructure<br />
is described by a set <strong>of</strong> cont<strong>in</strong>uum order parameter<br />
fields characteriz<strong>in</strong>g the difference <strong>in</strong> composition<br />
and structure between the precipitate and matrix [11]. In a<br />
two-dimensional representation <strong>of</strong> h 0 precipitates <strong>in</strong> a<br />
b<strong>in</strong>ary <strong>Al</strong>–<strong>Cu</strong> alloy, the precipitate microstructure is described<br />
by one composition field and two orientation-related<br />
long range order parameter fields.<br />
The chemical free energy <strong>of</strong> the microstructure, <strong>in</strong>clud<strong>in</strong>g<br />
the bulk and <strong>in</strong>terfacial energy, is then expressed<br />
as<br />
Z<br />
F bulk þ F <strong>in</strong>t ¼ f ðc; g 1 ; g 2 ; g 3 Þ þ a 2 ðrcÞ2<br />
V<br />
þ 1 X<br />
b<br />
2 ij ðpÞr i g p r j g p<br />
!dV ; ð4Þ<br />
p<br />
where a and b ij ðpÞ are gradient energy coefficients for<br />
composition and order parameters, respectively. b ij ðpÞ is<br />
reta<strong>in</strong>ed as a second rank tensor to <strong>in</strong>corporate the<br />
(tetragonal) anisotropy <strong>in</strong> <strong>in</strong>terfacial energy. The<br />
anisotropy <strong>in</strong> <strong>in</strong>terfacial energy <strong>of</strong> the precipitate is dependent<br />
on the orientational variant, g, <strong>of</strong> the precipitate<br />
(see Fig. 3). S<strong>in</strong>ce the phase-field model used <strong>in</strong> this<br />
study is a dislocation-free model, semi-coherent <strong>in</strong>terfaces<br />
are treated effectively as coherent <strong>in</strong>terfaces with a<br />
larger <strong>in</strong>terfacial energy.<br />
<br />
b ij ð1Þ ¼ b <br />
11ð1Þ 0<br />
;<br />
0 b 22 ð1Þ<br />
<br />
b ij ð2Þ ¼ b <br />
11ð2Þ 0<br />
0 b 22 ð2Þ<br />
c<br />
sc<br />
(η 1 = 0,<br />
η 2 =1 or -1)<br />
<br />
¼ b <br />
22ð1Þ 0<br />
:<br />
0 b 11 ð1Þ<br />
c<br />
(η 1 =1 or -1,<br />
η 2 =0)<br />
ð5Þ<br />
Fig. 3. Schematic <strong>of</strong> the h 0 precipitates <strong>in</strong> 2D show<strong>in</strong>g the two variants<br />
along with their equilibrium order parameters. The <strong>in</strong>terfaces <strong>of</strong> the<br />
variants are marked as coherent (c) and semi-coherent (sc) to show the<br />
symmetry and the <strong>in</strong>terface orientation dependence on the variants.<br />
sc<br />
The bulk free energy describ<strong>in</strong>g the phase-separation<br />
and order-disorder transformation <strong>in</strong>volved dur<strong>in</strong>g<br />
precipitation <strong>of</strong> the h 0 phase is approximated us<strong>in</strong>g the<br />
follow<strong>in</strong>g polynomial <strong>in</strong> c and g:<br />
f ðc; g 1 ; g 2 ; g 3 Þ<br />
¼ A 1 ðc C 1 Þ 2 þ A 2 ðc C 2 Þðg 2 1 þ g2 2 þ g2 3 Þ<br />
þ A 41 ðg 4 1 þ g4 2 þ g4 3 ÞþA 42ðg 2 1 g2 2 þ g2 2 g2 3 þ g2 1 g2 3 Þ<br />
þ A 61 ðg 6 1 þ g6 2 þ g6 3 Þ<br />
þ A 62 fg 4 1 ðg2 2 þ g2 3 Þþg4 2 ðg2 3 þ g2 1 Þþg4 3 ðg2 1 þ g2 2 Þg<br />
þ A 63 ðg 2 1 g2 2 g2 3 Þ;<br />
ð6Þ<br />
where C 1 and C 2 are constants close to the equilibrium<br />
compositions <strong>of</strong> solid solution matrix and h 0 precipitates,<br />
respectively. The coefficients A 41 and A 61 are constra<strong>in</strong>ed<br />
to have negative and positive values, respectively, to<br />
describe a first order phase transition [20].<br />
The elastic energy contribution to the total free energy<br />
<strong>of</strong> the system is obta<strong>in</strong>ed analytically us<strong>in</strong>g the<br />
method <strong>of</strong> Khachaturyan [21,22]. The stress-free misfit<br />
stra<strong>in</strong>, 0 ijðrÞ, between precipitates and matrix, is expressed<br />
as a function <strong>of</strong> the structural order parameters,<br />
0 ij ðrÞ ¼X 0 ij ðpÞg2 p ðrÞ;<br />
ð7Þ<br />
p<br />
where 0 ijðpÞ represents the stress-free stra<strong>in</strong> <strong>of</strong> the pth<br />
variant. With the homogeneous modulus approximation<br />
(matrix and precipitates have similar elastic constants),<br />
the elastic energy <strong>in</strong> terms <strong>of</strong> order parameters can be<br />
expressed as [23]<br />
E el ¼ V 2 k X<br />
ijkl ij kl V k ijkl ij 0 kl ðpÞg2 p ðrÞ<br />
þ V 2 k X X<br />
ijkl 0 ij ðpÞ0 kl ðqÞg2 p ðrÞg2 q ðrÞ<br />
1 X<br />
2<br />
p<br />
p<br />
q<br />
X<br />
Z<br />
q<br />
p<br />
d 3 g<br />
ð2pÞ 3 B pqðnÞfg 2 p ðrÞg g fg2 q ðrÞg g ;<br />
ð8Þ<br />
where k ijkl is the elastic stiffness tensor. B pq ðnÞ ¼<br />
n i r ij ðpÞX jk ðnÞr kl ðqÞn l and X jk ðnÞ is the <strong>in</strong>verse matrix <strong>of</strong><br />
X 1<br />
jk ðnÞ ¼ n ik ijkl n l . n ¼ g=jgj is the unit vector <strong>in</strong> reciprocal<br />
space, fg 2 q ðrÞg g<br />
is the Fourier transform <strong>of</strong> the<br />
square <strong>of</strong> order parameter [g 2 q ðrÞ] and fg2 p ðrÞg g<br />
is the<br />
complex conjugate <strong>of</strong> fg 2 p ðrÞg g . ij ¼ 0 ij þ a ij<br />
is the sum <strong>of</strong><br />
homogeneous stra<strong>in</strong> caused by transformation and external<br />
constra<strong>in</strong>ts or applied stress, respectively. In the<br />
absence <strong>of</strong> applied stra<strong>in</strong>, the fourth term <strong>in</strong> the elastic<br />
energy (Eq. (8)) is the dom<strong>in</strong>ant term controll<strong>in</strong>g the<br />
precipitate morphology.<br />
The temporal evolution <strong>of</strong> the microstructure <strong>in</strong> the<br />
phase-field model is obta<strong>in</strong>ed by numerically solv<strong>in</strong>g the<br />
Cahn–Hilliard and <strong>Al</strong>len–Cahn equations [24]<br />
ocðr; tÞ<br />
ot<br />
¼ Mr 2 dF<br />
dcðr; tÞ ;<br />
ð9Þ
V. Vaithyanathan et al. / Acta Materialia 52 (2004) 2973–2987 2977<br />
og i ðr; tÞ<br />
¼<br />
ot<br />
dF<br />
Lð^/ p Þ ; i ¼ 1; 2; 3; ð10Þ<br />
dg i ðr; tÞ<br />
where M is the solute mobility and Lð^/ p Þ¼LAð^/ p Þ is the<br />
orientation-dependent <strong>in</strong>terfacial k<strong>in</strong>etic parameter. L is<br />
the <strong>in</strong>terfacial k<strong>in</strong>etic coefficient. Interface orientation is<br />
def<strong>in</strong>ed by the unit normal to the precipitate <strong>in</strong>terface,<br />
^/ p ð¼ ~rg p =j~rg p jÞ. The anisotropy <strong>in</strong> <strong>in</strong>terfacial k<strong>in</strong>etics<br />
can be <strong>in</strong>corporated as a function <strong>of</strong> the <strong>in</strong>terface normal<br />
(^/ p ).<br />
The temporal equations (Eqs. (9) and (10)) <strong>in</strong> dimensionless<br />
form can be reduced to<br />
<br />
oc<br />
ot ¼ M r 2 <strong>of</strong> <br />
nr 2 c ; ð11Þ<br />
oc<br />
og p<br />
ot ¼<br />
Lð^/ p Þ<br />
L<br />
"<br />
<strong>of</strong> <br />
og p<br />
#<br />
w ii ðpÞr 2 i g p þ dE el<br />
; ð12Þ<br />
dg p<br />
t ¼ LjDf jt; r ¼ r=l; ð13Þ<br />
M ¼ M Ll 2 ;<br />
n ¼<br />
a<br />
jDf jl 2 ;<br />
f f ðc; gÞ<br />
¼ ; E el<br />
jDf j<br />
¼ E el<br />
jDf j ;<br />
w iiðpÞ ¼ b iiðpÞ<br />
jDf jl ; 2<br />
ð14Þ<br />
where the quantities with asterisk ( ) represent the dimensionless<br />
equivalent <strong>of</strong> the correspond<strong>in</strong>g dimensional<br />
values. l represents the grid spac<strong>in</strong>g (Dx) or the characteristic<br />
length scale and Df represents the characteristic<br />
free energy (usually the maximum driv<strong>in</strong>g force for phase<br />
transformation from the constructed bulk free energy).<br />
The temporal equations are solved numerically us<strong>in</strong>g the<br />
semi-implicit Fourier-Spectral method [25].<br />
3. Results: first-pr<strong>in</strong>ciples calculations<br />
3.1. Bulk chemical free energy<br />
3.1.1. Solid solution phase<br />
The enthalpy and free energy (<strong>in</strong> meV/atom) as a<br />
function <strong>of</strong> composition and temperature, obta<strong>in</strong>ed<br />
from the comb<strong>in</strong>ed first-pr<strong>in</strong>ciples/MSCE/Monte Carlo<br />
approach, are shown <strong>in</strong> Figs. 4(a) and (b), respectively.<br />
We note that the temperature dependence <strong>of</strong> enthalpy <strong>in</strong><br />
Fig. 4(a) is due to a cluster<strong>in</strong>g-type short range order<br />
(SRO) <strong>in</strong> the Monte Carlo simulations <strong>of</strong> the <strong>Al</strong>–<strong>Cu</strong><br />
alloy. For a more detailed discussion <strong>of</strong> the predicted<br />
and experimentally measured SRO <strong>in</strong> <strong>Al</strong>–<strong>Cu</strong>, see [26].<br />
We also note that our calculated free energy for the solid<br />
solution phase <strong>in</strong>cludes configurational but not vibrational<br />
entropic contributions.<br />
3.1.2. h 0 precipitate phase<br />
The MSCE Hamiltonian obta<strong>in</strong>ed for the solid solution<br />
free energy calculations based on first-pr<strong>in</strong>ciples<br />
∆H ss (mev/atom)<br />
(a)<br />
∆F ss (mev/atom)<br />
(b)<br />
sc. ∆F ss (mev/atom)<br />
(c)<br />
0<br />
-2<br />
-4<br />
-6<br />
-8<br />
-10<br />
-12<br />
-14<br />
10<br />
0<br />
-10<br />
-20<br />
-30<br />
5<br />
4<br />
3<br />
2<br />
1<br />
0<br />
0 0.02 0.04 0.06 0.08 0.1<br />
573 K<br />
673 K<br />
723 K<br />
773 K<br />
873 K<br />
X <strong>Cu</strong><br />
-40<br />
0 0.02 0.04 0.06 0.08 0.1<br />
X <strong>Cu</strong><br />
-1<br />
0 0.005 0.01 0.015 0.02 0.025 0.03<br />
X <strong>Cu</strong><br />
573 K<br />
673 K<br />
723 K<br />
773 K<br />
873 K<br />
573 K<br />
673 K<br />
723 K<br />
773 K<br />
873 K<br />
Fig. 4. (a) Enthalpy, (b) free energy and (c) scaled free energy <strong>of</strong> the<br />
<strong>Al</strong>–<strong>Cu</strong> solid solution as a function <strong>of</strong> solute composition and temperature,<br />
calculated us<strong>in</strong>g the first-pr<strong>in</strong>ciples (FLAPW-LDA) MSCE<br />
comb<strong>in</strong>ed with thermodynamic <strong>in</strong>tegration. The scaled free energy is<br />
obta<strong>in</strong>ed by add<strong>in</strong>g a l<strong>in</strong>ear term <strong>in</strong> composition ½ 3X <strong>Cu</strong> DF h<br />
0 ðT ÞŠ,<br />
such that the rescaled h 0 free energy at X <strong>Cu</strong> ¼ 1=3 is zero. This l<strong>in</strong>ear<br />
scal<strong>in</strong>g <strong>of</strong> the free energy does not affect the determ<strong>in</strong>ation <strong>of</strong> equilibrium<br />
composition through the common tangent construction, but<br />
merely aids <strong>in</strong> visualization.
2978 V. Vaithyanathan et al. / Acta Materialia 52 (2004) 2973–2987<br />
energetics is applicable only for substitutional fcc-based<br />
configurations. It can be used for calculat<strong>in</strong>g the free<br />
energy <strong>of</strong> an fcc-based compound (e.g., a structure that<br />
can be represented by a substitutional decoration <strong>of</strong> A<br />
and B atoms on the sites <strong>of</strong> an fcc lattice, such as an<br />
ordered L1 2 or L1 0 ), but cannot be used for calculat<strong>in</strong>g<br />
the free energy <strong>of</strong> h 0 , which has a (distorted) CaF 2<br />
crystal structure. Hence, the h 0 energy is obta<strong>in</strong>ed from<br />
direct first-pr<strong>in</strong>ciples calculations at T ¼ 0 K, coupled<br />
with the vibrational entropy <strong>of</strong> h 0 , which has been found<br />
to be unexpectedly important for this phase [1]. Additionally,<br />
by perform<strong>in</strong>g po<strong>in</strong>t defect calculations <strong>of</strong> supercells<br />
<strong>of</strong> h 0 and <strong>in</strong>sert<strong>in</strong>g the energetics <strong>in</strong>to a lowtemperature<br />
expansion, we f<strong>in</strong>d that the configurational<br />
entropy <strong>of</strong> h 0 is small, and we do not consider h 0 <strong>of</strong>fstoichiometry.<br />
The h 0 formation enthalpy was calculated<br />
from first-pr<strong>in</strong>ciples as )195.8 meV/atom at <strong>Al</strong> 2 <strong>Cu</strong><br />
stoichiometry (X <strong>Cu</strong> ¼ 1=3). The computed (formation)<br />
vibrational entropy is )0.62k B [1]. Hence, the free energy<br />
<strong>of</strong> h 0 as a function <strong>of</strong> temperature is given by<br />
DF h<br />
0ðT Þ¼ 195:8 þ 0:62k B T ð<strong>in</strong> meV=atomÞ: ð15Þ<br />
We note that without the <strong>in</strong>clusion <strong>of</strong> the h 0 vibrational<br />
entropy term, the calculated equilibrium solubility <strong>of</strong> <strong>Cu</strong><br />
<strong>in</strong> solid solution is extremely small. For easier visualization,<br />
the free energy is scaled by a l<strong>in</strong>ear term <strong>in</strong><br />
composition ½ 3X <strong>Cu</strong> DF h<br />
0ðT ÞŠ, such that the rescaled h 0<br />
free energy at X <strong>Cu</strong> ¼ 1=3 is zero (Fig. 4(c)). This l<strong>in</strong>ear<br />
scal<strong>in</strong>g <strong>of</strong> the free energy does not affect the determ<strong>in</strong>ation<br />
<strong>of</strong> equilibrium composition through the common<br />
tangent construction.<br />
3.2. Interfacial energy<br />
In a system where the precipitate and matrix phases<br />
are substitutional rearrangements <strong>of</strong> atoms on the same<br />
lattice type, and form perfectly coherent <strong>in</strong>terfaces (e.g.,<br />
GP zone phases), one could calculate the <strong>in</strong>terfacial free<br />
energy from a Monte Carlo simulation coupled with<br />
thermodynamic <strong>in</strong>tegration, analogous to the procedure<br />
described for bulk free energies. <strong>Al</strong>ternatively, T ¼ 0K<br />
values may be obta<strong>in</strong>ed from direct first-pr<strong>in</strong>ciples supercell<br />
calculations (without us<strong>in</strong>g a CE). h 0 precipitates<br />
are partially coherent with different crystal structures for<br />
precipitate and matrix. Hence, it is not amenable to the<br />
CE method. Therefore, we extract the T ¼ 0 K <strong>in</strong>terfacial<br />
energies directly from first-pr<strong>in</strong>ciples supercell calculations.<br />
We next describe how the <strong>in</strong>terfacial energies<br />
are extracted from supercell energetics, and separated<br />
from the coherency stra<strong>in</strong> energetics.<br />
We beg<strong>in</strong> by consider<strong>in</strong>g an N-atom coherent supercell<br />
conta<strong>in</strong><strong>in</strong>g an <strong>in</strong>terface between two materials, A<br />
and B (<strong>in</strong> the case <strong>of</strong> this work, A ¼ <strong>Al</strong> and B ¼ <strong>Al</strong> 2 <strong>Cu</strong><br />
h 0 ). For simplicity, we consider the case <strong>of</strong> cells compris<strong>in</strong>g<br />
equal amount <strong>of</strong> A and B. The energy <strong>of</strong> a such<br />
an A N=2 B N=2 supercell can be separated <strong>in</strong>to two components<br />
[27]: (a) coherency stra<strong>in</strong> (cs): the stra<strong>in</strong> energy<br />
required to ma<strong>in</strong>ta<strong>in</strong> coherency between the (lattice<br />
mismatched) materials A and B, and (b) <strong>in</strong>terfacial energy:<br />
the energy associated with the <strong>in</strong>teractions between<br />
materials at the A=B <strong>in</strong>terface(s). To def<strong>in</strong>e these terms,<br />
it is useful to first consider the <strong>in</strong>f<strong>in</strong>ite period supercell<br />
limit N !1, for a supercell with <strong>in</strong>terface along an<br />
orientation ^G with lattice constants a k and a ? parallel<br />
and perpendicular to ^G, respectively. In this <strong>in</strong>f<strong>in</strong>iteperiod<br />
case, A=B <strong>in</strong>terfacial <strong>in</strong>teractions (which scale as<br />
the area <strong>of</strong> the <strong>in</strong>terface) contribute a negligible amount<br />
to the supercell formation energy dE sup (which scales as<br />
the volume <strong>of</strong> the superlattice):<br />
dE sup ðN !1; ^GÞ<br />
<br />
1<br />
dE CS ð^GÞ ¼m<strong>in</strong><br />
a ?<br />
2 dEepi A<br />
ða ?; a A k ; ^GÞ<br />
þ 1 <br />
2 dEepi B ða ?; a B k ; ^GÞ ;<br />
ð16Þ<br />
where dE sup is the energy <strong>of</strong> the supercell relative to<br />
equilvalent amounts <strong>of</strong> A and B <strong>in</strong> their equilibrium bulk<br />
geometries. In Eq. (16), the materials A and B are deformed<br />
<strong>in</strong> an ‘‘epitaxial’’ geometry: Both materials are<br />
brought to a common lattice constant a ? perpendicular<br />
to ^G, and the energy <strong>of</strong> each material is <strong>in</strong>dividually<br />
m<strong>in</strong>imized with respect to the lattice constant a k parallel<br />
to ^G. The epitaxial energies dE epi are the energies <strong>of</strong> A<br />
and B <strong>in</strong> these epitaxial geometries relative to their<br />
equilibrium bulk energy. For f<strong>in</strong>ite-period supercells, the<br />
energy is determ<strong>in</strong>ed not only by the coherency sta<strong>in</strong><br />
energy, but also by the <strong>in</strong>terfacial energy r times the<br />
number (2) and area (A) <strong>of</strong> these <strong>in</strong>terfaces. S<strong>in</strong>ce we are<br />
us<strong>in</strong>g energetics per atom, we must divide by the number<br />
<strong>of</strong> atoms <strong>in</strong> the cell, N. The <strong>in</strong>terfacial energy is then<br />
def<strong>in</strong>ed as<br />
dE sup ðN; ^GÞ dE sup ðN !1; bGÞ 2rð^GÞA : ð17Þ<br />
N<br />
Comb<strong>in</strong><strong>in</strong>g Eqs. (16) and (17), we see the decomposition<br />
<strong>of</strong> the supercell energy (for any period) <strong>in</strong>to stra<strong>in</strong> and<br />
<strong>in</strong>terfacial components<br />
dE SL ðN; ^GÞ ¼ 2rð^GÞA þ dE CS ð^GÞ:<br />
ð18Þ<br />
N<br />
From Eq. (18), we see that if the supercell formation<br />
energies (per atom) are plotted as a function <strong>of</strong> 1=N, the<br />
slope is just 2rA, and the y-<strong>in</strong>tercept is dE CS ð^GÞ. We<br />
have extracted the <strong>in</strong>terfacial energies from first-pr<strong>in</strong>ciples<br />
supercell calculations us<strong>in</strong>g the construction <strong>of</strong> Eq.<br />
(18). The results are shown <strong>in</strong> Fig. 6. We note that extract<strong>in</strong>g<br />
the coherency stra<strong>in</strong> energy from these calculations<br />
is not numerically stable; a more robust<br />
approach is the direct calculation <strong>of</strong> Eq. (16) described<br />
below.<br />
The tetragonal structure <strong>of</strong> h 0 precipitate embedded <strong>in</strong><br />
an fcc matrix results <strong>in</strong> partially coherent plate-shaped<br />
precipitates. The h 0 plates possess a broad coherent face
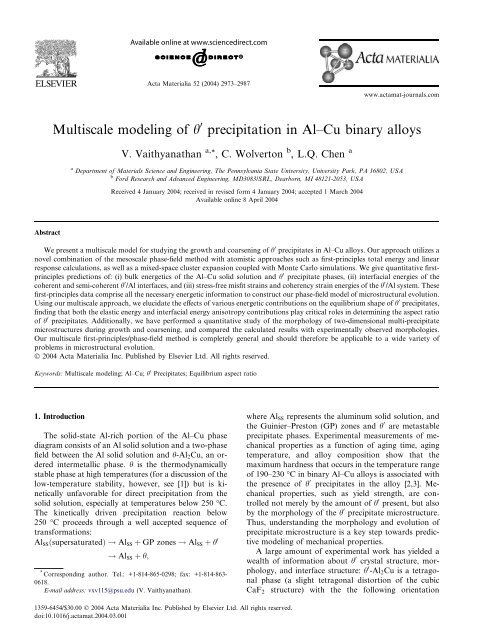
V. Vaithyanathan et al. / Acta Materialia 52 (2004) 2973–2987 2979<br />
<strong>Al</strong> 2 <strong>Cu</strong> (θ')/<strong>Al</strong> Supercell Energetics<br />
Fig. 5. Relaxed supercells from the first-pr<strong>in</strong>ciples <strong>in</strong>terfacial energy<br />
calculations <strong>of</strong> coherent (1 0 0) and semi-coherent (0 0 1) <strong>in</strong>terfaces <strong>of</strong><br />
h 0 -<strong>Al</strong> 2 <strong>Cu</strong> <strong>in</strong> fcc <strong>Al</strong> solid solution [10]. Dashed l<strong>in</strong>es <strong>in</strong>dicate the<br />
1a h<br />
0 ¼ 1a <strong>Al</strong> and 2c h<br />
0 ¼ 3a <strong>Al</strong> relationships <strong>of</strong> the coherent and semicoherent<br />
<strong>in</strong>terfaces, respectively.<br />
and a semi-coherent rim. We construct supercells consistent<br />
with the observed orientation relations between<br />
h 0 and the <strong>Al</strong> matrix: ð001Þ h<br />
0kf001g <strong>Al</strong> and ½010Š h<br />
0<br />
k½010Š <strong>Al</strong><br />
[4]. Representative cells show<strong>in</strong>g the <strong>in</strong>terfacial<br />
structures are given <strong>in</strong> Fig. 5. <strong>Al</strong>though the present<br />
phase-field model is 2D, we note that the first-pr<strong>in</strong>ciples<br />
calculations used to generate the various energetics <strong>of</strong><br />
the h 0 /<strong>Al</strong> system are fully three-dimensional. The coherent<br />
and semi-coherent <strong>in</strong>terfaces possess very different<br />
<strong>in</strong>terfacial structures. Due to lattice-misfit arguments<br />
(see below), the semi-coherent <strong>in</strong>terface structure is<br />
found to have a 2 h 0 to 3 <strong>Al</strong> SS unit cell arrangement. This<br />
configuration was proposed by Stobbs and Purdy [8]<br />
and confirmed by their TEM stra<strong>in</strong> field observations<br />
around the <strong>in</strong>terface.<br />
From Fig. 6, we see that the calculated T ¼ 0 K <strong>in</strong>terfacial<br />
energies from first-pr<strong>in</strong>ciples LDA calculations<br />
<strong>of</strong> the coherent and semi-coherent <strong>in</strong>terfaces are 190 and<br />
600 mJ/m 2 , respectively. GGA calculations, give slightly<br />
lower values <strong>of</strong> 170 and 520 mJ/m 2 , respectively. (The<br />
LDA numbers given here are slightly smaller than previous<br />
values published <strong>in</strong> [10] due to a more careful<br />
consideration <strong>of</strong> k-po<strong>in</strong>t convergence.) From our convergence<br />
studies, we estimate an uncerta<strong>in</strong>ty <strong>in</strong> these<br />
calculated <strong>in</strong>terfacial energies on the order <strong>of</strong> 5–10% due<br />
to supercell size. Interest<strong>in</strong>gly, for both LDA and GGA,<br />
the <strong>in</strong>terfacial anisotropy between semi-coherent and<br />
coherent <strong>in</strong>terfaces is consistently around 3. In addition<br />
to the isolated <strong>in</strong>terface energies, one can obta<strong>in</strong> some<br />
<strong>in</strong>dication <strong>of</strong> the <strong>in</strong>terface-<strong>in</strong>terface <strong>in</strong>teractions from<br />
the energies <strong>in</strong> Fig. 6 for relatively small supercells. For<br />
the coherent <strong>in</strong>terface, the small-cell energies fall above<br />
the l<strong>in</strong>e extracted from large cells, thus <strong>in</strong>dicat<strong>in</strong>g a repulsion<br />
between these <strong>in</strong>terfaces at short distances. For<br />
Formation Energy (meV/atom)<br />
140<br />
120<br />
100<br />
80<br />
60<br />
40<br />
20<br />
SEMICOHERENT (θ' rim)<br />
LDA: γ = 600 mJ/m 2<br />
GGA: γ = 520 mJ/m 2<br />
COHERENT (θ' broad face)<br />
LDA: γ = 190 mJ/m 2<br />
GGA: γ = 170 mJ/m 2<br />
0<br />
0.00 0.02 0.04 0.06 0.08 0.10 0.12<br />
1/N<br />
Fig. 6. First-pr<strong>in</strong>ciples (VASP) formation energies <strong>of</strong> <strong>Al</strong>/h 0 N-atom<br />
supercells as a function <strong>of</strong> 1=N for both <strong>in</strong>terfaces shown <strong>in</strong> Fig. 5.<br />
Energetics are shown for both LDA (filled symbols) and GGA (empty<br />
symbols) calculations. The energies <strong>of</strong> the large-cell calculations are fit<br />
to straight l<strong>in</strong>es, and the <strong>in</strong>terfacial energies (r) are extracted from the<br />
slopes, 2rA, <strong>of</strong> these l<strong>in</strong>es [see Eq. (18)].<br />
the semi-coherent <strong>in</strong>terface, the opposite is true, i.e.,<br />
these <strong>in</strong>terfaces tend to attract one another at short<br />
separations.<br />
We can contrast our first-pr<strong>in</strong>ciples calculated <strong>in</strong>terfacial<br />
anisotropy <strong>of</strong> 3 with a previous estimate by<br />
Aaronson and Laird [28] <strong>of</strong> 12. Our first-pr<strong>in</strong>ciples<br />
calculations <strong>in</strong>clude more physical contributions, and<br />
hence, are more predictive and certa<strong>in</strong>ly more accurate<br />
than the previous highly simplified estimate [28].<br />
Therefore, we assert that the currently most reliable<br />
value <strong>of</strong> the <strong>in</strong>terfacial anisotropy for the h 0 /<strong>Al</strong> system is<br />
3. This is noteworthy, s<strong>in</strong>ce the anisotropy estimate <strong>of</strong><br />
12 has been widely used <strong>in</strong> the literature as a prediction<br />
<strong>of</strong> the equilibrium aspect ratio <strong>of</strong> h 0 . These estimates <strong>of</strong><br />
the equilibrium aspect ratio are flawed not only because<br />
we have shown the more accurate <strong>in</strong>terfacial anisotropy<br />
is 3, but also there exists a strong stra<strong>in</strong> anisotropy<br />
contribution <strong>in</strong> this system (discussed <strong>in</strong> the next section),<br />
which can significantly alter the equilibrium aspect<br />
ratio <strong>of</strong> h 0 precipitates.<br />
We note that the <strong>in</strong>terfacial energy anisotropy obta<strong>in</strong>ed<br />
from first-pr<strong>in</strong>ciples is obta<strong>in</strong>ed at T ¼ 0 K and<br />
for a completely sharp <strong>in</strong>terface (Fig. 5). It would be <strong>of</strong><br />
considerable <strong>in</strong>terest to know how this anisotropy<br />
changes with temperature. At f<strong>in</strong>ite temperature, the<br />
<strong>in</strong>terfaces will naturally be diffuse to some extent and<br />
hence, configurational degrees <strong>of</strong> freedom will alter the<br />
<strong>in</strong>dividual <strong>in</strong>terfacial energy values. <strong>Al</strong>so the vibrational<br />
entropy at the <strong>in</strong>terface should be considered <strong>in</strong> a<br />
complete description <strong>of</strong> the temperature-dependence <strong>of</strong><br />
the <strong>in</strong>terfacial free energies. Future work along these<br />
l<strong>in</strong>es would be most <strong>in</strong>terest<strong>in</strong>g.
2980 V. Vaithyanathan et al. / Acta Materialia 52 (2004) 2973–2987<br />
3.3. Elastic properties<br />
In addition to bulk and <strong>in</strong>terfacial energies, there is a<br />
significant elastic energetic contribution to the h 0 /<strong>Al</strong><br />
system, due to the fact that the h 0 precipitates are coherently<br />
stra<strong>in</strong>ed by the <strong>Al</strong> matrix. The h 0 plates are<br />
generally acknowledged to be coherent with the matrix<br />
along their broad faces. In addition, Doherty [7] has<br />
shown that the <strong>in</strong>terfacial rim <strong>of</strong> plate-shaped precipitates<br />
are not necessarily <strong>in</strong>coherent, but could also be<br />
coherent or semi-coherent. Observations <strong>of</strong> the presence<br />
<strong>of</strong> facets on the rims <strong>of</strong> h 0 precipitates (when viewed<br />
perpendicular to the coherent face <strong>of</strong> the plate) from<br />
TEM micrographs [4,29] prove that this <strong>in</strong>terface is not<br />
completely <strong>in</strong>coherent. Thus, equilibrium morphology<br />
calculations, such as <strong>in</strong> the present work, should <strong>in</strong>clude<br />
the contributions from the elastic energy anisotropy <strong>in</strong><br />
addition to the <strong>in</strong>terfacial energy anisotropy.<br />
To <strong>in</strong>clude the elastic energy contribution <strong>in</strong> the phasefield<br />
model, we require the follow<strong>in</strong>g: the stress-free misfit<br />
stra<strong>in</strong>s along the coherent and semi-coherent <strong>in</strong>terfaces<br />
and the result<strong>in</strong>g elastic stra<strong>in</strong> energy contributions from<br />
the coherency constra<strong>in</strong>ts. These quantities are all readily<br />
calculated from our first-pr<strong>in</strong>ciples methods.<br />
3.3.1. Stress-free misfit stra<strong>in</strong>s<br />
The equilibrium or stress-free T ¼ 0 K lattice parameters<br />
<strong>of</strong> pure, bulk fcc <strong>Al</strong> and h 0 -<strong>Al</strong> 2 <strong>Cu</strong> (CaF 2<br />
structure) calculated us<strong>in</strong>g first-pr<strong>in</strong>ciples (FLAPW-<br />
LDA) are<br />
a <strong>Al</strong> ¼ 0:3989 nm; a h<br />
0 ¼ 0:4016 nm;<br />
p<br />
c h<br />
0 ¼ ffiffi<br />
2 ah 0 ¼ 0:5679 nm:<br />
We note that very large k-po<strong>in</strong>t sets have been used to<br />
ensure the convergence <strong>of</strong> these structural parameters to<br />
several significant digits. From these lattice parameters,<br />
the calculated misfit d c along the coherent, broad face <strong>of</strong><br />
h 0 plates is<br />
d c ¼ a h 0 a <strong>Al</strong><br />
¼þ0:7%: ð19Þ<br />
a <strong>Al</strong><br />
<strong>Al</strong>though the h 0 plates are completely coherent across<br />
the broad face for lower ag<strong>in</strong>g temperatures, they may<br />
conta<strong>in</strong> widely spaced misfit dislocations at higher ag<strong>in</strong>g<br />
temperatures [30]. By measur<strong>in</strong>g the dislocation spac<strong>in</strong>g<br />
across h 0 broad faces, Weatherly and Nicholson [30]<br />
have <strong>in</strong>ferred a misfit value <strong>of</strong> jd c j¼0:57%, which<br />
agrees well with our first-pr<strong>in</strong>ciples calculated misfit. We<br />
also note that Weatherly and Nicholson could not ascerta<strong>in</strong><br />
the sign <strong>of</strong> the misfit from their observations, as<br />
they could not unambiguously determ<strong>in</strong>e the nature <strong>of</strong><br />
the Burgers vectors <strong>of</strong> the dislocations; our calculations<br />
clearly show that the h 0 plates are under a compressive<br />
stra<strong>in</strong> along the broad faces.<br />
Around the precipitate rim, the simple configuration<br />
<strong>of</strong> c h<br />
0 : a <strong>Al</strong> has an extremely large misfit stra<strong>in</strong> <strong>of</strong> 42%.<br />
Therefore, we have considered the misfit for a few <strong>in</strong>teger<br />
comb<strong>in</strong>ations <strong>of</strong> c h<br />
0 and a <strong>Al</strong> unit cells. For a<br />
configuration <strong>of</strong> m h 0 to n <strong>Al</strong> unit cells, respectively,<br />
where m and n are positive <strong>in</strong>tegers, the misfit along the<br />
semi-coherent <strong>in</strong>terface (d sc ) def<strong>in</strong>ed as<br />
d sc ¼ mðc h 0Þ nða <strong>Al</strong>Þ<br />
nða <strong>Al</strong> Þ<br />
ð20Þ<br />
is as follows for m 6 4: (i) 1c h<br />
0 : 1a <strong>Al</strong> – +42.4%, (ii)<br />
1c h<br />
0 : 2a <strong>Al</strong> – )28.8%, (iii) 2c h<br />
0 : 3a <strong>Al</strong> – )5.1%, (iv)<br />
3c h<br />
0 : 4a <strong>Al</strong> – +6.8%, (v) 3c h<br />
0 : 5a <strong>Al</strong> – )14.6%, and (vi)<br />
4c h<br />
0 : 5a <strong>Al</strong> – +13.9%.<br />
We verify that the 2c h<br />
0 : 3a <strong>Al</strong> configuration for the<br />
semi-coherent <strong>in</strong>terface, observed by Stobbs and Purdy<br />
[8], is the most favorable low-<strong>in</strong>teger comb<strong>in</strong>ation <strong>in</strong><br />
terms <strong>of</strong> lattice misfit with d sc ¼ 5:1%. Lattice parameter<br />
measurements <strong>of</strong> h 0 give a value <strong>of</strong> d sc ¼ 4:3% for<br />
this misfit [8,31]. Aga<strong>in</strong>, our calculations are <strong>in</strong> reasonable<br />
agreement with observations. We note that for<br />
larger-unit cell comb<strong>in</strong>ations (i.e., thicker h 0 plates), one<br />
can obta<strong>in</strong> even smaller misfit stra<strong>in</strong>s: For example, the<br />
5c h<br />
0 : 7a <strong>Al</strong> and 7c h<br />
0 : 10a <strong>Al</strong> comb<strong>in</strong>ations have d sc ¼þ<br />
1:7% and 0:3%, respectively. However, we conf<strong>in</strong>e our<br />
attention <strong>in</strong> this work to the 2c h<br />
0 : 3a <strong>Al</strong> configuration. For<br />
a more complete discussion <strong>of</strong> the <strong>in</strong>terfacial structure,<br />
and mechanisms for h 0 precipiate growth, we refer the<br />
reader to [4,8,31] and references there<strong>in</strong>.<br />
3.3.2. Coherency stra<strong>in</strong> energies:<br />
For the phase-field model, we also need to know the<br />
stra<strong>in</strong> energy penalty associated with the misfit stra<strong>in</strong>s<br />
calculated above. We have calculated the coherency<br />
stra<strong>in</strong> energy for a h 0 /<strong>Al</strong> system <strong>in</strong> an analogous manner<br />
to that used to construct the <strong>Al</strong>/<strong>Cu</strong> coherency stra<strong>in</strong><br />
enter<strong>in</strong>g the mixed-space cluster expansion [17,19]. This<br />
calculation <strong>in</strong>volves a direct computation <strong>of</strong> Eq. (16)<br />
whereby <strong>Al</strong> and h 0 -<strong>Al</strong> 2 <strong>Cu</strong> are each deformed <strong>in</strong> an<br />
‘‘epitaxial’’ geometry, stra<strong>in</strong>ed to a common lattice<br />
constant <strong>in</strong> a plane perpendicular to an orientation, ^G.<br />
Summ<strong>in</strong>g together these ‘‘epitaxial’’ energies and subsequently<br />
m<strong>in</strong>imiz<strong>in</strong>g with respect to the common lattice<br />
constant gives the coherency stra<strong>in</strong> energy <strong>of</strong> Eq. (16).<br />
Fig. 7 shows the calculated coherency stra<strong>in</strong> for the h 0 /<strong>Al</strong><br />
system for hydrostatic stra<strong>in</strong>, as well as epitaxial stra<strong>in</strong><br />
along [1 0 0] and [1 1 1] orientations.<br />
We note that due to the homogeneous modulus approximation<br />
used <strong>in</strong> the phase-field model, it is necessary<br />
that we extract a s<strong>in</strong>gle, averaged set <strong>of</strong> harmonic<br />
elastic constants from these calculations. We note that<br />
first-pr<strong>in</strong>ciples total energy calculations are not constra<strong>in</strong>ed<br />
by the homogeneous modulus approximation,<br />
nor by harmonic elasticity theory, and <strong>in</strong>clude both<br />
harmonic and anharmonic elastic effects. However, we<br />
analyze our results with<strong>in</strong> the context <strong>of</strong> harmonic<br />
elasticity, and use this theory to extract the average<br />
elastic modulii <strong>of</strong> the h 0 /<strong>Al</strong> system from the results <strong>of</strong>
V. Vaithyanathan et al. / Acta Materialia 52 (2004) 2973–2987 2981<br />
∆E CS (meV/atom)<br />
25<br />
20<br />
15<br />
10<br />
5<br />
Coherency Stra<strong>in</strong> Energies: <strong>Al</strong>/<strong>Al</strong>2<strong>Cu</strong>(θ')<br />
0<br />
0.0 0.2 0.4 0.6 0.8 1.0<br />
<strong>Al</strong><br />
Hydrostatically stra<strong>in</strong>ed<br />
Biaxially stra<strong>in</strong>ed - 111<br />
Biaxially stra<strong>in</strong>ed - 100<br />
Fraction <strong>of</strong> θ'<br />
<strong>Al</strong> 2 <strong>Cu</strong> (θ')<br />
D ¼þ0:35 Mbar > 0 <strong>in</strong>dicates that h 0 precipitate has an<br />
elastically s<strong>of</strong>t direction along h100i, as can also be seen<br />
from the results <strong>of</strong> Fig. 7.<br />
4. Construct<strong>in</strong>g the phase-field model<br />
We have described how all the energetic <strong>in</strong>puts required<br />
for the phase-field microstructure model<strong>in</strong>g <strong>of</strong><br />
<strong>Al</strong>-h 0 system have been obta<strong>in</strong>ed from first-pr<strong>in</strong>ciples<br />
atomistic calculations. Next, we describe how the phasefield<br />
model is assembled from these energetics.<br />
4.1. Coarse-gra<strong>in</strong>ed free energy<br />
Fig. 7. First-pr<strong>in</strong>ciples (FLAPW-LDA) coherency stra<strong>in</strong> energies <strong>of</strong><br />
the <strong>Al</strong>/h 0 system. Shown are stra<strong>in</strong> energies for hydrostatic deformation,<br />
as well as epitaxial deformation along [1 0 0] and [1 1 1] orientations.<br />
The stra<strong>in</strong> energies shown are for the coherency constra<strong>in</strong>t <strong>of</strong> the<br />
semi-coherent <strong>in</strong>terfaces (around the rims <strong>of</strong> the plates), 2c h<br />
0 : 3a <strong>Al</strong> .<br />
The stra<strong>in</strong> energies for the broad face coherency constra<strong>in</strong>t, a h<br />
0 : a <strong>Al</strong><br />
(not shown), are qualitatively similar, but substantially reduced <strong>in</strong><br />
magnitude due to the smaller misfit <strong>in</strong> this orientation.<br />
Fig. 7. The epitaxial s<strong>of</strong>ten<strong>in</strong>g function [19] is given by<br />
the ratio <strong>of</strong> the epitaxial stra<strong>in</strong> energy along an orientation<br />
^G and the stra<strong>in</strong> energy for hydrostatic deformation,<br />
each deformed to a lattice parameter a S :<br />
qð^G; a S Þ¼ dEepi ð^G; a S Þ<br />
dE hydro ða S Þ :<br />
ð21Þ<br />
In harmonic elasticity theory, this s<strong>of</strong>ten<strong>in</strong>g function<br />
is given by<br />
B<br />
q harm ð^GÞ ¼1<br />
;<br />
ð22Þ<br />
C 11 þ Dc harm<br />
where B is the bulk modulus, C ij are the elastic constants,<br />
D ¼ C 44 ðC 2 11 C 12 Þ is the elastic anisotropy<br />
1<br />
parameter, and c harm is a geometric function <strong>of</strong> the<br />
spherical angles formed by ^G [19]. Specifically, for the<br />
pr<strong>in</strong>ciple high-symmetry directions,<br />
c harm ð½001ŠÞ ¼ 0; c harm ð½110ŠÞ ¼ 1; c harm ð½001ŠÞ ¼ 4=3:<br />
ð23Þ<br />
From Fig. 7, we extract the values <strong>of</strong> qð½111ŠÞ and<br />
qð½001ŠÞ for a 5% phase fraction <strong>of</strong> h 0 . Us<strong>in</strong>g these values<br />
and Eq. (22), we extract average modulii <strong>of</strong><br />
C 12 =C 11 ¼ 0:442 and C 44 =C 11 ¼ 0:428. We note that<br />
these averaged modulii therefore conta<strong>in</strong> <strong>in</strong>formation<br />
about the energetic penalty required to stra<strong>in</strong> both the h 0<br />
precipitates and the <strong>Al</strong> matrix.<br />
From the epitaxial deformation calculations described<br />
above, we have also extracted elastic constants<br />
<strong>of</strong> the cubic (CaF 2 ) h 0 phase, as these constants are not<br />
available experimentally: C 11 ¼ 1:9 Mbar, C 12 ¼ 0:8<br />
Mbar and C 44 ¼ 0:9 Mbar. The elastic anisotropy<br />
The solid solution free energy from first-pr<strong>in</strong>ciples<br />
can be directly related to the first term <strong>in</strong> the coarsegra<strong>in</strong>ed<br />
free energy <strong>in</strong> the phase field model (Eq. (6)), i.e.<br />
f ðc; g 1 ¼ 0; g 2 ¼ 0; g 3 ¼ 0Þ ¼A 1 ðc C 1 Þ 2 : ð24Þ<br />
The free energy <strong>of</strong> <strong>of</strong> the h 0 phase <strong>in</strong> the phase-field<br />
model is given by f ðc; g eq ðcÞÞ, where the equilibrium<br />
order parameter as a function <strong>of</strong> composition [g eq ðcÞ] is<br />
obta<strong>in</strong>ed by m<strong>in</strong>imiz<strong>in</strong>g the bulk free energy<br />
sffiffiffiffiffiffiffiffiffiffiffiffiffiffiffiffiffiffiffiffiffiffiffiffiffiffiffiffiffiffiffiffiffiffiffiffiffiffiffiffiffiffiffiffiffiffiffiffiffiffiffiffiffiffiffiffiffiffiffiffiffiffiffi<br />
p<br />
A 41 <br />
A 2 41<br />
4A 61 A 2 ðc C 2 Þ<br />
g eq ðcÞ ¼<br />
: ð25Þ<br />
2A 61<br />
The coefficients A 2 , A 41 and A 61 are obta<strong>in</strong>ed us<strong>in</strong>g the<br />
first-pr<strong>in</strong>ciples calculated equilibrium free energy and<br />
equilibrium composition <strong>of</strong> h 0 . The result<strong>in</strong>g coefficients<br />
(<strong>in</strong> meV/atom) <strong>of</strong> the coarse-gra<strong>in</strong>ed free energy at 723<br />
K <strong>in</strong> Eq. (6) from the fit are as follows:<br />
A 1 ¼ 1622:6; A 2 ¼ 1075:1; A 41 ¼ 536:6;<br />
A 61 ¼ 536:6; C 1 ¼ 0:002; C 2 ¼ 0:3333:<br />
The coarse-gra<strong>in</strong>ed free energy curves <strong>in</strong> Fig. 8 represent<br />
the two-phase equilibrium <strong>of</strong> <strong>Al</strong> solid solution and h 0 ,<br />
described <strong>in</strong> the multiscale model based on coefficients<br />
obta<strong>in</strong>ed from first-pr<strong>in</strong>ciples. The maximum driv<strong>in</strong>g<br />
force for the transformation (at 723 K) from Fig. 8 is<br />
34 meV/atom, while the equilibrium compositions<br />
based on common tangent construction to the free energy<br />
curves are c a ¼ 0:0013 (a represents the <strong>Al</strong> solid<br />
solution) and c h<br />
0 ¼ 0:3322. The h 0 free energy <strong>in</strong> Fig. 8 is<br />
admittedly an approximation to the first-pr<strong>in</strong>ciples calculated<br />
l<strong>in</strong>e compound free energy, <strong>in</strong>troduced to avoid<br />
numerical <strong>in</strong>stabilities. However, the approximated free<br />
energy reflects the proper equilibrium compositions <strong>of</strong><br />
the two phases.<br />
4.2. Gradient energy coefficients / <strong>in</strong>terfacial energies<br />
In the phase-field description, the <strong>in</strong>terfacial energy<br />
ÔrÕ for a system described by both the composition and<br />
an order parameter is given by [32]
2982 V. Vaithyanathan et al. / Acta Materialia 52 (2004) 2973–2987<br />
the semi-coherent and coherent <strong>in</strong>terfaces for the two<br />
precipitate variants<br />
<br />
0 ij ð1Þ ¼ <br />
11ð1Þ 0<br />
¼ d <br />
sc 0<br />
;<br />
0 22 ð1Þ 0 d c<br />
<br />
0 ij ð2Þ ¼ <br />
11ð2Þ 0<br />
¼ d <br />
ð27Þ<br />
c 0<br />
;<br />
0 22 ð2Þ 0 d sc<br />
Fig. 8. Coarse-gra<strong>in</strong>ed free energies <strong>of</strong> the matrix (a) and precipitates<br />
(h 0 ) based on a polynomial fit to the energetics obta<strong>in</strong>ed by firstpr<strong>in</strong>ciples<br />
calculations at 723 K. <strong>Al</strong>though h 0 was determ<strong>in</strong>ed to be a<br />
l<strong>in</strong>e compound from first-pr<strong>in</strong>ciples calculations, it is approximated by<br />
a polynomial with a smooth compositional dependence to avoid numerical<br />
<strong>in</strong>stabilities.<br />
Z "<br />
cb<br />
r ¼ 2 ½a Df ðcÞŠ 1 2<br />
1 þ X #1<br />
<br />
b ij ðpÞ dg 2 2<br />
p<br />
dc; ð26Þ<br />
c a<br />
a dc<br />
p<br />
where Df ðcÞ ¼f ðcÞ f eq ðcÞ represents the excess free<br />
energy associated with the material <strong>in</strong> the <strong>in</strong>terface, and<br />
a and b ij ðpÞ represent the gradient energy coefficients <strong>of</strong><br />
composition and order parameters (p-variants), respectively.<br />
Us<strong>in</strong>g the free energy described <strong>in</strong> Fig. 8 at 723 K<br />
and the first-pr<strong>in</strong>ciples calculated <strong>in</strong>terfacial energy <strong>of</strong><br />
Fig. 6, along with Eq. (26), we have obta<strong>in</strong>ed the gradient<br />
coefficients<br />
a ¼ 6:13 10 10 ; b 11 ð1Þ ¼3:75 10 10 ;<br />
b 22 ð1Þ ¼1:77 10 9 ð<strong>in</strong> J=mÞ:<br />
The coefficient a, which is the composition contribution<br />
to <strong>in</strong>terfacial energy is fixed arbitrarily, <strong>in</strong> order to<br />
evaluate the coefficients b ij . The calculated gradient energy<br />
values correspond to the first-pr<strong>in</strong>ciples calculated<br />
<strong>in</strong>terfacial energy values <strong>of</strong> 200 and 600 mJ/m 2 for<br />
coherent and semi-coherent <strong>in</strong>terfaces, respectively. The<br />
tetragonal symmetry <strong>of</strong> the variants are reflected <strong>in</strong> the<br />
b ij ð1Þ values and the gradient coefficients for the second<br />
h 0 variant [b ij ð2Þ] are obta<strong>in</strong>ed from Eq. (5).<br />
4.3. Elastic contributions<br />
The elastic energy expression <strong>in</strong> Eq. (8) requires the<br />
stiffness tensor (k ijkl ) and stress-free stra<strong>in</strong> tensor ( 0 ij )as<br />
<strong>in</strong>puts, and we have demonstrated above how to obta<strong>in</strong><br />
these quantities from first-pr<strong>in</strong>ciples. For cubic symmetry,<br />
C 11 , C 12 and C 44 are the only <strong>in</strong>dependent coefficients<br />
<strong>in</strong> the matrix equivalent (C ij ) <strong>of</strong> the stiffness<br />
tensor (k ijkl ). The stra<strong>in</strong> tensor reflects the tetragonal<br />
symmetry <strong>in</strong> stra<strong>in</strong> via the difference <strong>in</strong> misfit stra<strong>in</strong> <strong>of</strong><br />
where d c and d sc are the misfit stra<strong>in</strong>s along the coherent<br />
and semi-coherent <strong>in</strong>terfaces, respectively. The orientational<br />
variants (p ¼ 1; 2) <strong>in</strong> the stra<strong>in</strong> tensor are arranged<br />
to be consistent with the gradient energy<br />
coefficient tensor (Eq. (5)) represent<strong>in</strong>g the <strong>in</strong>terfacial<br />
energy anisotropy.<br />
Based on the bulk free energy (coarse-gra<strong>in</strong>ed Landau<br />
polynomial) constructed from first-pr<strong>in</strong>ciples data,<br />
and the first-pr<strong>in</strong>ciples calculated <strong>in</strong>terfacial energy, we<br />
estimate the <strong>in</strong>terfacial width <strong>of</strong> the coherent <strong>in</strong>terface<br />
[r cal =jDf j] to be 1.2 nm. The grid spac<strong>in</strong>g (Dx) is<br />
chosen to be 0.5 nm. We discuss below the implications<br />
<strong>of</strong> this choice <strong>of</strong> grid spac<strong>in</strong>g. While the simulation can<br />
be easily extended to 3D, the present study is restricted<br />
to 2D because <strong>of</strong> the computational limitations <strong>in</strong>volved<br />
<strong>in</strong> model<strong>in</strong>g a realistic system size <strong>in</strong> 3D. In 2D, the<br />
plate-shaped h 0 precipitates will be modeled as if viewed<br />
edge-on and the number <strong>of</strong> orientational variants will be<br />
2, <strong>in</strong>stead <strong>of</strong> 3 (as <strong>in</strong> the schematic shown <strong>in</strong> Fig. 3). The<br />
2D simulation grids were 500 500–750 750 nm 2<br />
depend<strong>in</strong>g on the volume fraction, the size restricted<br />
ma<strong>in</strong>ly by the availability <strong>of</strong> computational resources.<br />
The phase-field model was constructed from firstpr<strong>in</strong>ciples<br />
data at 450 °C. However, the exclusion <strong>of</strong><br />
the vibrational entropy contribution <strong>in</strong> free energy calculations<br />
has been shown to cause an overestimation <strong>of</strong><br />
the solvus temperature <strong>in</strong> <strong>Al</strong>–Sc alloys [33], and we expect<br />
a similar temperature overestimation for <strong>Al</strong>–<strong>Cu</strong><br />
alloys here <strong>of</strong> 200–250 °C. Therefore, <strong>in</strong> all the calculated<br />
results below, we apply this ad hoc temperature<br />
correction, and compare our calculated results to experimental<br />
data at precipitation temperatures <strong>of</strong> <strong>in</strong>terest<br />
<strong>of</strong> 200–250 °C.<br />
In a phase-field model, homogeneous nucleation can<br />
be modeled by either add<strong>in</strong>g random thermal noises <strong>in</strong><br />
the Cahn–Hilliard and <strong>Al</strong>len–Cahn equations [24,34] or<br />
by explicitly <strong>in</strong>troduc<strong>in</strong>g nuclei accord<strong>in</strong>g to the classical<br />
nucleation theory applied locally <strong>in</strong> a system<br />
[35,36]. S<strong>in</strong>ce the ma<strong>in</strong> focus <strong>of</strong> this paper is on the<br />
growth and coarsen<strong>in</strong>g process <strong>of</strong> precipitates rather<br />
than the nucleation, the precipitates were simply <strong>in</strong>troduced<br />
at random locations. As smaller particles are<br />
more strongly controlled by <strong>in</strong>terfacial energies (relative<br />
to stra<strong>in</strong> energies) than large ones, the <strong>in</strong>itial<br />
conditions <strong>in</strong> all our simulations correspond to randomly<br />
distributed nuclei <strong>of</strong> h 0 with an aspect ratio<br />
3:1, based on first-pr<strong>in</strong>ciples calculated <strong>in</strong>terfacial<br />
energy anisotropy.
V. Vaithyanathan et al. / Acta Materialia 52 (2004) 2973–2987 2983<br />
5. Results: phase-field model<strong>in</strong>g<br />
5.1. Equilibrium morphology <strong>of</strong> h 0<br />
In an effort to understand the physics controll<strong>in</strong>g the<br />
equilibrium morphology <strong>of</strong> h 0 , we have calculated morphologies<br />
from our multiscale approach, <strong>in</strong>clud<strong>in</strong>g various<br />
physical factors which affect the precipitate<br />
morphology, both <strong>in</strong>dividually and <strong>in</strong> comb<strong>in</strong>ation.<br />
Fig. 9 is a collection <strong>of</strong> the late stage precipitate microstructures<br />
obta<strong>in</strong>ed from phase-field simulations with<br />
different comb<strong>in</strong>ations <strong>of</strong> energetic contributions: (i)<br />
isotropic <strong>in</strong>terfacial energy alone, (ii) anisotropic <strong>in</strong>terfacial<br />
energy alone, (iii) anisotropic stra<strong>in</strong> (or elastic<br />
energy) alone, and (iv) the ‘‘full’’ calculations us<strong>in</strong>g both<br />
anisotropic <strong>in</strong>terfacial and elastic energy <strong>in</strong> comb<strong>in</strong>ation.<br />
The simulation results for these four cases are<br />
compared with an experimental TEM micrograph <strong>of</strong> a<br />
319-type <strong>Al</strong>–Si–<strong>Cu</strong> alloy aged at 230 °C for 3 h [37].<br />
Though all the simulations started with similar <strong>in</strong>itial<br />
conditions, the number <strong>of</strong> precipitates <strong>in</strong> the microstructure<br />
<strong>in</strong> the late stages is dependent on the anisotropy<br />
contribution(s) <strong>in</strong>cluded. In general, the presence<br />
<strong>of</strong> stra<strong>in</strong> <strong>in</strong>creases the critical nuclei size and hence, reduces<br />
the number <strong>of</strong> precipitates which atta<strong>in</strong> the<br />
growth stage. <strong>Al</strong>so, some coalescence effects are observed<br />
(<strong>in</strong> the case <strong>of</strong> elastic energy anisotropy) from<br />
closely spaced identical precipitate variants which survived<br />
to the growth stage.<br />
(i) Isotropic <strong>in</strong>terfacial energy alone: As expected, the<br />
result<strong>in</strong>g precipitate shapes are spherical with <strong>in</strong>crease <strong>in</strong><br />
average precipitate size caused by growth and coarsen<strong>in</strong>g.<br />
(ii) Anisotropic <strong>in</strong>terfacial energy alone: The precipitates<br />
are plate-shaped with an aspect ratio close to<br />
the <strong>in</strong>terfacial energy anisotropy value <strong>of</strong> 3. We note<br />
that there exists a small effect from spatial discretization<br />
<strong>of</strong> our phase-field model on the morphology. The difference<br />
<strong>in</strong> <strong>in</strong>terfacial widths along the semi-coherent and<br />
coherent <strong>in</strong>terfaces, <strong>in</strong>troduced by the anisotropy <strong>in</strong> <strong>in</strong>terfacial<br />
energy, requires a very f<strong>in</strong>e grid spac<strong>in</strong>g to<br />
elim<strong>in</strong>ate this spatial discretization artifact completely.<br />
The f<strong>in</strong>er grid spac<strong>in</strong>g implies more computational effort<br />
<strong>in</strong> evaluat<strong>in</strong>g the model. Hence, we strike a balance<br />
between the discretization artifact and the computational<br />
effort, and choose a grid spac<strong>in</strong>g such that the<br />
precipitate aspect ratio is close to the expected value<br />
from <strong>in</strong>terfacial energy anisotropy. Use <strong>of</strong> an adaptive<br />
grid spac<strong>in</strong>g could also be beneficial <strong>in</strong> elim<strong>in</strong>at<strong>in</strong>g this<br />
discretization artifact, and future work <strong>in</strong> that area<br />
would be <strong>of</strong> <strong>in</strong>terest. (iii) Anisotropic elastic energy<br />
alone: The elastic energy anisotropy arises from the tetragonality<br />
<strong>in</strong> stra<strong>in</strong> and should result <strong>in</strong> lens-shaped<br />
precipitates [22]. The deviation from the expected lensshape<br />
<strong>of</strong> precipitates (<strong>in</strong> Fig. 9(c)) is caused by the<br />
coalescence events from neighbor<strong>in</strong>g precipitates. (iv)<br />
Anisotropic <strong>in</strong>terfacial and elastic energy <strong>in</strong> comb<strong>in</strong>ation:<br />
Only <strong>in</strong> this case, (Fig. 9(d)), does the model result <strong>in</strong> h 0<br />
precipitates with aspect ratios that are <strong>in</strong> reasonable<br />
agreement with those observed experimentally after long<br />
ag<strong>in</strong>g times [38]. The experimental TEM micrograph <strong>in</strong><br />
Fig. 9(e) obta<strong>in</strong>ed from a 319-type <strong>Al</strong>–Si–<strong>Cu</strong> cast alloy<br />
after ag<strong>in</strong>g at 230 °C for 3 h is shown for comparison<br />
[37]. By determ<strong>in</strong><strong>in</strong>g the effect <strong>of</strong> different anisotropy<br />
contributions on the morphology <strong>of</strong> h 0 precipitates us<strong>in</strong>g<br />
the multiscale tool, and by compar<strong>in</strong>g with the exist<strong>in</strong>g<br />
experimental results on equilibrium aspect ratio, we<br />
Fig. 9. Phase-field simulation us<strong>in</strong>g thermodynamic parameters from first-pr<strong>in</strong>ciples, show<strong>in</strong>g h 0 morphologies obta<strong>in</strong>ed with different anisotropic<br />
contributions for an ag<strong>in</strong>g temperature <strong>of</strong> 200–250 °C. The experimental micrograph is from an <strong>Al</strong>–Si–<strong>Cu</strong> cast alloy aged at 230 °C for 3 h [37]. The<br />
label on the top <strong>of</strong> each frame <strong>in</strong>dicates the anisotropy(ies) <strong>in</strong>cluded (expressed as semi-coherent:coherent; <strong>in</strong>terface – 3:1, stra<strong>in</strong> – )0.051: +0.007).
2984 V. Vaithyanathan et al. / Acta Materialia 52 (2004) 2973–2987<br />
Fig. 10. Microstructure evolution as a function <strong>of</strong> dimensionless time (t ) for <strong>Al</strong>–2%<strong>Cu</strong> alloy. The simulation size is 750 750 nm 2 .<br />
arrive at the conclusion that the equilibrium precipitate<br />
morphology is governed not solely by the <strong>in</strong>terfacial<br />
energy anisotropy (as it has been widely believed), nor<br />
by the stra<strong>in</strong> energy anisotropy, but rather by a comb<strong>in</strong>ation<br />
<strong>of</strong> the anisotropies.<br />
5.2. Evolution <strong>of</strong> multi-precipitate systems<br />
We next turn to applications <strong>of</strong> our multiscale model<br />
to the 2D simulation <strong>of</strong> microstructural evolution <strong>in</strong><br />
systems with multiple precipitates. Both <strong>in</strong>terfacial and<br />
elastic energy anisotropies are <strong>in</strong>corporated <strong>in</strong> all results.<br />
The values <strong>of</strong> dimensionless quantities M and t <br />
used <strong>in</strong> the simulation, along with the knowledge <strong>of</strong><br />
diffusion coefficient at the ag<strong>in</strong>g temperature (D), characteristic<br />
length scale (l) and characteristic free energy<br />
(Df ) used <strong>in</strong> the simulation, provide a simple relation to<br />
calculate the real time (t) from the simulation time (t ).<br />
Based on the diffusion coefficient D at the ag<strong>in</strong>g temperature<br />
and the alloy composition (c), mobility M is<br />
evaluated us<strong>in</strong>g an averaged mobility expression<br />
[M ¼ Dcð1 cÞ]. With a knowledge <strong>of</strong> the estimated<br />
mobility M, M and l, the k<strong>in</strong>etic parameter L is determ<strong>in</strong>ed<br />
us<strong>in</strong>g Eq. (14). The real time is related to t , L and<br />
Df through a simple relationship (from Eq. (13))<br />
t ¼<br />
t<br />
LDf :<br />
ð28Þ<br />
As an example, the simulation time <strong>of</strong> t ¼ 900 for the<br />
result shown <strong>in</strong> Fig. 9(d), corresponds to a real time <strong>of</strong><br />
10 h, based on estimated diffusion coefficient <strong>of</strong> 10 18<br />
m 2 /s [39] at 200 °C.<br />
The results discussed <strong>in</strong> this section are for an alloy<br />
with 2% <strong>Cu</strong> (all compositions expressed <strong>in</strong> atomic %,<br />
unless explicitly stated). The precipitate growth and<br />
coarsen<strong>in</strong>g <strong>of</strong> this alloy as a function <strong>of</strong> time is shown <strong>in</strong><br />
Fig. 10. A simulation time <strong>of</strong> 1800 for this alloy corresponds<br />
to 60 h <strong>of</strong> ag<strong>in</strong>g, at 200 °C. The size <strong>of</strong> the<br />
simulated microstructure <strong>in</strong> Fig. 10 is 750 750 nm 2 .<br />
The number <strong>of</strong> precipitates that survive the growth<br />
stage is only a small percent <strong>of</strong> the <strong>in</strong>itial number <strong>of</strong><br />
heterogeneous nuclei, because <strong>of</strong> the small supersaturation<br />
<strong>of</strong> the alloy. The thickness and length <strong>of</strong> the plateshaped<br />
precipitates dur<strong>in</strong>g the evolution vary depend<strong>in</strong>g<br />
on whether they are grow<strong>in</strong>g or shr<strong>in</strong>k<strong>in</strong>g, and on the<br />
<strong>in</strong>teraction with the diffusion fields from neighbor<strong>in</strong>g<br />
precipitates. When the diffusion fields <strong>of</strong> the two adjacent<br />
precipitates which belong to the same crystallographic<br />
variant (same g p , sign and magnitude) <strong>in</strong>teract,<br />
reduction <strong>in</strong> the <strong>in</strong>terfacial energy favors their coales-<br />
average length (nm)<br />
600<br />
500<br />
400<br />
300<br />
200<br />
100<br />
BN 200C(Q.A.)<br />
MF 200C(R)<br />
MF 225C(R)<br />
MF 250C(R)<br />
FP/PFM(max)<br />
FP/PFM(avg)<br />
0<br />
0 10 20 30 40 50 60 70<br />
time (hrs)<br />
Fig. 11. Average and maximum precipitate length from the multiscale<br />
model (FP/PFM – first-pr<strong>in</strong>ciples phase-field model) for an <strong>Al</strong>–2%<strong>Cu</strong><br />
alloy are compared with average length values from ag<strong>in</strong>g experiments<br />
<strong>of</strong> Boyd and Nicholson [6] (BN) and Merle and Fouquet [38] (MF).<br />
ÔQ.A.Õ represents quench<strong>in</strong>g and ag<strong>in</strong>g after solutioniz<strong>in</strong>g (conventional<br />
ag<strong>in</strong>g), while ÔRÕ represents reversion treatment.<br />
average thickness (nm)<br />
15<br />
10<br />
5<br />
0<br />
-5<br />
SL 200C(T.I.)<br />
SL 250C(T.I.)<br />
MF 200C(R)<br />
MF 225C(R)<br />
MF 250C(R)<br />
FP/PFM(max)<br />
FP/PFM(avg)<br />
0 10 20 30 40 50 60 70 80<br />
time (hrs)<br />
Fig. 12. Average and maximum precipitate thickness from <strong>Al</strong>–2%<strong>Cu</strong><br />
alloy compared with the experimental measurements <strong>of</strong> Sankaran and<br />
Laird [40] (SL) and Merle and Fouquet [38] (MF). ÔT.I.Õ represents<br />
isothermal treatment, which implies direct isothermal ag<strong>in</strong>g after solutioniz<strong>in</strong>g<br />
without quench<strong>in</strong>g to reduce the density <strong>of</strong> precipitates and<br />
hence, the diffusion field overlaps.
V. Vaithyanathan et al. / Acta Materialia 52 (2004) 2973–2987 2985<br />
average aspect ratio<br />
50<br />
40<br />
30<br />
20<br />
10<br />
0<br />
MF 225C(R)<br />
MF 250C(R)<br />
FP/PFM<br />
FP/PFM(avg)<br />
0 10 20 30 40 50 60 70<br />
time (hrs)<br />
Fig. 13. Average aspect ratio <strong>of</strong> h 0 precipitates from the <strong>Al</strong>–2%<strong>Cu</strong> alloy<br />
is compared with the experimental results <strong>of</strong> Merle and Fouquet [38].<br />
The <strong>in</strong>dividual aspect ratios from the simulation (FP/PFM) are displayed<br />
along with the average aspect ratio <strong>in</strong> solid l<strong>in</strong>e. The equilibrium<br />
aspect ratio from the simulation results is <strong>in</strong> good agreement with<br />
the late stage equilibrium value from the experiments.<br />
cence. <strong>Al</strong>so, the same <strong>in</strong>teraction resists coalescence<br />
between unlike variants (which would result <strong>in</strong> an antiphase<br />
doma<strong>in</strong> boundary or tw<strong>in</strong> boundary formation)<br />
and <strong>in</strong>hibits their growth, similar to the experimental<br />
observations [6,30].<br />
From our simulations <strong>of</strong> microstructural evolution<br />
(Fig. 10), we have extracted quantitative precipitate features<br />
like the thickness, length and aspect ratio as a<br />
function <strong>of</strong> time. The thicken<strong>in</strong>g and lengthen<strong>in</strong>g k<strong>in</strong>etics<br />
obta<strong>in</strong>ed from an <strong>Al</strong>–2%<strong>Cu</strong> alloy are shown <strong>in</strong> Figs. 11<br />
and 12. These multiscale model<strong>in</strong>g (FP/PFM – firstpr<strong>in</strong>ciples<br />
phase-field model) k<strong>in</strong>etics are compared with<br />
experimental results available from the literature for<br />
precipitation temperatures between 200 and 250 °C. The<br />
average (solid l<strong>in</strong>e) and maximum (dotted l<strong>in</strong>e) values <strong>of</strong><br />
length and thickness from the simulation are compared<br />
with average values from experiments. It should be<br />
po<strong>in</strong>ted out that the experimental measurements selectively<br />
measure a few hundred precipitates from the large<br />
number <strong>of</strong> available precipitates. <strong>Al</strong>so, experimental<br />
images (<strong>in</strong> TEM) can <strong>in</strong>clude precipitate overlap, which<br />
can result both <strong>in</strong> an overestimation <strong>of</strong> the average length<br />
and also <strong>in</strong> difficulties <strong>in</strong> resolv<strong>in</strong>g thicknesses at the<br />
nanometer-scale, lead<strong>in</strong>g to large uncerta<strong>in</strong>ties <strong>in</strong> these<br />
measurements. From Figs. 11 and 12, it is clear that the<br />
thickness values from our simulations are <strong>in</strong> closer<br />
agreement with experimental results than are the values<br />
<strong>of</strong> precipitate length. We assert that the source <strong>of</strong> the<br />
discrepancy <strong>in</strong> the case <strong>of</strong> precipitate length is due to the<br />
pronounced <strong>in</strong>terfacial mobility anisotropy and therefore,<br />
the much longer non-equilibrium lengths <strong>in</strong> experimental<br />
measurements as compared to the equilibrium<br />
values predicted by the simulation. The average aspect<br />
ratio <strong>of</strong> h 0 precipitates <strong>in</strong> the 2%<strong>Cu</strong> alloy predicted from<br />
our simulation (see Fig. 13) agrees well with the measurements<br />
<strong>of</strong> Merle and Fouquet [38], who obta<strong>in</strong>ed data<br />
after long ag<strong>in</strong>g times (a few hundred to a thousand<br />
hours). The maximum value <strong>of</strong> equilibrium aspect ratio<br />
from the model predictions does not exceed 30, whereas<br />
large non-equilibrium values are observed dur<strong>in</strong>g ag<strong>in</strong>g<br />
experiments, presumably <strong>in</strong>duced by the <strong>in</strong>terfacial mobility<br />
anisotropy.<br />
The multiscale model can also be used to study and<br />
compare the precipitation k<strong>in</strong>etics <strong>of</strong> alloys with different<br />
precipitate volume fractions. As an example, the<br />
precipitate morphology and aspect ratios are compared<br />
for three different alloy compositions, 2%, 3% and 4%<br />
<strong>Cu</strong>. The smallest composition studied (2%) is the closest<br />
to the <strong>Cu</strong> compositions <strong>in</strong> many b<strong>in</strong>ary and multicomponent<br />
<strong>Al</strong>–<strong>Cu</strong>-based alloys <strong>of</strong> practical <strong>in</strong>terest.<br />
<strong>Al</strong>though the higher volume fractions might be somewhat<br />
unrealistic, they are important, as they provide<br />
Fig. 14. Precipitate evolution as a function <strong>of</strong> dimensionless time for (a) <strong>Al</strong>–3%<strong>Cu</strong> and (b) <strong>Al</strong>–4%<strong>Cu</strong> alloy. t ¼ 900 corresponds to a real time <strong>of</strong> 10<br />
and 7.5 h for a 3% and 4% alloy, respectively, while for the 2% alloy <strong>in</strong> Fig. 10, it corresponds to 30 h.
2986 V. Vaithyanathan et al. / Acta Materialia 52 (2004) 2973–2987<br />
average aspect ratio<br />
20<br />
18<br />
16<br />
14<br />
12<br />
10<br />
8<br />
6<br />
4<br />
<strong>in</strong>formation necessary to compare the effect <strong>of</strong> volume<br />
fraction on growth/coarsen<strong>in</strong>g k<strong>in</strong>etics.<br />
From the precipitate microstructure evolution <strong>in</strong><br />
Figs. 10, 14(a) and (b) (correspond<strong>in</strong>g to 2%, 3% and 4%<br />
<strong>Cu</strong> compositions, respectively), it is obvious that the<br />
number <strong>of</strong> precipitates which reach the growth stage<br />
from the nuclei stage <strong>in</strong>creases with supersaturation and<br />
therefore, results <strong>in</strong> a larger precipitate density <strong>in</strong> the<br />
late stages <strong>of</strong> simulation. The real times for the evolution<br />
study correspond<strong>in</strong>g to t ¼ 900 are 10 and 7.5 h<br />
for the 3% and 4% <strong>Cu</strong> compositions (due to difference <strong>in</strong><br />
mobility M as a function <strong>of</strong> alloy composition), respectively,<br />
and the simulation size is 500 500 nm 2 .<br />
The average aspect ratio <strong>of</strong> h 0 precipitates decrease with<br />
<strong>in</strong>crease <strong>in</strong> alloy composition (2–4% <strong>Cu</strong>) (see Fig. 15).<br />
This type <strong>of</strong> behavior is also observed <strong>in</strong> experiments<br />
[38], <strong>in</strong> which the reduction <strong>in</strong> aspect ratio with <strong>in</strong>crease<br />
<strong>in</strong> alloy composition or supersaturation is caused by<br />
enhanced thicken<strong>in</strong>g.<br />
The multiscale model helps <strong>in</strong> understand<strong>in</strong>g the<br />
physics beh<strong>in</strong>d the equilibrium h 0 precipitate morphology.<br />
The quantitative predictions <strong>of</strong> equilibrium aspect<br />
ratio <strong>of</strong> h 0 precipitates are <strong>in</strong> good agreement with experiments.<br />
In order to obta<strong>in</strong> a complete understand<strong>in</strong>g<br />
<strong>of</strong> the non-equilibrium precipitate morphologies <strong>in</strong> experiments<br />
aris<strong>in</strong>g from <strong>in</strong>terfacial k<strong>in</strong>etic anisotropy, a<br />
more sophisticated phase-field model that <strong>in</strong>cludes misfit<br />
defects and accounts for the ledge growth nature <strong>of</strong> the<br />
coherent <strong>in</strong>terface <strong>of</strong> h 0 precipitates, is required.<br />
6. Summary<br />
2%<br />
3%<br />
4%<br />
0 10 20 30 40 50 60<br />
time (hrs)<br />
Fig. 15. Average aspect ratio evolution as a function <strong>of</strong> time compared<br />
for the <strong>Al</strong>–<strong>Cu</strong> alloys <strong>of</strong> three different compositions. The aspect ratio<br />
seems to decrease slightly with <strong>in</strong>crease <strong>in</strong> composition, similar to the<br />
experimental results <strong>of</strong> Merle and Fouquet [38].<br />
A multiscale approach is presented to study the precipitate<br />
morphology <strong>of</strong> h 0 precipitates <strong>in</strong> <strong>Al</strong>–<strong>Cu</strong> alloys.<br />
<strong>Al</strong>l <strong>of</strong> the energetic contributions required by the mesoscale<br />
phase-field (bulk, <strong>in</strong>terfacial, and stra<strong>in</strong>) are<br />
provided by atomic-scale first-pr<strong>in</strong>ciples calculations<br />
comb<strong>in</strong>ed with cluster expansion and MC techniques.<br />
First-pr<strong>in</strong>ciples calculations provide the first reliable<br />
<strong>in</strong>terfacial energy and misfit stra<strong>in</strong> values for the coherent<br />
and semi-coherent <strong>in</strong>terfaces <strong>of</strong> h 0 . From the<br />
multiscale simulation results, we demonstrate that the<br />
equilibrium plate-shaped morphology <strong>of</strong> h 0 is not solely<br />
governed by <strong>in</strong>terfacial energy anisotropy as believed<br />
prevalently, but by the comb<strong>in</strong>ation <strong>of</strong> <strong>in</strong>terfacial and<br />
elastic energy anisotropies. The time evolution <strong>of</strong> the<br />
equilibrium precipitate features such as the length,<br />
thickness, and aspect ratio predicted by the simulation<br />
agrees qualitatively with the experimental observations,<br />
despite the fact that the model does not account for the<br />
non-equilibrium <strong>in</strong>terfacial mobility anisotropy effects.<br />
We note that the first-pr<strong>in</strong>ciples/phase-field method<br />
proposed here is completely general and is not conf<strong>in</strong>ed<br />
to the h 0 /<strong>Al</strong> case. It should be applicable to a wide variety<br />
<strong>of</strong> problems <strong>in</strong> microstructural evolution.<br />
References<br />
[1] Wolverton C, Ozol<strong>in</strong>s V. Phys Rev Lett 2001;86:5518.<br />
[2] Hardy HK. J Inst Met 1951;79:321.<br />
[3] Hardy HK. J Inst Met 1953;82:236.<br />
[4] Laird C, Aaronson HI. Trans Metall Soc AIME 1968;242:1393.<br />
[5] Hornbogen E. <strong>Al</strong>um<strong>in</strong>ium 1967;43:115.<br />
[6] Boyd JD, Nicholson RB. Acta Metall 1971;19:1379.<br />
[7] Doherty RD. Diffusive transformations <strong>in</strong> the solid state. In: Cahn<br />
RW, Haasen P, editors. Physical metallurgy. Amsterdam: Elsevier;<br />
1996. p. 1363–505.<br />
[8] Stobbs WM, Purdy GR. Acta Metall 1978;26:1069.<br />
[9] Mitl<strong>in</strong> D, Radmilovic V, Morris Jr JW. Metall Mater Trans A<br />
2000;31:2697.<br />
[10] Vaithyanathan V, Wolverton C, Chen LQ. Phys Rev Lett<br />
2002;88:125503.<br />
[11] Chen LQ. Annu Rev Mater Res 2002;32:113.<br />
[12] Ceperly DM, <strong>Al</strong>der BJ. Phys Rev Lett 1980;45:566.<br />
[13] Perdew JP, Zunger A. Phys Rev B 1981;23:5048.<br />
[14] Perdew JP. In: Ziesche P, Eschrig H, editors. Electronic Structure<br />
<strong>of</strong> Solids, vol. 11. Berl<strong>in</strong>: Akademie Verlag; 1991.<br />
[15] S<strong>in</strong>gh DJ. Planewaves, pseudopotentials, and the LAPW method.<br />
Boston: Kluwer Academic Publishers; 1994.<br />
[16] Kresse G, Furthmuller J. Comput Mater Sci 1996;6:15.<br />
[17] Laks DB, Ferreira LG, Froyen S, Zunger A. Phys Rev B<br />
1992;46:12587.<br />
[18] Wolverton C. Philos Mag Lett 1999;79:683.<br />
[19] Ozol<strong>in</strong>s V, Wolverton C, Zunger A. Phys Rev B 1998;57:6427.<br />
[20] Braun RJ, Cahn JW, McFadden GB, Wheeler AA. Philos Trans<br />
R Soc Lond A 1997;355:1787.<br />
[21] Chen LQ. Phase transformation and evolution <strong>in</strong> materials. In:<br />
Proceed<strong>in</strong>g <strong>of</strong> TMS Symposium; 2000. p. 209–20.<br />
[22] Khachaturyan AG. Theory <strong>of</strong> structural transformations <strong>in</strong> solids.<br />
New York: Wiley; 1983.<br />
[23] Li DY, Chen LQ. Acta Mater 1998;46:2573.<br />
[24] Elder K. Comput Phys 1993;7:27.<br />
[25] Chen LQ, Shen J. Comput Phys Commun 1998;108:147.<br />
[26] Muller S, Wang L-W, Zunger A, Wolverton C. Phys Rev B<br />
1999;60:16448.<br />
[27] Ozol<strong>in</strong>s V, Wolverton C, Zunger A. Phys Rev B 1998;57:4816.<br />
[28] Aaronson HI, Laird C. Ford Motor Co. Scientific Laboratory<br />
Report; 1967.<br />
[29] Weatherly GC. Acta Metall 1971;19:181.
V. Vaithyanathan et al. / Acta Materialia 52 (2004) 2973–2987 2987<br />
[30] Weatherly GC, Nicholson RB. Philos Mag 1968;17:801.<br />
[31] Dahmen U, Westmacott KH. Phys Stat Sol (a) 1983;80:249.<br />
[32] Cahn JW, Hilliard JE. J Chem Phys 1958;28:258.<br />
[33] Ozol<strong>in</strong>s V, Asta M. Phys Rev Lett 2001;86:448.<br />
[34] Gunton JD, Miguel MS, Sahni PS. The dynamics <strong>of</strong> first-order<br />
phase transitions. In: Domb C, Lebowitz JL, editors. Phase<br />
transitions and critical phenomena. New York: Academic Press;<br />
1983. p. 267–466.<br />
[35] Simmons JP, Shen C, Wang Y. Scr Mater 2000;43:935.<br />
[36] Granasy L, B€orzs€onyi T, Pusztai T. Phys Rev Lett<br />
2002;88:206105.<br />
[37] Weakley SC, Donlon W, Wolverton C, Jones JW, <strong>Al</strong>lison JE.<br />
unpublished.<br />
[38] Merle P, Fouquet F. Acta Metall 1981;29:1919.<br />
[39] Aaronson HI, Laird C. Trans Metall Soc AIME 1968;242:1437.<br />
[40] Sankaran R, Laird C. Acta Metall 1974;22:957.


