

Multiscale Modeling of Theta ' Precipitation in Al-Cu Binary Alloys
Multiscale Modeling of Theta ' Precipitation in Al-Cu Binary Alloys
Multiscale Modeling of Theta ' Precipitation in Al-Cu Binary Alloys

Create successful ePaper yourself
Turn your PDF publications into a flip-book with our unique Google optimized e-Paper software.
2984 V. Vaithyanathan et al. / Acta Materialia 52 (2004) 2973–2987<br />
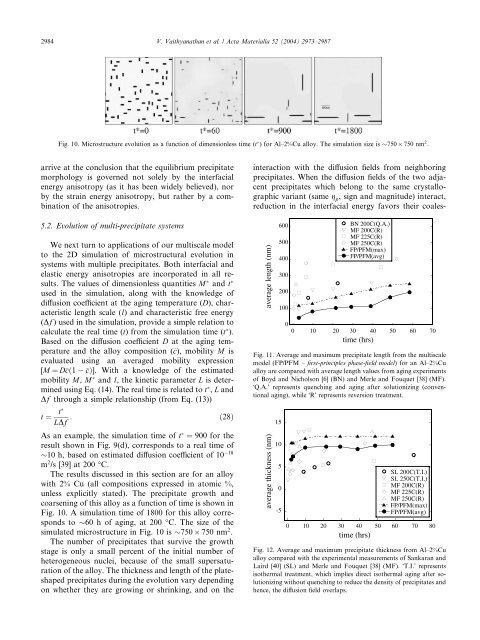
Fig. 10. Microstructure evolution as a function <strong>of</strong> dimensionless time (t ) for <strong>Al</strong>–2%<strong>Cu</strong> alloy. The simulation size is 750 750 nm 2 .<br />
arrive at the conclusion that the equilibrium precipitate<br />
morphology is governed not solely by the <strong>in</strong>terfacial<br />
energy anisotropy (as it has been widely believed), nor<br />
by the stra<strong>in</strong> energy anisotropy, but rather by a comb<strong>in</strong>ation<br />
<strong>of</strong> the anisotropies.<br />
5.2. Evolution <strong>of</strong> multi-precipitate systems<br />
We next turn to applications <strong>of</strong> our multiscale model<br />
to the 2D simulation <strong>of</strong> microstructural evolution <strong>in</strong><br />
systems with multiple precipitates. Both <strong>in</strong>terfacial and<br />
elastic energy anisotropies are <strong>in</strong>corporated <strong>in</strong> all results.<br />
The values <strong>of</strong> dimensionless quantities M and t <br />
used <strong>in</strong> the simulation, along with the knowledge <strong>of</strong><br />
diffusion coefficient at the ag<strong>in</strong>g temperature (D), characteristic<br />
length scale (l) and characteristic free energy<br />
(Df ) used <strong>in</strong> the simulation, provide a simple relation to<br />
calculate the real time (t) from the simulation time (t ).<br />
Based on the diffusion coefficient D at the ag<strong>in</strong>g temperature<br />
and the alloy composition (c), mobility M is<br />
evaluated us<strong>in</strong>g an averaged mobility expression<br />
[M ¼ Dcð1 cÞ]. With a knowledge <strong>of</strong> the estimated<br />
mobility M, M and l, the k<strong>in</strong>etic parameter L is determ<strong>in</strong>ed<br />
us<strong>in</strong>g Eq. (14). The real time is related to t , L and<br />
Df through a simple relationship (from Eq. (13))<br />
t ¼<br />
t<br />
LDf :<br />
ð28Þ<br />
As an example, the simulation time <strong>of</strong> t ¼ 900 for the<br />
result shown <strong>in</strong> Fig. 9(d), corresponds to a real time <strong>of</strong><br />
10 h, based on estimated diffusion coefficient <strong>of</strong> 10 18<br />
m 2 /s [39] at 200 °C.<br />
The results discussed <strong>in</strong> this section are for an alloy<br />
with 2% <strong>Cu</strong> (all compositions expressed <strong>in</strong> atomic %,<br />
unless explicitly stated). The precipitate growth and<br />
coarsen<strong>in</strong>g <strong>of</strong> this alloy as a function <strong>of</strong> time is shown <strong>in</strong><br />
Fig. 10. A simulation time <strong>of</strong> 1800 for this alloy corresponds<br />
to 60 h <strong>of</strong> ag<strong>in</strong>g, at 200 °C. The size <strong>of</strong> the<br />
simulated microstructure <strong>in</strong> Fig. 10 is 750 750 nm 2 .<br />
The number <strong>of</strong> precipitates that survive the growth<br />
stage is only a small percent <strong>of</strong> the <strong>in</strong>itial number <strong>of</strong><br />
heterogeneous nuclei, because <strong>of</strong> the small supersaturation<br />
<strong>of</strong> the alloy. The thickness and length <strong>of</strong> the plateshaped<br />
precipitates dur<strong>in</strong>g the evolution vary depend<strong>in</strong>g<br />
on whether they are grow<strong>in</strong>g or shr<strong>in</strong>k<strong>in</strong>g, and on the<br />
<strong>in</strong>teraction with the diffusion fields from neighbor<strong>in</strong>g<br />
precipitates. When the diffusion fields <strong>of</strong> the two adjacent<br />
precipitates which belong to the same crystallographic<br />
variant (same g p , sign and magnitude) <strong>in</strong>teract,<br />
reduction <strong>in</strong> the <strong>in</strong>terfacial energy favors their coales-<br />
average length (nm)<br />
600<br />
500<br />
400<br />
300<br />
200<br />
100<br />
BN 200C(Q.A.)<br />
MF 200C(R)<br />
MF 225C(R)<br />
MF 250C(R)<br />
FP/PFM(max)<br />
FP/PFM(avg)<br />
0<br />
0 10 20 30 40 50 60 70<br />
time (hrs)<br />
Fig. 11. Average and maximum precipitate length from the multiscale<br />
model (FP/PFM – first-pr<strong>in</strong>ciples phase-field model) for an <strong>Al</strong>–2%<strong>Cu</strong><br />
alloy are compared with average length values from ag<strong>in</strong>g experiments<br />
<strong>of</strong> Boyd and Nicholson [6] (BN) and Merle and Fouquet [38] (MF).<br />
ÔQ.A.Õ represents quench<strong>in</strong>g and ag<strong>in</strong>g after solutioniz<strong>in</strong>g (conventional<br />
ag<strong>in</strong>g), while ÔRÕ represents reversion treatment.<br />
average thickness (nm)<br />
15<br />
10<br />
5<br />
0<br />
-5<br />
SL 200C(T.I.)<br />
SL 250C(T.I.)<br />
MF 200C(R)<br />
MF 225C(R)<br />
MF 250C(R)<br />
FP/PFM(max)<br />
FP/PFM(avg)<br />
0 10 20 30 40 50 60 70 80<br />
time (hrs)<br />
Fig. 12. Average and maximum precipitate thickness from <strong>Al</strong>–2%<strong>Cu</strong><br />
alloy compared with the experimental measurements <strong>of</strong> Sankaran and<br />
Laird [40] (SL) and Merle and Fouquet [38] (MF). ÔT.I.Õ represents<br />
isothermal treatment, which implies direct isothermal ag<strong>in</strong>g after solutioniz<strong>in</strong>g<br />
without quench<strong>in</strong>g to reduce the density <strong>of</strong> precipitates and<br />
hence, the diffusion field overlaps.


