

Thermodynamic properties of Al, Ni, NiAl, and Ni3Al from first ...
Thermodynamic properties of Al, Ni, NiAl, and Ni3Al from first ...
Thermodynamic properties of Al, Ni, NiAl, and Ni3Al from first ...

Create successful ePaper yourself
Turn your PDF publications into a flip-book with our unique Google optimized e-Paper software.
2670 Y. Wang et al. / Acta Materialia 52 (2004) 2665–2671<br />
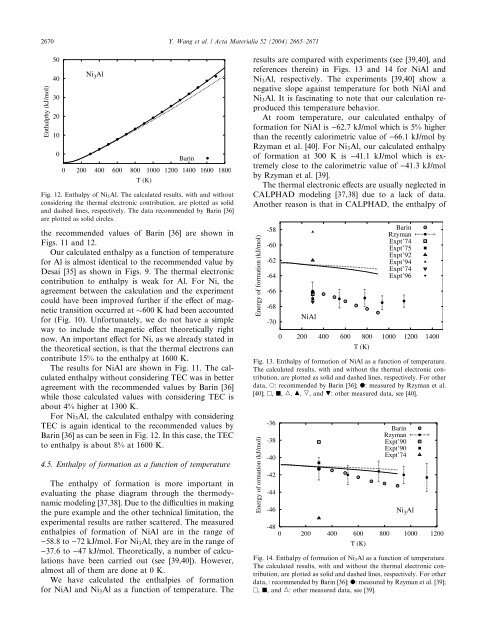
Fig. 12. Enthalpy <strong>of</strong> <strong>Ni</strong> 3 <strong>Al</strong>. The calculated results, with <strong>and</strong> without<br />
considering the thermal electronic contribution, are plotted as solid<br />
<strong>and</strong> dashed lines, respectively. The data recommended by Barin [36]<br />
are plotted as solid circles.<br />
the recommended values <strong>of</strong> Barin [36] are shown in<br />
Figs. 11 <strong>and</strong> 12.<br />
Our calculated enthalpy as a function <strong>of</strong> temperature<br />
for <strong>Al</strong> is almost identical to the recommended value by<br />
Desai [35] as shown in Figs. 9. The thermal electronic<br />
contribution to enthalpy is weak for <strong>Al</strong>. For <strong>Ni</strong>, the<br />
agreement between the calculation <strong>and</strong> the experiment<br />
could have been improved further if the effect <strong>of</strong> magnetic<br />
transition occurred at 600 K had been accounted<br />
for (Fig. 10). Unfortunately, we do not have a simple<br />
way to include the magnetic effect theoretically right<br />
now. An important effect for <strong>Ni</strong>, as we already stated in<br />
the theoretical section, is that the thermal electrons can<br />
contribute 15% to the enthalpy at 1600 K.<br />
The results for <strong>Ni</strong><strong>Al</strong> are shown in Fig. 11. The calculated<br />
enthalpy without considering TEC was in better<br />
agreement with the recommended values by Barin [36]<br />
while those calculated values with considering TEC is<br />
about 4% higher at 1300 K.<br />
For <strong>Ni</strong> 3 <strong>Al</strong>, the calculated enthalpy with considering<br />
TEC is again identical to the recommended values by<br />
Barin [36] as can be seen in Fig. 12. In this case, the TEC<br />
to enthalpy is about 8% at 1600 K.<br />
results are compared with experiments (see [39,40], <strong>and</strong><br />
references therein) in Figs. 13 <strong>and</strong> 14 for <strong>Ni</strong><strong>Al</strong> <strong>and</strong><br />
<strong>Ni</strong> 3 <strong>Al</strong>, respectively. The experiments [39,40] show a<br />
negative slope against temperature for both <strong>Ni</strong><strong>Al</strong> <strong>and</strong><br />
<strong>Ni</strong> 3 <strong>Al</strong>. It is fascinating to note that our calculation reproduced<br />
this temperature behavior.<br />
At room temperature, our calculated enthalpy <strong>of</strong><br />
formation for <strong>Ni</strong><strong>Al</strong> is )62.7 kJ/mol which is 5% higher<br />
than the recently calorimetric value <strong>of</strong> )66.1 kJ/mol by<br />
Rzyman et al. [40]. For <strong>Ni</strong> 3 <strong>Al</strong>, our calculated enthalpy<br />
<strong>of</strong> formation at 300 K is )41.1 kJ/mol which is extremely<br />
close to the calorimetric value <strong>of</strong> )41.3 kJ/mol<br />
by Rzyman et al. [39].<br />
The thermal electronic effects are usually neglected in<br />
CALPHAD modeling [37,38] due to a lack <strong>of</strong> data.<br />
Another reason is that in CALPHAD, the enthalpy <strong>of</strong><br />
Fig. 13. Enthalpy <strong>of</strong> formation <strong>of</strong> <strong>Ni</strong><strong>Al</strong> as a function <strong>of</strong> temperature.<br />
The calculated results, with <strong>and</strong> without the thermal electronic contribution,<br />
are plotted as solid <strong>and</strong> dashed lines, respectively. For other<br />
data, s: recommended by Barin [36]; d: measured by Rzyman et al.<br />
[40]; , j, M, N, O, <strong>and</strong> .: other measured data, see [40].<br />
4.5. Enthalpy <strong>of</strong> formation as a function <strong>of</strong> temperature<br />
The enthalpy <strong>of</strong> formation is more important in<br />
evaluating the phase diagram through the thermodynamic<br />
modeling [37,38]. Due to the difficulties in making<br />
the pure example <strong>and</strong> the other technical limitation, the<br />
experimental results are rather scattered. The measured<br />
enthalpies <strong>of</strong> formation <strong>of</strong> <strong>Ni</strong><strong>Al</strong> are in the range <strong>of</strong><br />
)58.8 to )72 kJ/mol. For <strong>Ni</strong> 3 <strong>Al</strong>, they are in the range <strong>of</strong><br />
)37.6 to )47 kJ/mol. Theoretically, a number <strong>of</strong> calculations<br />
have been carried out (see [39,40]). However,<br />
almost all <strong>of</strong> them are done at 0 K.<br />
We have calculated the enthalpies <strong>of</strong> formation<br />
for <strong>Ni</strong><strong>Al</strong> <strong>and</strong> <strong>Ni</strong> 3 <strong>Al</strong> as a function <strong>of</strong> temperature. The<br />
Fig. 14. Enthalpy <strong>of</strong> formation <strong>of</strong> <strong>Ni</strong> 3 <strong>Al</strong> as a function <strong>of</strong> temperature.<br />
The calculated results, with <strong>and</strong> without the thermal electronic contribution,<br />
are plotted as solid <strong>and</strong> dashed lines, respectively. For other<br />
data, : recommended by Barin [36]; d: measured by Rzyman et al. [39];<br />
, j, <strong>and</strong> M: other measured data, see [39].


