CAPITAL STRUCTURE AND THE COST OF CAPITAL External ...
CAPITAL STRUCTURE AND THE COST OF CAPITAL External ...
CAPITAL STRUCTURE AND THE COST OF CAPITAL External ...

Create successful ePaper yourself
Turn your PDF publications into a flip-book with our unique Google optimized e-Paper software.
Why the period 2000-2009? There is no obvious answer to this question. In this particular case, we just found historical data<br />
with relative ease; we could have searched harder and go back to 1990, or to 1980, to 1970, or even earlier. We have<br />
absolutely no guidance as to how far back into the past we should go, because beta and the market risk premium are based<br />
on market expectations going forward, not looking back. CAPM is absolutely mum on historical estimation simply because<br />
one is not supposed to estimate beta in this way. The honest conclusion is that we have chosen this particular data arbitrarily.<br />
Another arbitrarily choice refers to the type of return. Here we show monthly returns. We could have used annual returns, or<br />
weekly returns, or daily returns. Again, convenience proved to be the trump card. Monthly returns were readily available,<br />
and we simply settled for them. Let us continue then.<br />
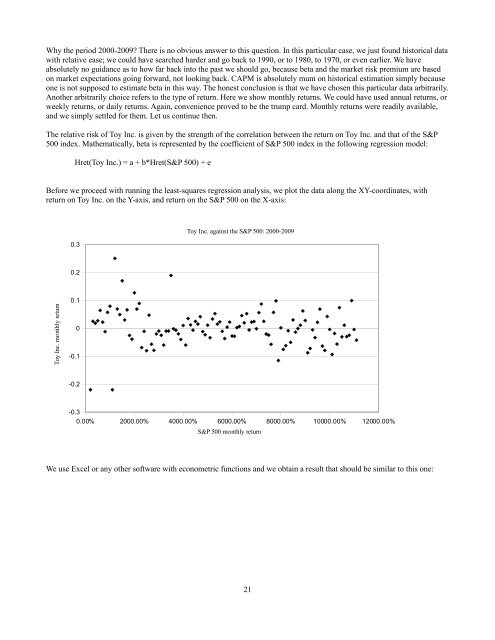
The relative risk of Toy Inc. is given by the strength of the correlation between the return on Toy Inc. and that of the S&P<br />
500 index. Mathematically, beta is represented by the coefficient of S&P 500 index in the following regression model:<br />
Hret(Toy Inc.) = a + b*Hret(S&P 500) + e<br />
Before we proceed with running the least-squares regression analysis, we plot the data along the XY-coordinates, with<br />
return on Toy Inc. on the Y-axis, and return on the S&P 500 on the X-axis:<br />
0.3<br />
Toy Inc. against the S&P 500: 2000-2009<br />
0.2<br />
Toy Inc. monthly return<br />
0.1<br />
0<br />
-0.1<br />
-0.2<br />
-0.3<br />
0.00% 2000.00% 4000.00% 6000.00% 8000.00% 10000.00% 12000.00%<br />
S&P 500 monthly return<br />
We use Excel or any other software with econometric functions and we obtain a result that should be similar to this one:<br />
21