CAPITAL STRUCTURE AND THE COST OF CAPITAL External ...
CAPITAL STRUCTURE AND THE COST OF CAPITAL External ...
CAPITAL STRUCTURE AND THE COST OF CAPITAL External ...

Create successful ePaper yourself
Turn your PDF publications into a flip-book with our unique Google optimized e-Paper software.
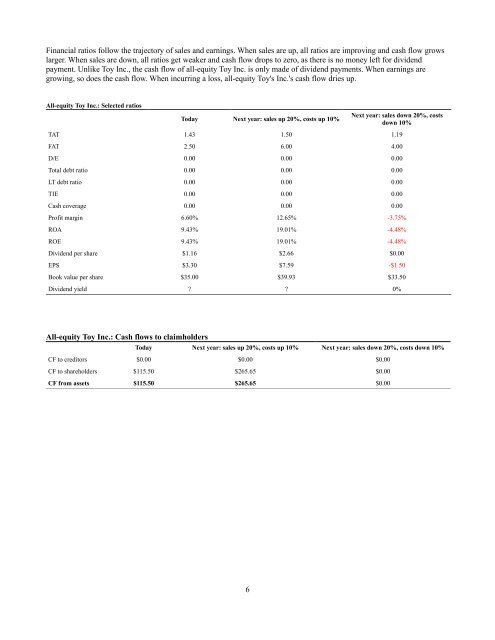
Financial ratios follow the trajectory of sales and earnings. When sales are up, all ratios are improving and cash flow grows<br />
larger. When sales are down, all ratios get weaker and cash flow drops to zero, as there is no money left for dividend<br />
payment. Unlike Toy Inc., the cash flow of all-equity Toy Inc. is only made of dividend payments. When earnings are<br />
growing, so does the cash flow. When incurring a loss, all-equity Toy's Inc.'s cash flow dries up.<br />
All-equity Toy Inc.: Selected ratios<br />
Today Next year: sales up 20%, costs up 10%<br />
Next year: sales down 20%, costs<br />
down 10%<br />
TAT 1.43 1.50 1.19<br />
FAT 2.50 6.00 4.00<br />
D/E 0.00 0.00 0.00<br />
Total debt ratio 0.00 0.00 0.00<br />
LT debt ratio 0.00 0.00 0.00<br />
TIE 0.00 0.00 0.00<br />
Cash coverage 0.00 0.00 0.00<br />
Profit margin 6.60% 12.65% -3.75%<br />
ROA 9.43% 19.01% -4.48%<br />
ROE 9.43% 19.01% -4.48%<br />
Dividend per share $1.16 $2.66 $0.00<br />
EPS $3.30 $7.59 -$1.50<br />
Book value per share $35.00 $39.93 $33.50<br />
Dividend yield ? ? 0%<br />
All-equity Toy Inc.: Cash flows to claimholders<br />
Today Next year: sales up 20%, costs up 10% Next year: sales down 20%, costs down 10%<br />
CF to creditors $0.00 $0.00 $0.00<br />
CF to shareholders $115.50 $265.65 $0.00<br />
CF from assets $115.50 $265.65 $0.00<br />
6