- Page 1 and 2:
OPTIMIZING THE JAVA VIRTUAL MACHINE
- Page 3 and 4:
Abstract Since its public introduct
- Page 5 and 6:
Acknowledgments While my name is th
- Page 7 and 8:
2.4.4 Direct Threading . . . . . .
- Page 9 and 10:
7.2 An Overview of Multicodes . . .
- Page 11 and 12:
List of Figures 2.1 Core Virtual Ma
- Page 13 and 14:
7.11 201 compress Performance by Mu
- Page 15 and 16:
B.1 The Steps Followed to Evaluate
- Page 17 and 18:
6.1 Most Frequently Occurring Const
- Page 19 and 20:
1 Chapter 1 Introduction When Moore
- Page 21 and 22:
3 Studies were conducted that consi
- Page 23 and 24:
5 Chapter 2 An Overview of Java Thi
- Page 25 and 26:
7 Addressing this need led to the d
- Page 27 and 28:
9 performs garbage collection, a cl
- Page 29 and 30:
11 also has the ability to contain
- Page 31 and 32:
13 ... i − 1 iload 0x04 dstore 0x
- Page 33 and 34: 15 ... aload 3 iconst 2 faload ...
- Page 35 and 36: 17 Condition Equal Unequal Greater
- Page 37 and 38: 19 transfered to the start of a new
- Page 39 and 40: 21 piled into machine language inst
- Page 41 and 42: 23 Figure 2.6: Interpreter Engine C
- Page 43 and 44: 25 Figure 2.8: Interpreter Engine C
- Page 45 and 46: 27 The following section examines t
- Page 47 and 48: 29 execute (JMethod * method, Slot
- Page 49 and 50: 31 codelets shown in this example a
- Page 51 and 52: 33 3.1 Instruction Set Design The a
- Page 53 and 54: 35 is replaced with a new opcode if
- Page 55 and 56: 37 method. However, the Java Virtua
- Page 57 and 58: 39 3.2.5 Bytecode Optimization Tool
- Page 59 and 60: 41 each bytecode executed as was ac
- Page 61 and 62: 43 executing the application. The a
- Page 63 and 64: 45 Chapter 4 Despecialization The J
- Page 65 and 66: 47 ... i − 1 iload 3 iload 0x04 i
- Page 67 and 68: 49 purpose bytecodes. The notation,
- Page 69 and 70: 51 is present in the constant pool
- Page 71 and 72: 53 ... iload 3 iflt ... i − 1 i i
- Page 73 and 74: 55 the stack challenging in some ca
- Page 75 and 76: Figure 4.7: Despecialization of Bra
- Page 77 and 78: 59 Specialized Bytecode load store
- Page 79 and 80: 61 tual machine (RVM). Version 2.3.
- Page 81 and 82: 63 Test Total Weighted Condition Pe
- Page 83: 65 Test Total Weighted Condition Pe
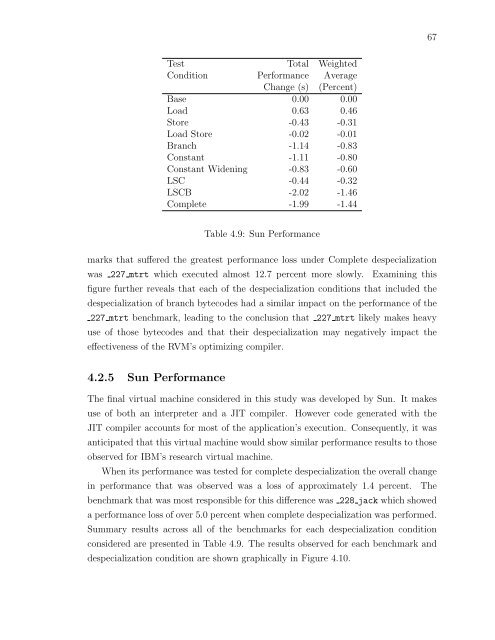
- Page 87 and 88: 69 4.2.6 Performance Summary Compar
- Page 89 and 90: 71 Category Original Desp. Percent
- Page 91 and 92: 73 the maximum value encountered af
- Page 93 and 94: 75 • Efficient support of new lan
- Page 95 and 96: 77 difference in the performance of
- Page 97 and 98: 79 JGF RayTracer: A 150 by 150 pixe
- Page 99 and 100: 81 # Average % of Specialized Despe
- Page 101 and 102: 83 provided by only two vendors. IB
- Page 103 and 104: Figure 5.1: Average Performance Res
- Page 105 and 106: 87 Figure 5.4: Performance Results
- Page 107 and 108: 89 Figure 5.8: Performance Results
- Page 109 and 110: 91 ences in background processes, m
- Page 111 and 112: 93 difference in performance due to
- Page 113 and 114: 95 when a pure interpreter virtual
- Page 115 and 116: 97 It is observed that many of the
- Page 117 and 118: 99 Within this category, it was als
- Page 119 and 120: 101 machine code for the idioms. As
- Page 121 and 122: 103 were performed was less than 0.
- Page 123 and 124: 105 these despecializations in a me
- Page 125 and 126: 107 Chapter 6 Operand Profiling Cha
- Page 127 and 128: 109 the applications. In addition,
- Page 129 and 130: 111 The aload 0 bytecode was the mo
- Page 131 and 132: 113 function being integrated. Beca
- Page 133 and 134: 115 Implementing alignment rules un
- Page 135 and 136:
117 these data types in the list of
- Page 137 and 138:
Figure 6.3: Distribution of Local V
- Page 139 and 140:
121 are never executed by any of th
- Page 141 and 142:
123 load and store bytecodes. It is
- Page 143 and 144:
125 the time because the index bein
- Page 145 and 146:
127 6.2.5 Fields Only four bytecode
- Page 147 and 148:
129 Figure 6.8: Data types Accessed
- Page 149 and 150:
131 lar, the new set of specialized
- Page 151 and 152:
133 multicode block is defined to b
- Page 153 and 154:
135 Figure 7.1: Two Bytecodes and t
- Page 155 and 156:
137 because of the presence of the
- Page 157 and 158:
139 cache performance. As a result,
- Page 159 and 160:
141 Block 1: Block 2: aload 0 → g
- Page 161 and 162:
143 Sequence Count Score getfield a
- Page 163 and 164:
Figure 7.3: Iterative Multicode Ide
- Page 165 and 166:
147 number of bytecodes that will b
- Page 167 and 168:
149 BlockList: A list of the byteco
- Page 169 and 170:
151 Both the Total Bytecodes Score
- Page 171 and 172:
153 ... i − 1 ❄ ifeq 0x00 0x15
- Page 173 and 174:
155 Figure 7.7: Number of Unique Ca
- Page 175 and 176:
Figure 7.9: Cumulative Multicode Bl
- Page 177 and 178:
159 However, while considering long
- Page 179 and 180:
161 Figure 7.10: 201 compress Perfo
- Page 181 and 182:
163 Figure 7.14: Length 209 db Perf
- Page 183 and 184:
165 Figure 7.18: 222 mpegaudio Perf
- Page 185 and 186:
167 7.6.2 Overall Performance Acros
- Page 187 and 188:
169 a larger portion of the instruc
- Page 189 and 190:
171 // iload_1: stack[sp+1] = local
- Page 191 and 192:
173 // iload_1: // iconst_1: // iad
- Page 193 and 194:
175 Such bytecodes have a variable
- Page 195 and 196:
177 ∆ x1 /x 2 /x 3 /.../x n→ an
- Page 197 and 198:
179 Popping any values left on the
- Page 199 and 200:
181 7.9 Conclusion This chapter has
- Page 201 and 202:
183 ated will differ from that occu
- Page 203 and 204:
185 Figure 8.1: A Comparison of the
- Page 205 and 206:
187 performed impacts the sequences
- Page 207 and 208:
189 Figure 8.2: 201 compress Perfor
- Page 209 and 210:
191 Figure 8.5: 213 javac Performan
- Page 211 and 212:
193 Compared to the complete despec
- Page 213 and 214:
195 Figure 8.10: 209 db Performance
- Page 215 and 216:
197 performing multicode substituti
- Page 217 and 218:
199 Chapter 9 An Efficient Multicod
- Page 219 and 220:
201 alphabet employed by each of th
- Page 221 and 222:
9.4 An Algorithm for the Most Contr
- Page 223 and 224:
Figure 9.3: The Impact of Algorithm
- Page 225 and 226:
207 Algorithm NonOverlappingScore(n
- Page 227 and 228:
209 Algorithm CountUniqueOccurrence
- Page 229 and 230:
211 this algorithm did not consider
- Page 231 and 232:
213 exceptions if the value being c
- Page 233 and 234:
215 Figure 10.1: Multicode Blocks u
- Page 235 and 236:
217 approximately 30 percent of the
- Page 237 and 238:
219 a strategy other than direct th
- Page 239 and 240:
221 10.2.6 Combining Multicodes and
- Page 241 and 242:
223 10.2.9 Expanding the Class File
- Page 243 and 244:
225 revealed that none of the const
- Page 245 and 246:
227 based on these profile results
- Page 247 and 248:
229 stitution were performed. It co
- Page 249 and 250:
231 [13] B. Alpern, C. R. Attanasio
- Page 251 and 252:
233 [33] K. Casey, D. Gregg, M. A.
- Page 253 and 254:
235 [55] D. Gregg and J. Waldron. P
- Page 255 and 256:
237 [78] E. M. McCreight. A space-e
- Page 257 and 258:
239 [100] L. A. Smith, J. M. Bull,
- Page 259 and 260:
241 [120] T. A. Welch. A technique
- Page 261 and 262:
243 # Len Score Multicode % 1 30 10
- Page 263 and 264:
245 # Len Score Multicode % 1 9 100
- Page 265 and 266:
247 # Len Score Multicode % 1 19 10
- Page 267 and 268:
249 # Len Score Multicode % 1 2 100
- Page 269 and 270:
251 # Len Score Multicode % 1 10 10
- Page 271 and 272:
253 Table A.5 continued: # Len Scor
- Page 273 and 274:
255 Table A.6 continued: # Len Scor
- Page 275 and 276:
257 Table A.7 continued: # Len Scor
- Page 277 and 278:
259 the level of entropy within the
- Page 279 and 280:
261 there are no pointers to these
- Page 281 and 282:
263 information for each method so
- Page 283 and 284:
265 to emit four files that were su
- Page 285 and 286:
Figure B.1: The Steps Followed to E
- Page 287 and 288:
269 B.7 Summary This Chapter has de
- Page 289 and 290:
271 Selected Honors and Awards Cont
- Page 291:
273 Departmental and University Pre


