Accommodating_growth_one
Accommodating_growth_one
Accommodating_growth_one

Create successful ePaper yourself
Turn your PDF publications into a flip-book with our unique Google optimized e-Paper software.
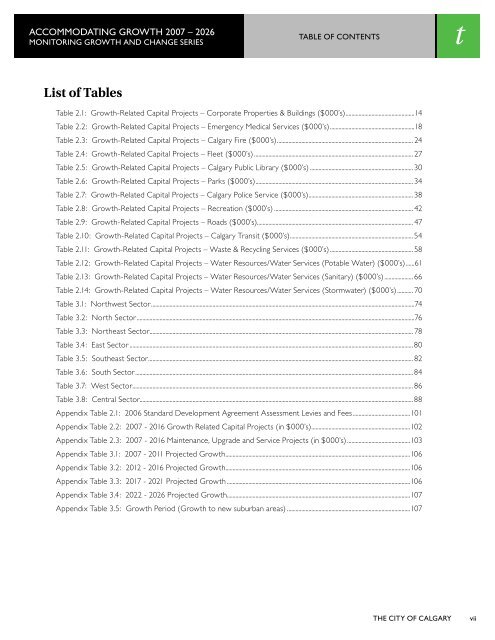
accommodating <strong>growth</strong> 2007 – 2026<br />
monitoring <strong>growth</strong> and change series<br />
table of contents<br />
t<br />
List of Tables<br />
Table 2.1: Growth-Related Capital Projects – Corporate Properties & Buildings ($000’s)................................................14<br />
Table 2.2: Growth-Related Capital Projects – Emergency Medical Services ($000’s)...........................................................18<br />
Table 2.3: Growth-Related Capital Projects – Calgary Fire ($000’s)............................................................................................... 24<br />
Table 2.4: Growth-Related Capital Projects – Fleet ($000’s) ............................................................................................................... 27<br />
Table 2.5: Growth-Related Capital Projects – Calgary Public Library ($000’s) ........................................................................30<br />
Table 2.6: Growth-Related Capital Projects – Parks ($000’s)..............................................................................................................34<br />
Table 2.7: Growth-Related Capital Projects – Calgary Police Service ($000’s).........................................................................38<br />
Table 2.8: Growth-Related Capital Projects – Recreation ($000’s) ................................................................................................. 42<br />
Table 2.9: Growth-Related Capital Projects – Roads ($000’s)............................................................................................................. 47<br />
Table 2.10: Growth-Related Capital Projects – Calgary Transit ($000’s)......................................................................................54<br />
Table 2.11: Growth-Related Capital Projects – Waste & Recycling Services ($000’s).......................................................... 58<br />
Table 2.12: Growth-Related Capital Projects – Water Resources/Water Services (Potable Water) ($000’s)......61<br />
Table 2.13: Growth-Related Capital Projects – Water Resources/Water Services (Sanitary) ($000’s).................... 66<br />
Table 2.14: Growth-Related Capital Projects – Water Resources/Water Services (Stormwater) ($000’s)........... 70<br />
Table 3.1: Northwest Sector........................................................................................................................................................................................74<br />
Table 3.2: North Sector..................................................................................................................................................................................................76<br />
Table 3.3: Northeast Sector........................................................................................................................................................................................ 78<br />
Table 3.4: East Sector ......................................................................................................................................................................................................80<br />
Table 3.5: Southeast Sector......................................................................................................................................................................................... 82<br />
Table 3.6: South Sector..................................................................................................................................................................................................84<br />
Table 3.7: West Sector.................................................................................................................................................................................................... 86<br />
Table 3.8: Central Sector...............................................................................................................................................................................................88<br />
Appendix Table 2.1: 2006 Standard Development Agreement Assessment Levies and Fees........................................101<br />
Appendix Table 2.2: 2007 - 2016 Growth Related Capital Projects (in $000’s).....................................................................102<br />
Appendix Table 2.3: 2007 - 2016 Maintenance, Upgrade and Service Projects (in $000’s)............................................103<br />
Appendix Table 3.1: 2007 - 2011 Projected Growth.................................................................................................................................106<br />
Appendix Table 3.2: 2012 - 2016 Projected Growth.................................................................................................................................106<br />
Appendix Table 3.3: 2017 - 2021 Projected Growth ................................................................................................................................106<br />
Appendix Table 3.4: 2022 - 2026 Projected Growth................................................................................................................................107<br />
Appendix Table 3.5: Growth Period (Growth to new suburban areas) ......................................................................................107<br />
the city of calgary<br />
vii