Extreme Weather, Climate and Natural Disasters in Ireland
Extreme Weather, Climate and Natural Disasters in Ireland
Extreme Weather, Climate and Natural Disasters in Ireland
You also want an ePaper? Increase the reach of your titles
YUMPU automatically turns print PDFs into web optimized ePapers that Google loves.
<strong>Extreme</strong> <strong>Weather</strong>, <strong>Climate</strong> <strong>and</strong> <strong>Natural</strong> <strong>Disasters</strong> <strong>in</strong> Irel<strong>and</strong><br />
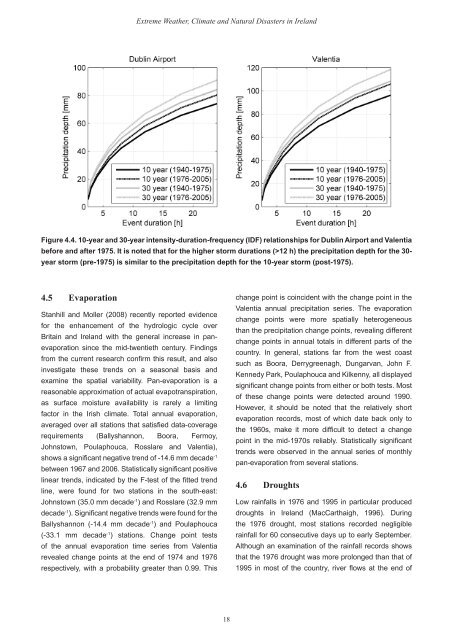
Figure 4.4. 10-year <strong>and</strong> 30-year <strong>in</strong>tensity-duration-frequency (IDF) relationships for Dubl<strong>in</strong> Airport <strong>and</strong> Valentia<br />
before <strong>and</strong> after 1975. It is noted that for the higher storm durations (>12 h) the precipitation depth for the 30-<br />
year storm (pre-1975) is similar to the precipitation depth for the 10-year storm (post-1975).<br />
4.5 Evaporation<br />
Stanhill <strong>and</strong> Moller (2008) recently reported evidence<br />
for the enhancement of the hydrologic cycle over<br />
Brita<strong>in</strong> <strong>and</strong> Irel<strong>and</strong> with the general <strong>in</strong>crease <strong>in</strong> panevaporation<br />
s<strong>in</strong>ce the mid-twentieth century. F<strong>in</strong>d<strong>in</strong>gs<br />
from the current research confirm this result, <strong>and</strong> also<br />
<strong>in</strong>vestigate these trends on a seasonal basis <strong>and</strong><br />
exam<strong>in</strong>e the spatial variability. Pan-evaporation is a<br />
reasonable approximation of actual evapotranspiration,<br />
as surface moisture availability is rarely a limit<strong>in</strong>g<br />
factor <strong>in</strong> the Irish climate. Total annual evaporation,<br />
averaged over all stations that satisfied data-coverage<br />
requirements (Ballyshannon, Boora, Fermoy,<br />
Johnstown, Poulaphouca, Rosslare <strong>and</strong> Valentia),<br />
shows a significant negative trend of -14.6 mm decade -1<br />
between 1967 <strong>and</strong> 2006. Statistically significant positive<br />
l<strong>in</strong>ear trends, <strong>in</strong>dicated by the F-test of the fitted trend<br />
l<strong>in</strong>e, were found for two stations <strong>in</strong> the south-east:<br />
Johnstown (35.0 mm decade -1 ) <strong>and</strong> Rosslare (32.9 mm<br />
decade -1 ). Significant negative trends were found for the<br />
Ballyshannon (-14.4 mm decade -1 ) <strong>and</strong> Poulaphouca<br />
(-33.1 mm decade -1 ) stations. Change po<strong>in</strong>t tests<br />
of the annual evaporation time series from Valentia<br />
revealed change po<strong>in</strong>ts at the end of 1974 <strong>and</strong> 1976<br />
respectively, with a probability greater than 0.99. This<br />
change po<strong>in</strong>t is co<strong>in</strong>cident with the change po<strong>in</strong>t <strong>in</strong> the<br />
Valentia annual precipitation series. The evaporation<br />
change po<strong>in</strong>ts were more spatially heterogeneous<br />
than the precipitation change po<strong>in</strong>ts, reveal<strong>in</strong>g different<br />
change po<strong>in</strong>ts <strong>in</strong> annual totals <strong>in</strong> different parts of the<br />
country. In general, stations far from the west coast<br />
such as Boora, Derrygreenagh, Dungarvan, John F.<br />
Kennedy Park, Poulaphouca <strong>and</strong> Kilkenny, all displayed<br />
significant change po<strong>in</strong>ts from either or both tests. Most<br />
of these change po<strong>in</strong>ts were detected around 1990.<br />
However, it should be noted that the relatively short<br />
evaporation records, most of which date back only to<br />
the 1960s, make it more difficult to detect a change<br />
po<strong>in</strong>t <strong>in</strong> the mid-1970s reliably. Statistically significant<br />
trends were observed <strong>in</strong> the annual series of monthly<br />
pan-evaporation from several stations.<br />
4.6 Droughts<br />
Low ra<strong>in</strong>falls <strong>in</strong> 1976 <strong>and</strong> 1995 <strong>in</strong> particular produced<br />
droughts <strong>in</strong> Irel<strong>and</strong> (MacCarthaigh, 1996). Dur<strong>in</strong>g<br />
the 1976 drought, most stations recorded negligible<br />
ra<strong>in</strong>fall for 60 consecutive days up to early September.<br />
Although an exam<strong>in</strong>ation of the ra<strong>in</strong>fall records shows<br />
that the 1976 drought was more prolonged than that of<br />
1995 <strong>in</strong> most of the country, river flows at the end of<br />
18


