

Asia and the Pacific Education for All (EFA) mid-decade assessment ...
Asia and the Pacific Education for All (EFA) mid-decade assessment ...
Asia and the Pacific Education for All (EFA) mid-decade assessment ...

You also want an ePaper? Increase the reach of your titles
YUMPU automatically turns print PDFs into web optimized ePapers that Google loves.
Policy <strong>for</strong> support of ethnic <strong>and</strong> o<strong>the</strong>r disadvantaged groups includes construction of permanent<br />
schools (“concretization”, i.e., build with concrete instead of bamboo) <strong>and</strong> con solid ation of small<br />
schools. Free textbooks <strong>and</strong> learning materials are provided <strong>for</strong> poor children, including ethnic<br />
minorities. Ef<strong>for</strong>ts are made to ensure appropriate conditions of living <strong>and</strong> professional activities<br />
of teachers who work in remote, ethnic, <strong>and</strong> mountainous areas. Six ODA loan projects funded by<br />
<strong>the</strong> World Bank <strong>and</strong> donor agencies are targeted on dis advantaged children <strong>and</strong> youth at primary,<br />
lower secondary, <strong>and</strong> upper secondary levels.<br />
18.6.2 Progress Achieved in Selected <strong>EFA</strong> MDA Core Indicators in Viet Nam<br />
a. Assessing Progress Using Times Series Data<br />
The Survival Rate to Grade 5 increased by more than 3 per centage points between 2003/04 <strong>and</strong><br />
2004/05. Combined with <strong>the</strong> increase in NER shown in Table 212, page 204 above, this shows a<br />
very significant increase in <strong>the</strong> proportion of each age cohort surviving to Grade 5 <strong>and</strong> a rapid<br />
approach to universal primary education.<br />
Survival rates to Grade 9, <strong>the</strong> final grade in lower secondary school, are shown in Table 217, page<br />
207. Over <strong>the</strong> period 2002/03 to 2005/06, <strong>the</strong> survival rate has increased gradually by more than 5<br />
percentage points. The increased survival rate is a result of declines in <strong>the</strong> repetition <strong>and</strong> drop-out<br />
rates. In addition, <strong>the</strong> number of drop-outs who came back to school also rose.<br />
Teachers. In recent years, local ef<strong>for</strong>ts have been made on <strong>the</strong> implementation of “primary teacher<br />
st<strong>and</strong>ardisation” policy, which is an important measure to improve <strong>the</strong> quality of primary education.<br />
In 2001/02, only 88% of teachers had st<strong>and</strong>ard or higher levels of qualifications. This number<br />
increased in <strong>the</strong> following years to 96% by 2005/06. The proportion of teachers with st<strong>and</strong>ard or<br />
higher qual i fi ca tions has significantly improved, especially in disadvantaged areas, as seen in Table<br />
223, page 211.<br />
225<br />
At <strong>the</strong> lower secondary level, only 91% of lower secondary school teach ers in <strong>the</strong> whole country<br />
met <strong>the</strong> st<strong>and</strong>ard academic qual ifications, but over <strong>the</strong> half-<strong>decade</strong> to 2005/06 this pro por tion<br />
rose by more than 5 per centage points to over 96%, as seen in Table 223. In <strong>the</strong> provinces with <strong>the</strong><br />
lowest proportion of aca dem ic ally qualified lower secondary school teachers (North East, North<br />
Central, <strong>and</strong> Mekong River Delta Regions), <strong>the</strong> pro portion of teachers with <strong>the</strong> required academic<br />
qual i fi ca tions rose from under 88% to over 94%. The regional variation declined signifi cantly over<br />
<strong>the</strong> period.<br />
The pupil/teacher ratio <strong>for</strong> primary school fell from 26.3 in 2001/02 to 20.7 in 2005/06, <strong>and</strong> <strong>for</strong><br />
lower secondary level from 25.7 to 21.1.<br />
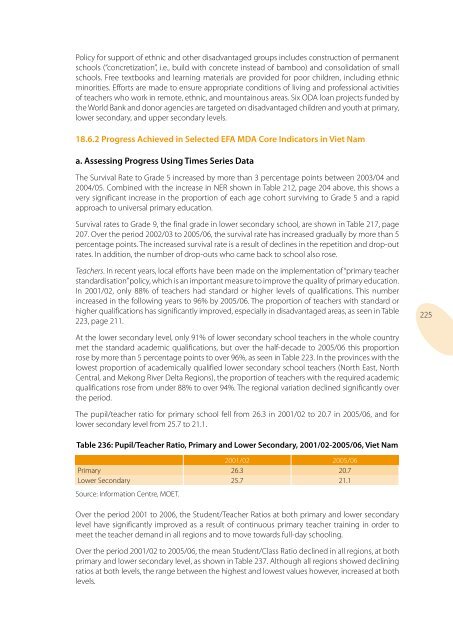
Table 236: Pupil/Teacher Ratio, Primary <strong>and</strong> Lower Secondary, 2001/02-2005/06, Viet Nam<br />
2001/02 2005/06<br />
Primary 26.3 20.7<br />
Lower Secondary 25.7 21.1<br />
Source: In<strong>for</strong>mation Centre, MOET.<br />
Over <strong>the</strong> period 2001 to 2006, <strong>the</strong> Student/ Teacher Ratios at both primary <strong>and</strong> lower second ary<br />
level have significantly improved as a result of continuous primary teacher training in order to<br />
meet <strong>the</strong> teacher dem<strong>and</strong> in all regions <strong>and</strong> to move towards full-day schooling.<br />
Over <strong>the</strong> period 2001/02 to 2005/06, <strong>the</strong> mean Student/Class Ratio declined in all regions, at both<br />
primary <strong>and</strong> lower secondary level, as shown in Table 237. Although all regions showed declining<br />
ratios at both levels, <strong>the</strong> range between <strong>the</strong> highest <strong>and</strong> lowest values however, increased at both<br />
levels.


