pdf, 1.1 MB - University of Massachusetts Lowell
pdf, 1.1 MB - University of Massachusetts Lowell
pdf, 1.1 MB - University of Massachusetts Lowell

You also want an ePaper? Increase the reach of your titles
YUMPU automatically turns print PDFs into web optimized ePapers that Google loves.
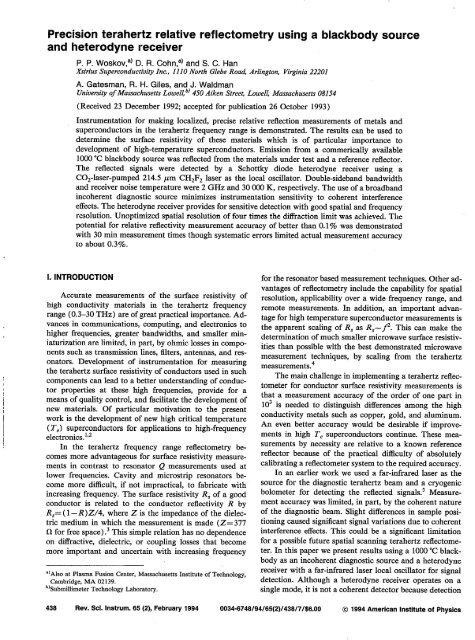
Precisioh terahertz relative redlectometry using a blackbody source<br />
and heterodyne receiver<br />
P. P. Woskov,a) D. R. Cohqa) and S. C. Han<br />
Ksirius Superconductivity Inc., 1110 North GIebe Road, Arlington, Virginia 22201<br />
A. Gatesman, FL H. Giles, and J. Waldman<br />
<strong>University</strong> <strong>of</strong> <strong>Massachusetts</strong> <strong>Lowell</strong>,b) 4.50 Aiken Street, <strong>Lowell</strong>, <strong>Massachusetts</strong> 08154<br />
(Received 23 December 1992; accepted for publication 26 October 1993)<br />
Instrumentation for making localized, precise relative reflection measurements <strong>of</strong> metals and<br />
superconductors in the terahertz frequency range is demonstrated. The results can be used to<br />
determine the surface resistivity <strong>of</strong> these materials which is <strong>of</strong> particular importance to<br />
development <strong>of</strong> high-temperature superconductors. Emission from a commerically available<br />
1000 “C blackbody source was reflected from the materials under test and a reference reflector.<br />
The reflected signals were detected by a Schottky diode heterodyne receiver using a<br />
CO,-laser-pumped 214.5 pm CH,F, laser as the local oscillator. Double-sideband bandwidth<br />
and receiver noise temperature were 2 GHz and 30 000 K, respectively. The use <strong>of</strong> a broadband<br />
incoherent diagnostic source minimizes instrumentation sensitivity to coherent interference<br />
effects. The heterodyne receiver provides for sensitive detection with good spatial and frequency<br />
resolution. Unoptimized spatial resolution <strong>of</strong> four times the diffraction limit was achieved. The<br />
potential for relative reflectivity measurement accuracy <strong>of</strong> better than 0.1% was demonstrated<br />
with 30 min measurement times though systematic errors limited actual measurement accuracy<br />
to about 0.3%.<br />
I. INTRODUCTION<br />
Accurate measurements <strong>of</strong> the surface resistivity <strong>of</strong><br />
high conductivity materials in the terahertz frequency<br />
range (0.3-30 THz) are <strong>of</strong> great practical importance. Advances<br />
in communications, computing, and electronics to<br />
higher frequencies, greater bandwidths, and smaller miniaturization<br />
are limited, in part, by ohmic losses in components<br />
such as transmission lines, filters, antennas, and resonators.<br />
Development <strong>of</strong> instrumentation for measuring<br />
the terahertz surface resistivity <strong>of</strong> conductors used in such<br />
components can lead to a better understanding <strong>of</strong> conductor<br />
properties at these high frequencies, provide for a<br />
means <strong>of</strong> quality control, and facilitate the development <strong>of</strong><br />
new materials. Of particular motivation to the present<br />
work is the development <strong>of</strong> new high critical temperature<br />
(T,) superconductors for applications to high-frequency<br />
electronics. ‘9’<br />
In the terahertz frequency range reflectometry becomes<br />
more advantageous for surface resistivity measurements<br />
in contrast to resonator Q measurements used at<br />
lower frequencies. Cavity and microstrip resonators become<br />
more difficult, if not impractical, to fabricate with<br />
increasing frequency. The surface resistivity R, <strong>of</strong> a good<br />
conductor is related to the conductor reflectivity R by<br />
R,= (1 -R)Z/4, where Z is.the impedance <strong>of</strong> the dielectric<br />
medium in which the measurement is made (Z=377<br />
s1 for free space) .3 This simple relation has no dependence<br />
on diffractive, dielectric, or coupling losses that become<br />
more important and uncertain with increasing frequency<br />
ajAl~~ at Plasma Fusion Center, <strong>Massachusetts</strong> Institute <strong>of</strong> Technology,<br />
Cambridge, MA 02139.<br />
“Submillimeter Technology Laboratory.<br />
for the resonator based measurement techniques. Other advantages<br />
<strong>of</strong> reflectometry include the capability for spatial<br />
resolution, applicability over a wide frequency range, and<br />
remote measurements. In addition, an important advantage<br />
for high temperature superconductor measurements is<br />
the apparent scaling <strong>of</strong> R, as R,- f”. This can make the<br />
determination <strong>of</strong> much smaller microwave surface resistivities<br />
than possible with the best demonstrated microwave<br />
measurement techniques, by scaling from the terahertz<br />
measurements.4<br />
The main challenge in implementing a terahertz reflectometer<br />
for conductor surface resistivity measurements is<br />
that a measurement accuracy <strong>of</strong> the order <strong>of</strong> one part in<br />
lo3 is needed to distinguish differences among the high<br />
conductivity metals such as copper, gold, and aluminum.<br />
An even better accuracy would be desirable if improvements<br />
in high T, superconductors continue. These measurements<br />
by necessity are relative to a known reference<br />
reflector because <strong>of</strong> the practical difficulty <strong>of</strong> absolutely<br />
calibrating a reflectometer system to the required accuracy.<br />
In an earlier work we used a far-infrared laser as the<br />
source for the diagnostic terahertz beam and a cryogenic<br />
bolometer for detecting the reflected signals.5 Measurement<br />
accuracy was limited, in part, by the coherent nature<br />
<strong>of</strong> the diagnostic beam. Slight differences in sample positioning<br />
caused significant signal variations due to coherent<br />
interference effects. This could be a significant limitation<br />
for a possible future spatial scanning terahertz reflectometer.<br />
In this paper we present results using a 1000 “C! blackbody<br />
as an incoherent diagnostic source and a heterodyne<br />
receiver with a far-infrared laser local oscillator for signal<br />
detection. Although a heterodyne receiver operates on a<br />
single mode, it is not a coherent detector because detection<br />
436 Rev. Sci. Instrum. 65 (2), February 1994 0034-6746/94/65(2)/436/7/$6.00 0 1994 American Institute <strong>of</strong> Physics
To computer<br />
control<br />
BS Beam splitter<br />
C Black body source chopper<br />
FP Flip mirmr<br />
Ll Lens for collimating FIR laser beam<br />
L2 Focusing lens<br />
Diode<br />
Mixer<br />
Bolometar<br />
dvm<br />
Ml Fast <strong>of</strong>f-axis parabolic mirror<br />
M2 Focusing mirror<br />
MS Flat mirror for alignment laser<br />
M4 Fast <strong>of</strong>f-axis parabolic mirror<br />
FIG. 1. Incoherent source/heterodyne receiver terahertz reflectometer<br />
instrument setup. The Dewar is replaced by a sample wheel and the flip<br />
mirror is removed for the room-temperature measurements.<br />
is over a wide instantaneous bandwidth, 2 GHz in this<br />
case, which effectively averages over unwanted interference<br />
peaks and minima. With respect to a bolometer detector it<br />
has a combined advantage in speed, sensitivity, and spatial<br />
resolution without requiring cryogenics.<br />
II. EXPERIMENTAL<br />
SETUP<br />
Two experimental configurations were used. One for<br />
room-temperature measurements and another with a<br />
Dewar for measurements as a function <strong>of</strong> temperature. The<br />
instrument configuration with the Dewar is shown in Fig.<br />
1 The room-temperature configuration differed only in that<br />
a room-temperature sample holder wheel took the place <strong>of</strong><br />
the Dewar. Also the flip mirror (FP) was removed and the<br />
reference reflector (SR) was incorporated as one <strong>of</strong> four<br />
samples mounted in the wheel.<br />
The far-infrared (FIR) laser used for all the measurements<br />
was a CO,-laser-pumped 214.5 pm ( 1.40 THz)<br />
CH2F2 laser. The diverging, vertically polarized laser beam<br />
was approximately collimated by a 61 cm focal length TPX<br />
lens, Ll. A 6.0-cm-diam aperture directly after this lens<br />
was used to spatially filter small side lobes in the beam<br />
pr<strong>of</strong>ile. In this way a relatively clean Gaussian beam with<br />
a l/e2 diameter <strong>of</strong> 34 mm was established. Figure 2 shows<br />
this pr<strong>of</strong>ile as scanned by a bolometer - 1 m from lens Ll.<br />
The smooth curve is a theoretical Gaussian fit to the<br />
slightly noisy measured pr<strong>of</strong>ile.<br />
A Mylar beam splitter was used to reflect a part <strong>of</strong> the<br />
laser beam to the Schottky diode mixer as the local oscillator.<br />
This beamsplitter also passed the signal from the test<br />
samples, therefore its reflectivity had to be no higher than<br />
necessary to saturate the mixer. An optimum beam splitter<br />
thickness <strong>of</strong> 0.5 mil (25.4 pm) was found, having a measured<br />
reflectivity <strong>of</strong> 15% at 214.5 pm. The part <strong>of</strong> the laser<br />
beam not reflected toward the mixer was used to monitor<br />
the laser power with a bolometer.<br />
A Melles Griot 95 mm diameter, 84 mm focal length<br />
<strong>of</strong>f-axis parabolic mirror focused the laser beam onto the<br />
mixer. The mixer was a <strong>University</strong> <strong>of</strong> Virginia corner cube<br />
mounted Schottky diode optimized for a wavelength <strong>of</strong> 192<br />
pm. Though the whisker antenna parameters (length<br />
L=4A, distance from corner d= 1.2A, A= 192 pm) <strong>of</strong> this<br />
diode were also close to optimum for 214.5 pm, the laser<br />
spot size that was achieved with the given beam diameter<br />
0.1900<br />
214.5 pm Laser Protile<br />
0.1425 t<br />
3<br />
$f 9SOOE-02 -<br />
P<br />
‘3<br />
2<br />
Position (mm)<br />
FIG. 2. The 214.5 pm laser beam pr<strong>of</strong>ile 1 m from the collimating lens. The slightly noisy curve is the bolometer scan. The smooth curve is the best-fit<br />
Gaussian.<br />
Rev. Sci. Instrum., Vol. 65, No. 2, February 1994 Relative reflectometry 439
and parabolic mirror was much larger ( ws/A z 3) than the<br />
optimum <strong>of</strong> wd/z- 1.82.6~<br />
The intermediate frequency (IF) amplifiers covered a<br />
frequency range <strong>of</strong> 1.4-2.4 GHz. The receiver accepted the<br />
signal in this frequency range. both above and below the<br />
laser frequency for a total double-sideband (DSB) bandwidth<br />
<strong>of</strong> 2 GHz. A Hewlett Packard microwave Schottky<br />
diode detected the IF signal following 60 dB gain.<br />
A 30 cm focal length TPX lens L2 focused the receiver<br />
field <strong>of</strong> view onto the test sample. The sample was oriented<br />
so that the receiver field <strong>of</strong> view was reflected to 30 cm<br />
focal length mirror M2. This mirror recollimated the receiver<br />
field <strong>of</strong> view and directed it toward mirror M4 (an<br />
<strong>of</strong>f-axis parabolic mirror identical to M 1) which focused it<br />
into the hot blackbody source. The hot blackbody was an<br />
Infrared Industries model IR-563 source operated at a<br />
1000 “C setting.<br />
The chopper C with eccosorb7 covered blades modulated<br />
the blackbody signal as seen by the receiver via the<br />
sample reflection. The receiver would alternately view the<br />
room-temperature chopper blades and hot blackbody. The<br />
difference signal was synchronously detected with the<br />
lock-in amplifier. Since this signal is seen via the sample<br />
reflection it is proportional to the sample reflectivity assuming<br />
everything else in the system including alignment<br />
remains constant.<br />
In the room-temperature setup a large wheel with four<br />
equally spaced samples in its surface, was rotated by a<br />
computer-controlled stepper motor to bring the samples<br />
into position one at a time for a reflection measurement.<br />
The samples were sized to fit into 32 mm diameter recesses<br />
in the sample wheel behind a cover allowing a 22 mm clear<br />
aperture for each sample. The second sample in one revolution<br />
was designated as the reference reflector, the signal<br />
from which was used to normalize the other signals. The<br />
reference reflector for all the room-temperature measurements<br />
presented here was an Edmunds Scientific goldcoated<br />
glass mirror. The sample wheel paused for five<br />
lock-in time constants <strong>of</strong> typically one second for each<br />
reflection measurement. A data set consisted <strong>of</strong> measurements<br />
made over many sample wheel revolutions.<br />
In the cryogenic setup, a flip mirror FP was used to<br />
alternately view a reflection from a reference and that from<br />
the sample in the Dewar. Since the.room-temperature reflectivity<br />
was already measured with the sample wheel<br />
setup, the absolute calibration <strong>of</strong> the reference reflector and<br />
window losses were not important. It was only necessary to<br />
monitor the change in sample reflectivity relative to room<br />
temperature. A polyethylene window mounted at a 20” angle<br />
on the 25-mm-diam Dewar aperture also filtered out<br />
near infrared and visible emission from the hot blackbody.<br />
III. REFLECTOMETER<br />
SYSTEM PERFORMANCE<br />
The performance parameters <strong>of</strong> interest are the accuracy<br />
<strong>of</strong> the reflection measurements, the spatial resolution,<br />
and if the use <strong>of</strong> an incoherent, source improves reproducible<br />
performance as compared to earlier use <strong>of</strong> a laser<br />
beam.5 In the laser measurements it was found that the<br />
instrument setup was extremely sensitive to sample align-<br />
ment as well as to translation <strong>of</strong> less than a wavelength<br />
along the beam path. In the present work there was a<br />
significant improvement in the robustness <strong>of</strong> the setup to<br />
sample positioning.<br />
A. Accuracy <strong>of</strong> measurements<br />
A figure <strong>of</strong> merit for the potential accuracy <strong>of</strong> the measurements<br />
is the signal-to-noise ratio for measuring a thermal<br />
noise level by a heterodyne receiver?<br />
S/N= TBByT,,, $cGTl,<br />
where TBB is the blackbody noise temperature, Tsys is the<br />
receiver system noise temperature at the blackbody source,<br />
Af is the bandwidth <strong>of</strong> the measurement, r is the signal<br />
integration time for one measurement! and n is the number<br />
<strong>of</strong> measurements. For the measurements presented here,<br />
TBIA Tsrs 3 the signal-to-noise ratio is proportional to the<br />
blackbody temperature as well as to the square root <strong>of</strong> the<br />
bandwidth, integration time, and number <strong>of</strong> measurements.<br />
The system noise temperature was measured by placing<br />
a liquid-nitrogen blackbody source (eecosorb) behind<br />
the chopper. The noise temperature in degrees K was then<br />
determined by using the following equation:<br />
216vdvm<br />
Tws=q 9 r7 -293,<br />
L*L ” lock-in<br />
where v&, is the voltage on the digital voltmeter connected<br />
to the receiver output, F/lo&-in is the lock-in amplifier<br />
signal, and the factor 216 is the difference in degrees K<br />
between room and liquid-nitrogen temperatures. The fattor<br />
<strong>of</strong> 2.2 in the denominator converts the lock-in amplifier<br />
reading which is a rectified mean voltage to a peak-to-peak<br />
voltage. This factor was experimentally determined for a<br />
square wave input to our EG&G model 5209 lock-in amplifier.<br />
In making system noise temperature measurements it<br />
was discovered that there was a significant air-path loss in<br />
the range <strong>of</strong> 3.0-5.0 dB per meter. Unfortunately, the 214.5<br />
pm laser line is near a water vapor absorption line. The<br />
system noise temperature therefore depended on how far<br />
from the mixer it was measured. The best noise temperature<br />
achieved was 30 000 K at the location <strong>of</strong> the test<br />
sample 53 cm from the mixer, but this value deteriorated to<br />
about 77 000 K at the location <strong>of</strong> the blackbody. Using Eq.<br />
( 1) this corresponds to a signal-to-noise ratio <strong>of</strong> -550 for<br />
a single one second measurement.<br />
Having the receiver mixer saturated by the laser local<br />
oscillator is an advantage for measurement accuracy because<br />
it makes the system less sensitive to laser power drift<br />
and fluctuations. Saturated operation was experimentally<br />
verified as shown in Fig. 3 where system noise temperature<br />
versus local oscillator (LO) power is plotted. In the<br />
present setup the receiver was operated at an LO power<br />
level <strong>of</strong> 0.3 on the scale in Fig. 3, which corresponded to<br />
-3 mW at the mixer. Reduced sensitivity to laser power<br />
drift is illustrated in Fig. 4. The bolometer detector mon-<br />
440 Rev. Sci. Instrum., Vol. 65, No. 2, February 1994 Relative reflectometry
sdev a523e-003<br />
var 7264~~005<br />
.----L---. 1 I I ,,--I<br />
2 4 6 -8 10<br />
LO Power (relatrve)<br />
lime (mnutes)<br />
FIG. 3. Receiver system noise temperature as a function <strong>of</strong> laser local<br />
oscillator power. Maximum relative power value 1.0 corresponds to - 10<br />
mW at the mixer.<br />
itoring the laser power shows it drifting upward during the<br />
33 min measurement time. The receiver signal, however,<br />
viewing the constant hot blackbody source during the same<br />
time is drifting upward by a far smaller amount. Rationing<br />
the signals with a laser power monitor, as previously done<br />
with direct laser probing,5 was not required with this reflectometer<br />
configuration.<br />
To determine the potential accuracy <strong>of</strong> this system for<br />
reflection measurements the sample wheel was held fixed<br />
FIG. 5. Raw data for measurements from a stationary gold mirror.<br />
These data are shown in Fig. 5. One hundred points<br />
make up each dataset. The mean <strong>of</strong> all three hundred data<br />
points is 0.9997, which is in error by 3~ 10m4 from the<br />
correct value <strong>of</strong> one. This error is consistent with the standard<br />
deviation <strong>of</strong> the total data set divided by the square<br />
root <strong>of</strong> the number <strong>of</strong> points as would be expected for<br />
random error.’ This error is also <strong>of</strong> the same order as the<br />
inverse <strong>of</strong> the signal-to-noise ratio as given by Eq, ( 1) .<br />
When the sample wheel is rotated and when the samples<br />
are changed, additional sources <strong>of</strong> error are introduced<br />
on a gold mirror and the data acquisition system took data due to realignment error. These sources <strong>of</strong> error could<br />
as though the sample wheel was cycling through four sam- eventually be engineered out <strong>of</strong> the instrument configuraples.<br />
The data system recorded the lock-in voltage in the tion, however, they were an important factor in the present<br />
order sample A-reference standard-sample B-sample C setup as illustrated in Fig. 6. The sample wheel had idenwith<br />
delay for sample rotation and five time constants be- tical gold-coated mirrors in positions A, C, and for the<br />
tween readings. The sample A-B-C readings were divided reference standard. A 303 stainless-steel sample with a<br />
by the reference reading. The resulting ratios should all be smooth machined surface was placed in position B. The<br />
equal to one since they are ratios <strong>of</strong> readings made on the gold reflectivities deviated from one by up to 0.3%. The<br />
same fixed mirror. The deviation from one is the error in reflectivity <strong>of</strong> the stainless steel was - <strong>1.1</strong>% less than the<br />
the system due to random fluctuations.<br />
gold mirrors. These results were reproducible for several<br />
..-<br />
F<br />
t.4,<br />
c*,<br />
5<br />
e<br />
.d<br />
d<br />
Time (mmutes)<br />
FIG. 4. Raw data and best linear fit to the bolometer laser power monitor<br />
and the heterodyne receiver signal from the 1000 “C blackbody.<br />
FIG, 6. Raw data and mean for rotating sample wheel measurements.<br />
Rev. Sci. Instrum., Vol. 65, No. 2, February 1994 Relative reflectometry 441
7<br />
2 3<br />
*<br />
4<br />
2.2<br />
N<br />
3 2<br />
'6 -<br />
22<br />
E % 1<br />
m<br />
0<br />
0 50 100 150 200<br />
Distance From Laser (cm)<br />
5 10<br />
Aperture Diameter (mm)<br />
FIG. 7. Calculated and measured I/h 214.5 pm laser beam radius propagating<br />
from the laser cavity output coupling hole.<br />
test rufls moving the various samples around the different<br />
samfile wheel positions.<br />
Using the dc conductivities for gold and 303 stainless<br />
steel, the reflectivity <strong>of</strong> the stainless steel should be 2.0%<br />
less than for gold at 214.5 pm. However, it has been shown<br />
that, the dc conductivity is not always accurate for determining<br />
the high-frequency performance <strong>of</strong> metal<br />
conductors.” Also our gold mirror which is a visibly thin<br />
coating <strong>of</strong> gold on glass may not be <strong>of</strong> high enough quality<br />
to give a true gold reference. It is important to note here<br />
that the reflectometer only provides a precision rdative<br />
reflection measurement that is only as good as the &owledge<br />
<strong>of</strong> the reference reflector.<br />
B. Spatial resolution<br />
It was initially thought that the spatial resolution<br />
would correspond to the focusability <strong>of</strong> the laser beam that<br />
illuminates the Schottky diode mixer. It turned out that<br />
the actual focusability <strong>of</strong> the receiver field-<strong>of</strong>-view in the<br />
present setup was approximately four times larger than<br />
this. This may be improved upon in the future because in<br />
the present experiment the coupling between the laser<br />
beam and Schottky diode mixer was not optimized, as<br />
pointed out above.<br />
The laser beam did propagate as a diffraction-limited<br />
Gaussian beam. This is shown in Fig. 7 where a number <strong>of</strong><br />
bolometer pr<strong>of</strong>ile scanned beam diameters are compared<br />
with calculations for propagation <strong>of</strong> a Gaussian beam.”<br />
One <strong>of</strong> the beam pr<strong>of</strong>iles was shown in Fig. 2.<br />
It was not possible to scan the receiver field-<strong>of</strong>-view<br />
pr<strong>of</strong>ile because a point source with sufficient signal strength<br />
was not available. Instead the field-<strong>of</strong>-view pr<strong>of</strong>ile was de<br />
termined by making the noise temperature measurement<br />
through a series <strong>of</strong> different round room-temperature apertures.<br />
Figure 8 shows the data for such a measurement<br />
made at the location <strong>of</strong> the test samples. As can be seen in<br />
these data, a Gaussian pr<strong>of</strong>ile was a good fit to the fall <strong>of</strong>f<br />
in signal as the apertures were decreased. Since the integral<br />
<strong>of</strong> a Gaussian is also a Gaussian, the receiver field-<strong>of</strong>-view<br />
442 Rev. Sci. Instrum., Vol. 65, No. 2, February 1994<br />
FIG. 8. Receiver field-<strong>of</strong>-view beam cross section measurements at the<br />
location <strong>of</strong> the test samples.<br />
envelope must also be Gaussian. However, this pr<strong>of</strong>ile measurement<br />
technique will not readily reveal higher-order<br />
structure in the pr<strong>of</strong>ile due to the possible presence <strong>of</strong><br />
higher-order, spatial modes.<br />
The measured l/e2 field-<strong>of</strong>-view diameter at the test:<br />
samples was - 10 mm, The smallest receiver field-<strong>of</strong>-viem<br />
spot <strong>of</strong> 5 mm was measured at the location <strong>of</strong> the hot<br />
blackbody at approximately the focal point <strong>of</strong> mirror M4..<br />
Figure 9 compares the propagation <strong>of</strong> the measured receiver<br />
field-<strong>of</strong>-view l/e* radius with a diffraction limitedi<br />
calculation assuming the laser beam is reflected from the<br />
Schottky diode mixer. The measured minimum spot sizes<br />
are about a factor <strong>of</strong> 4 larger than this calculation. Future<br />
improvements in the coupling between the Schottky diode<br />
and laser local oscillator may improve the focusability <strong>of</strong><br />
the receiver field <strong>of</strong> view.<br />
IV. SAMPLE MEASUREMENTS<br />
Measurements were made on a total <strong>of</strong> seven thin-film.<br />
superconductors. The reflectivity <strong>of</strong> all <strong>of</strong> these samples<br />
2.0<br />
----.--- GaussIan Beam Calculation<br />
_.----. ;------.--.-..----..-.,<br />
:<br />
,*“<br />
15 - ':<br />
*. ,,*'<br />
,.a'<br />
10 - '.<br />
:<br />
:<br />
,/'<br />
,*a'<br />
,,*'<br />
;<br />
;<br />
;-<br />
. ;-<br />
: :<br />
:<br />
:<br />
'-<br />
;-<br />
,:'<br />
\j _<br />
5- : . ,'<br />
T' 1<br />
I. ,,'<br />
*i _<br />
II ,/<br />
'\ ;y -<br />
.,'<br />
2 -<br />
0 L_L u .___ A .-IS I I 0 I t 1 -L-L-Lo<br />
30 60 YO 120<br />
Distance From Beam Splitter (cm)<br />
FIG. 9. Calculated and measured propagation <strong>of</strong> the receiver I/2 radius<br />
field <strong>of</strong> view from the beam splitter to the blackbody source.<br />
Relative reflectometry<br />
i
TABLE I. Summary on room-temperature measurements reflectivity relative<br />
to gold mirror.<br />
Sample No.<br />
YBC-34<br />
YBC-35<br />
Type<br />
Y-Ba-Cu-0 on LaAlOs<br />
Y-Ba-Cu-0 on LaAIOa<br />
Reflectivity<br />
0.9626 *to.0066<br />
0.9661 &O.C055<br />
23-4 Tl-Ba-Ca-Cu-0 on LaAIO,<br />
26-4 Tl-Ba-Ca-Cu-0 on LaAlO,<br />
0.8332*0.0126<br />
0.8596~0.0103<br />
LDO07<br />
LDOO9<br />
Y-Ba-Cu-0 on MgO<br />
Y-Ba-Cu-0 on LaA103<br />
0.8338*0.01565<br />
0.8380+0.01725<br />
Sample No. 2 Y-Ba-Cu-0 on MgO 0.4749*0.02156<br />
I L I I<br />
200 300<br />
Temperature (K)<br />
was measured at room temperature and four were cooled<br />
to cryogenic temperatures. The cryogenic measurements<br />
were limited to a minimum temperature <strong>of</strong> 91 K by the<br />
available Speac liquid-nitrogen Dewar.<br />
Table I summarizes the room-temperature measurements.<br />
The error shown corresponds to the standard deviation<br />
<strong>of</strong> each dataset <strong>of</strong> typically 25 or more measurements.<br />
There were deli&e differences among the different<br />
types <strong>of</strong> superconductor films and between the same film<br />
type but different fabrication run. The YBCO films<br />
YBG34 and YBC-35 on LaA103 substrates had a high<br />
room-temperature reflectivity <strong>of</strong> about 96%. The YBCO<br />
films LDOO7 and LDOO9, one on MgO and the other on a<br />
LaAlOs substrate, had a much lower room-temperature<br />
reflectivity <strong>of</strong> about 83%. The thallium films 23-4 and 26-4<br />
also had a low room-temperature reflectivity <strong>of</strong> about 83%<br />
and 86%. A very thin lilm on a MgO substrate (sample 2)<br />
had the lowest reflectivity <strong>of</strong> 47%.<br />
One <strong>of</strong> the samples (LDO09) arrived late in the experimental<br />
period after the room-temperature sample wheel<br />
setup was removed. Its room-temperature reflectivity was<br />
determined by placing it in the Dewar, then replacing it<br />
with a gold mirror, and finally replacing that with sample<br />
LDO07 which was previously measured in the sample<br />
wheel. The ability to do this reproducibly in the Dewar was<br />
difficult with previous direct laser measurements.’<br />
The cryogenic measurements were made on four <strong>of</strong> the<br />
samples, two YBCO films, YBC-34 and LDO07, and the<br />
two thallium films. The two YBCO films did not go<br />
through a superconducting transition because <strong>of</strong> the limits<br />
<strong>of</strong> the Dewar. The reflectivity <strong>of</strong> these samples was observed<br />
to only gradually increase a small amount as the<br />
temperature decreased from room to 91 K. The two thallium<br />
films were observed to go through a superconducting<br />
transition at about 110 K. Figure 10 shows the thallim data<br />
with 11 point smoothing. The increase in reflectivity <strong>of</strong><br />
sample 23-4 is larger, going from 83% to 89.6%. However,<br />
the higher retlectivity at 91 K is achieved by sample 26-4 <strong>of</strong><br />
9<strong>1.1</strong>% which implies that this sample had a higher conductivity.<br />
Since illumination <strong>of</strong> superconductors with highfrequency<br />
radiation above the band gap could reduce con-<br />
Rev. Sci. Instrum., Vol. 65, No. 2, February 1994<br />
FIG. 10. Reflectivity measurements <strong>of</strong> two thin-film thallium high T,<br />
superconductors as a function <strong>of</strong> temperature. Eleven point smooth data<br />
are shown.<br />
ductivity, a Teflon filter was inserted into the beam path<br />
between the hot blackbody source and the Dewar to further<br />
filter the near-infrared energy. No change in the reflectivity<br />
<strong>of</strong> sample 26-4 at 91 K was observed when this<br />
was done.<br />
V. DISCUSSION<br />
The present measurements have demonstrated that<br />
precision terahertz reflectometry using a blackbody source<br />
and a laser heterodyne receiver is possible for making surface<br />
resistivity measurements <strong>of</strong> good conductors. A number<br />
<strong>of</strong> improvements to the present instrumentation can<br />
significantly increase the precision <strong>of</strong> these measurements.<br />
These improvements would address the present limiting<br />
systematic and random sources <strong>of</strong> error. The systematic<br />
errors in the room-temperature setup can be reduced by a<br />
better engineered sample wheel for more reproducible sample<br />
alignment and to eliminate wobble on rotation, With<br />
this improvement measurement precision would be limited<br />
by random error which can be reduced by increasing the<br />
blackbody temperature and the receiver bandwidth. A<br />
mercury arc lamp could have an effective blackbody temperature<br />
as high as 4700 K (Ref. 12) and the receiver<br />
bandwidth could readily be increased to 10 GHz. With<br />
these improvements the signal-to-noise ratio could be increased<br />
by over an order <strong>of</strong> magnitude over the present<br />
results.<br />
ACKNOWLEDGMENT<br />
This work was supported by SIDO Innovative Science<br />
and Technology Office, Contract No. DASG60-92-C-0090.<br />
‘R. W. Ralston, M. A. Kastner, W. J. Gallagher, and B. Batlogg, IEEE<br />
Soectrum Auaust, 50 ( 1992).<br />
‘Special 1ssue;n Microwave Applications <strong>of</strong> Superconductivity, IEEE<br />
Trans. Microwave Theory and Technioues 39. Sentember (1991).<br />
L ,I .<br />
“S. Ramo, J. R. Whinnery, and T. Van Duzer, Fields and Waves in<br />
Communication Electronics, 2nd ed. (Wiley, New York, 1984), p. 291.<br />
‘D. R. Cohn, S. C. Han, P. P. Woskov, B. L. Zhou, A. Ferdinand, R. H.<br />
Relative reflectometry 443
Giles, J. Waldman, D. W. Cooke, and R. E. Muenchausen, J. Superconduct.<br />
5, 391 (1992)<br />
‘P. Woskov, D. R. Cohn, S. C. Han, R. H. Giles, and J. Waldman,<br />
Proceedings <strong>of</strong> the 15th International Conference on Infrared and Millimeter<br />
Waves, Lake Buena Vita, Florida, Dec. 10-14, 1990.<br />
‘E. N. Grossman, Infrared Phys. 29, 875 (1989).<br />
‘Trade mark <strong>of</strong> Emerson and Cuming for microwave absorbing material.<br />
‘H. Z. Cummings and H. L. Swinney, Progress Opt. 8, 135 (1970).<br />
‘P. R. Bevington, Data Reduction and Error Analysis for the Physical<br />
Sciences (McGraw-Hill, New York, 1969).<br />
“M. A. Ordal et aL, Appl. Opt. 24, 4493 (1985).<br />
“J. D. Gaskill, Linear Systems, Fourier Transforms, and Optics (Wiley,<br />
New York, 1978), Section 10-7.<br />
*‘E. R. Mueller, <strong>University</strong> <strong>of</strong> <strong>Massachusetts</strong>, <strong>Lowell</strong> (private communication).<br />
444 Rev. Sci. Instrum., Vol. 65, No. 2, February 1994 Relative reflectometry