Continental Airlines, Inc. 2009 Form 10-Q - United Airlines
Continental Airlines, Inc. 2009 Form 10-Q - United Airlines
Continental Airlines, Inc. 2009 Form 10-Q - United Airlines

Create successful ePaper yourself
Turn your PDF publications into a flip-book with our unique Google optimized e-Paper software.
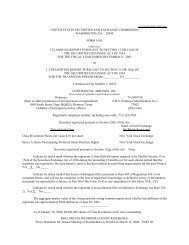
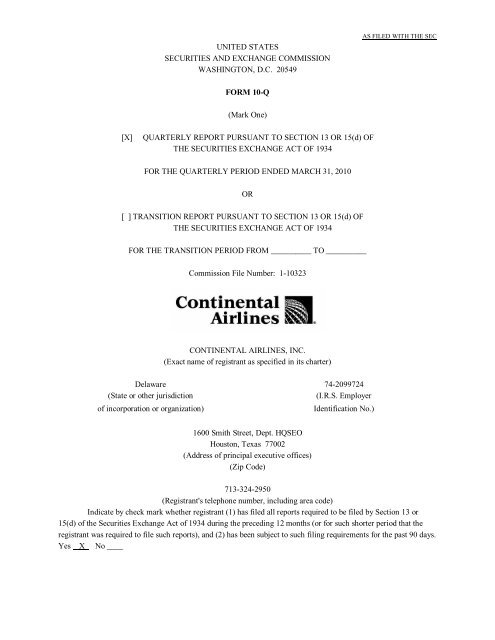
UNITED STATES<br />
SECURITIES AND EXCHANGE COMMISSION<br />
WASHINGTON, D.C. 20549<br />
AS FILED WITH THE SEC<br />
FORM <strong>10</strong>-Q<br />
(Mark One)<br />
[X]<br />
QUARTERLY REPORT PURSUANT TO SECTION 13 OR 15(d) OF<br />
THE SECURITIES EXCHANGE ACT OF 1934<br />
FOR THE QUARTERLY PERIOD ENDED MARCH 31, 20<strong>10</strong><br />
OR<br />
[ ] TRANSITION REPORT PURSUANT TO SECTION 13 OR 15(d) OF<br />
THE SECURITIES EXCHANGE ACT OF 1934<br />
FOR THE TRANSITION PERIOD FROM __________ TO __________<br />
Commission File Number: 1-<strong>10</strong>323<br />
CONTINENTAL AIRLINES, INC.<br />
(Exact name of registrant as specified in its charter)<br />
Delaware 74-2099724<br />
(State or other jurisdiction<br />
(I.R.S. Employer<br />
of incorporation or organization)<br />
Identification No.)<br />
1600 Smith Street, Dept. HQSEO<br />
Houston, Texas 77002<br />
(Address of principal executive offices)<br />
(Zip Code)<br />
713-324-2950<br />
(Registrant's telephone number, including area code)<br />
Indicate by check mark whether registrant (1) has filed all reports required to be filed by Section 13 or<br />
15(d) of the Securities Exchange Act of 1934 during the preceding 12 months (or for such shorter period that the<br />
registrant was required to file such reports), and (2) has been subject to such filing requirements for the past 90 days.<br />
Yes X No ____
Indicate by check mark whether the registrant has submitted electronically and posted on its corporate Web<br />
site, if any, every Interactive Data File required to be submitted and posted pursuant to Rule 405 of Regulation S-T<br />
(Section 232.405 of this chapter) during the preceding 12 months (or for such shorter period that the registrant was<br />
required to submit and post such files). Yes No _____<br />
Indicate by check mark whether the registrant is a large accelerated filer, an accelerated filer, a nonaccelerated<br />
filer or a smaller reporting company. See the definitions of "large accelerated filer,” “accelerated filer"<br />
and “smaller reporting company” in Rule 12b-2 of the Exchange Act.:<br />
Large accelerated filer<br />
Non-accelerated filer<br />
(Do not check if<br />
smaller reporting company)<br />
X<br />
_________<br />
Accelerated filer<br />
Smaller reporting company<br />
_________<br />
_________<br />
Indicate by check mark whether the registrant is a shell company (as defined in Rule 12b-2 of the Exchange<br />
Act). Yes No X<br />
As of April 21, 20<strong>10</strong>, 139,657,197 shares of Class B common stock of the registrant were outstanding.<br />
2
TABLE OF CONTENTS<br />
PAGE<br />
PART I<br />
FINANCIAL INFORMATION<br />
Item 1. Financial Statements -<br />
Consolidated Statements of Operations 4<br />
Consolidated Balance Sheets -<br />
Assets 5<br />
Liabilities and Stockholders' Equity 6<br />
Condensed Consolidated Statements of Cash Flows 7<br />
Notes to Consolidated Financial Statements 8<br />
Item 2.<br />
Management's Discussion and Analysis of Financial Condition<br />
and Results of Operations 24<br />
Item 3. Quantitative and Qualitative Disclosures about Market Risk 40<br />
Item 4. Controls and Procedures 40<br />
PART II<br />
OTHER INFORMATION<br />
Item 1. Legal Proceedings 42<br />
Item 1A. Risk Factors 42<br />
Item 2. Unregistered Sales of Equity Securities and Use of Proceeds 43<br />
Item 3. Defaults Upon Senior Securities 43<br />
Item 4. (Removed and Reserved) 43<br />
Item 5. Other Information 43<br />
Item 6. Exhibits 43<br />
Signatures 45<br />
Index to Exhibits 46<br />
3
PART I - FINANCIAL INFORMATION<br />
Item 1. Financial Statements.<br />
CONTINENTAL AIRLINES, INC.<br />
CONSOLIDATED STATEMENTS OF OPERATIONS<br />
(In millions, except per share data)<br />
Three Months Ended March 31,<br />
20<strong>10</strong> <strong>2009</strong><br />
(Unaudited)<br />
Operating Revenue:<br />
Passenger:<br />
Mainline $2,322 $2,198<br />
Regional 481 419<br />
Total Passenger Revenue 2,803 2,617<br />
Cargo <strong>10</strong>2 85<br />
Other 264 260<br />
Total Operating Revenue 3,169 2,962<br />
Operating Expenses:<br />
Aircraft fuel and related taxes 854 735<br />
Wages, salaries and related costs 796 765<br />
Aircraft rentals 229 237<br />
Landing fees and other rentals 213 209<br />
Regional capacity purchase, net 201 213<br />
Distribution costs 171 156<br />
Maintenance, materials and repairs 147 153<br />
Depreciation and amortization 134 111<br />
Passenger services 93 88<br />
Special charges <strong>10</strong> 4<br />
Other 372 346<br />
Total Operating Expenses 3,220 3,017<br />
Operating Loss (51 ) (55 )<br />
Nonoperating <strong>Inc</strong>ome (Expense):<br />
Interest expense (94) (93)<br />
Interest capitalized 7 8<br />
Interest income 2 4<br />
Other, net (<strong>10</strong>) -<br />
Total Nonoperating <strong>Inc</strong>ome (Expense) (95) (81)<br />
Loss before <strong>Inc</strong>ome Taxes (146 ) (136 )<br />
<strong>Inc</strong>ome Taxes - -<br />
Net Loss $(146 ) $(136 )<br />
Basic and Diluted Loss per Share $(1.05 ) $(1.<strong>10</strong> )<br />
Shares Used for Basic and Diluted Computation 139 123<br />
The accompanying Notes to Consolidated Financial Statements are an integral part of these statements.<br />
4
CONTINENTAL AIRLINES, INC.<br />
CONSOLIDATED BALANCE SHEETS<br />
(In millions, except for share data)<br />
March 31, December 31, March 31,<br />
ASSETS 20<strong>10</strong> <strong>2009</strong> <strong>2009</strong><br />
(Unaudited)<br />
(Unaudited)<br />
Current Assets:<br />
Cash and cash equivalents $ 2,861 $ 2,546 $ 2,2<strong>10</strong><br />
Short-term investments 292 3<strong>10</strong> 438<br />
Total unrestricted cash, cash equivalents and<br />
short-term investments 3,153 2,856 2,648<br />
Restricted cash, cash equivalents and short-term<br />
investments 164 164 173<br />
Accounts receivable, net 617 494 546<br />
Spare parts and supplies, net 277 254 229<br />
Deferred income taxes 205 203 170<br />
Prepayments and other 5<strong>10</strong> 402 617<br />
Total current assets 4,926 4,373 4,383<br />
Property and Equipment:<br />
Owned property and equipment:<br />
Flight equipment 8,764 8,769 8,583<br />
Other 1,807 1,787 1,727<br />
Flight equipment and other <strong>10</strong>,571 <strong>10</strong>,556 <strong>10</strong>,3<strong>10</strong><br />
Less: Accumulated depreciation 3,603 3,509 3,308<br />
Owned property and equipment, net 6,968 7,047 7,002<br />
Purchase deposits for flight equipment 298 242 246<br />
Capital leases 194 194 194<br />
Less: Accumulated amortization 65 63 56<br />
Capital leases, net 129 131 138<br />
Total property and equipment, net 7,395 7,420 7,386<br />
Routes and airport operating rights, net 774 778 801<br />
Other assets 223 2<strong>10</strong> 202<br />
Total Assets $13,318 $12,781 $12,772<br />
(continued on next page)<br />
5
CONTINENTAL AIRLINES, INC.<br />
CONSOLIDATED BALANCE SHEETS<br />
(In millions, except for share data)<br />
LIABILITIES AND<br />
STOCKHOLDERS' EQUITY<br />
March 31, December 31, March 31,<br />
20<strong>10</strong> <strong>2009</strong> <strong>2009</strong><br />
(Unaudited)<br />
(Unaudited)<br />
Current Liabilities:<br />
Current maturities of long-term debt and<br />
capital leases $ 919 $ 975 $ 578<br />
Accounts payable 969 924 948<br />
Air traffic and frequent flyer liability 2,473 1,855 2,192<br />
Accrued payroll 369 367 365<br />
Accrued other liabilities 338 268 565<br />
Total current liabilities 5,068 4,389 4,648<br />
Long-Term Debt and Capital Leases 5,272 5,291 5,360<br />
Deferred <strong>Inc</strong>ome Taxes 205 203 170<br />
Accrued Pension Liability 1,243 1,248 1,395<br />
Accrued Retiree Medical Benefits 221 216 236<br />
Other 812 844 8<strong>10</strong><br />
Commitments and Contingencies<br />
Stockholders' Equity:<br />
Class B common stock - $.01 par, 400,000,000 shares<br />
authorized; 139,357,186, 138,537,127 and<br />
123,531,752 issued 1 1 1<br />
Additional paid-in capital 2,228 2,216 2,043<br />
Accumulated deficit (588) (442) (296)<br />
Accumulated other comprehensive loss (1,144) (1,185) (1,595)<br />
Total stockholders' equity 497 590 153<br />
Total Liabilities and Stockholders' Equity $13,318 $12,781 $ 12,772<br />
The accompanying Notes to Consolidated Financial Statements are an integral part of these statements.<br />
6
CONTINENTAL AIRLINES, INC.<br />
CONDENSED CONSOLIDATED STATEMENTS OF CASH FLOWS<br />
(In millions)<br />
Three Months Ended March 31,<br />
20<strong>10</strong> <strong>2009</strong><br />
(Unaudited)<br />
Cash Flows from Operating Activities:<br />
Net loss $ (146) $ (136)<br />
Adjustments to reconcile net loss to net cash provided by operating<br />
activities:<br />
Depreciation and amortization 134 111<br />
Special charges <strong>10</strong> 4<br />
Stock-based compensation related to equity awards 2 1<br />
Other, net 1 17<br />
Changes in operating assets and liabilities 430 113<br />
Net cash provided by operating activities 431 1<strong>10</strong><br />
Cash Flows from Investing Activities:<br />
Capital expenditures (80) (86)<br />
Aircraft purchase deposits (paid) refunded, net (52) 27<br />
Proceeds from sales of short-term investments, net 24 41<br />
Proceeds from sales of property and equipment 24 5<br />
Decrease in restricted cash, cash equivalents and short-term investments - 17<br />
Other - (1)<br />
Net cash (used in) provided by investing activities (84) 3<br />
Cash Flows from Financing Activities:<br />
Payments on long-term debt and capital lease obligations (151) (98)<br />
Proceeds from issuance of long-term debt, net <strong>10</strong>9 26<br />
Proceeds from issuance of common stock pursuant to stock plans <strong>10</strong> 4<br />
Net cash used in financing activities (32) (68)<br />
Net <strong>Inc</strong>rease in Cash and Cash Equivalents 315 45<br />
Cash and Cash Equivalents - Beginning of Period 2,546 2,165<br />
Cash and Cash Equivalents - End of Period $2,861 $2,2<strong>10</strong><br />
Investing and Financing Activities Not Affecting Cash:<br />
Property and equipment acquired through the issuance of debt - $ 130<br />
The accompanying Notes to Consolidated Financial Statements are an integral part of these statements.<br />
7
CONTINENTAL AIRLINES, INC.<br />
NOTES TO CONSOLIDATED FINANCIAL STATEMENTS<br />
(UNAUDITED)<br />
In our opinion, the unaudited consolidated financial statements included herein contain all adjustments<br />
necessary to present fairly our financial position, results of operations and cash flows for the periods indicated.<br />
Such adjustments, other than nonrecurring adjustments that have been separately disclosed, are of a normal,<br />
recurring nature. We recorded $11 million of depreciation expense during the quarter ended March 31, 20<strong>10</strong> that<br />
relates to prior periods, the impact of which is not material to any individual prior period or our expected annual<br />
results for 20<strong>10</strong>.<br />
The accompanying consolidated financial statements should be read in conjunction with the consolidated<br />
financial statements and the notes thereto contained in our Annual Report on <strong>Form</strong> <strong>10</strong>-K for the year ended<br />
December 31, <strong>2009</strong> (the "<strong>2009</strong> <strong>Form</strong> <strong>10</strong>-K"). Due to seasonal fluctuations common to the airline industry, our<br />
results of operations for the periods presented are not necessarily indicative of the results of operations to be<br />
expected for the entire year. As used in these Notes to Consolidated Financial Statements, the terms "<strong>Continental</strong>,"<br />
"we," "us," "our" and similar terms refer to <strong>Continental</strong> <strong>Airlines</strong>, <strong>Inc</strong>. and, unless the context indicates otherwise, its<br />
consolidated subsidiaries.<br />
NOTE 1 – ADOPTED AND RECENTLY ISSUED ACCOUNTING PRONOUNCEMENTS<br />
Variable Interest Entities. In June <strong>2009</strong>, the Financial Accounting Standards Board (“FASB”) issued<br />
guidance to change financial reporting by enterprises involved with variable interest entities (“VIEs”). The standard<br />
replaces the quantitative-based risks and rewards calculation for determining which enterprise has a controlling<br />
financial interest in a VIE with an approach focused on identifying which enterprise has the power to direct the<br />
activities of a VIE and the obligation to absorb losses of the entity or the right to receive the entity’s residual returns.<br />
This accounting standard became effective for us on January 1, 20<strong>10</strong>. The adoption of this pronouncement did not<br />
have any effect on our consolidated financial statements.<br />
Revenue Arrangements with Multiple Deliverables. In October <strong>2009</strong>, the FASB issued guidance that<br />
changes the accounting for revenue arrangements with multiple deliverables. The guidance requires an entity to<br />
allocate consideration at the inception of an arrangement to all of its deliverables based on their relative selling<br />
prices and eliminates the use of the residual method of allocation. The guidance establishes a hierarchy for<br />
determining the selling price of a deliverable, based on vendor-specific objective evidence, third-party evidence or<br />
estimated selling price. In addition, this guidance expands required disclosures related to a vendor’s multipledeliverable<br />
revenue arrangements. This accounting standard is effective for us on January 1, 2011 and may change<br />
our accounting for the sale of frequent flyer mileage credits. We may elect to adopt this guidance through either<br />
prospective application for revenue arrangements entered into, or materially modified, after the effective date or<br />
retrospective application to all applicable revenue arrangements for all periods presented. We are currently<br />
evaluating the requirements of this pronouncement and have not determined the impact, if any, that adoption of this<br />
standard will have on our consolidated financial statements.<br />
NOTE 2 – LOSS PER SHARE<br />
Because we incurred a net loss in the three months ended March 31, 20<strong>10</strong> and <strong>2009</strong>, basic and diluted loss<br />
per share for each period were calculated as our net loss divided by the weighted average shares outstanding.<br />
Approximately 24 million and 13 million potential shares of our common stock related to convertible debt securities<br />
8
were excluded from the computation of diluted loss per share in the three months ended March 31, 20<strong>10</strong> and <strong>2009</strong>,<br />
respectively, because they were antidilutive. In addition, approximately eight million weighted average options to<br />
purchase shares of our common stock were excluded from the computation of diluted loss per share for the three<br />
months ended March 31, 20<strong>10</strong> and <strong>2009</strong> because the effect of including the options would have been antidilutive.<br />
NOTE 3 – FLEET INFORMATION<br />
As of March 31, 20<strong>10</strong>, our operating fleet consisted of 333 mainline jets and 253 regional aircraft. The 333<br />
mainline jets are operated exclusively by us, while the 253 regional aircraft are operated on our behalf by other<br />
operators under capacity purchase agreements.<br />
We own or lease 274 regional jets. Of these, 208 are leased or subleased to ExpressJet <strong>Airlines</strong>, <strong>Inc</strong>.<br />
(“ExpressJet”) and operated on our behalf under a capacity purchase agreement with ExpressJet, 41 are subleased to<br />
other operators but are not operated on our behalf and 25 are temporarily grounded. Additionally, our regional<br />
operating fleet includes 45 regional jet and turboprop aircraft owned or leased by third parties that are operated on<br />
our behalf by other operators under capacity purchase agreements.<br />
The following table summarizes our operating fleet (aircraft operated by us and by others on our behalf) as<br />
of March 31, 20<strong>10</strong>:<br />
Third-Party<br />
Aircraft Type Total Owned Leased Aircraft<br />
Mainline (a):<br />
777-200ER 20 8 12 -<br />
767-400ER 16 14 2 -<br />
767-200ER <strong>10</strong> 9 1 -<br />
757-300 20 9 11 -<br />
757-200 41 15 26 -<br />
737-900ER 30 30 - -<br />
737-900 12 8 4 -<br />
737-800 117 44 73 -<br />
737-700 36 12 24 -<br />
737-500 31 - 31 -<br />
Total mainline 333 149 184 -<br />
Regional (b):<br />
ERJ-145XR 89 - 89 -<br />
ERJ-145 134 18 <strong>10</strong>1 15 (c)<br />
Q400 14 - - 14 (d)<br />
Q200 16 - - 16 (e)<br />
Total regional 253 18 190 45<br />
Total 586 167 374 45<br />
_______________________<br />
9
(a)<br />
(b)<br />
(c)<br />
(d)<br />
(e)<br />
Excludes eight grounded Boeing 737-500 aircraft (two owned and six leased) and eight grounded owned<br />
Boeing 737-300 aircraft. Also excludes one leased 757-300 aircraft delivered but not yet placed into service.<br />
Excludes 25 ERJ-135 aircraft that are temporarily grounded and 15 ERJ-145XR aircraft, 21 ERJ-145 aircraft<br />
and five ERJ-135 aircraft that are subleased to other operators, but are not operated on our behalf.<br />
Operated by Chautauqua <strong>Airlines</strong>, <strong>Inc</strong>. (“Chautauqua”) under a capacity purchase agreement.<br />
Operated by Colgan Air, <strong>Inc</strong>. (“Colgan”) under a capacity purchase agreement.<br />
Operated by Champlain Enterprises, <strong>Inc</strong>. (“CommutAir”) under a capacity purchase agreement.<br />
Substantially all of the aircraft and engines we own are subject to mortgages.<br />
Mainline Fleet Activity. During the first quarter of 20<strong>10</strong>, we placed into service two leased Boeing 757-<br />
300 aircraft. An additional leased Boeing 757-300 aircraft will be placed into service in April 20<strong>10</strong>. We removed<br />
three Boeing 737-500 aircraft and three Boeing 737-300 aircraft from service during the first quarter of 20<strong>10</strong>. We<br />
have no Boeing 737-300 aircraft remaining in our operating fleet as of March 31, 20<strong>10</strong>.<br />
Regional Fleet Activity. In December <strong>2009</strong>, we agreed with ExpressJet to amend our capacity purchase<br />
agreement to permit ExpressJet to fly eight ERJ-145 aircraft for another carrier under a capacity purchase<br />
agreement. These eight aircraft are subleased from us and were previously flown for us under our capacity purchase<br />
agreement. As of March 31, 20<strong>10</strong>, six of these aircraft had been removed from service for us. The remaining two<br />
aircraft will be removed from service for us during the second quarter of 20<strong>10</strong>. The subleases have an average<br />
initial term of two and one-half years.<br />
Firm Order and Option Aircraft. As of March 31, 20<strong>10</strong>, we had firm commitments to purchase 86 new<br />
aircraft (58 Boeing 737 aircraft, three Boeing 777 aircraft and 25 Boeing 787 aircraft) scheduled for delivery from<br />
20<strong>10</strong> through 2016, with an estimated aggregate cost of $5.1 billion including related spare engines. In addition to<br />
our firm order aircraft, we had options to purchase a total of 98 additional Boeing aircraft as of March 31, 20<strong>10</strong>.<br />
We are currently scheduled to take delivery of two Boeing 777 aircraft and 12 Boeing 737 aircraft through<br />
the end of 20<strong>10</strong>. Due to issues arising out of the governmental certification process used by the manufacturer of the<br />
coach seats on the Boeing 777 aircraft and the coach and first class seats on the Boeing 737 aircraft scheduled for<br />
delivery this year, we have incurred delays and expect to continue to incur delays of up to six months for most of the<br />
aircraft scheduled for delivery in 20<strong>10</strong>. While this seat manufacturer also provided the seats installed on most of the<br />
Boeing aircraft currently in our fleet, we do not believe these issues will have a material impact on our ability to<br />
continue to operate any of the aircraft in our fleet based on information currently available to us.<br />
NOTE 4 – FINANCIAL INSTRUMENTS AND FAIR VALUE MEASUREMENTS<br />
Accounting rules for fair value clarify that fair value is an exit price, representing the price that would be<br />
received to sell an asset or paid to transfer a liability in an orderly transaction between market participants based on<br />
the highest and best use of the asset or liability. As such, fair value is a market-based measurement that should be<br />
determined based on assumptions that market participants would use in pricing an asset or liability. FASB<br />
Accounting Standards Codification (“ASC”) Topic 820 requires us to use valuation techniques to measure fair value<br />
that maximize the use of observable inputs and minimize the use of unobservable inputs. These inputs are<br />
prioritized as follows:<br />
Level 1:<br />
Level 2:<br />
Observable inputs such as quoted prices for identical assets or liabilities in active markets<br />
Other inputs that are observable directly or indirectly, such as quoted prices for similar assets<br />
<strong>10</strong>
Level 3:<br />
or liabilities or market-corroborated inputs<br />
Unobservable inputs for which there is little or no market data and which require us to develop<br />
our own assumptions about how market participants would price the assets or liabilities<br />
The valuation techniques that may be used to measure fair value are as follows:<br />
(A)<br />
(B)<br />
(C)<br />
Market approach – Uses prices and other relevant information generated by market transactions<br />
involving identical or comparable assets or liabilities<br />
<strong>Inc</strong>ome approach – Uses valuation techniques to convert future amounts to a single present<br />
amount based on current market expectations about those future amounts, including present value<br />
techniques, option-pricing models and excess earnings method<br />
Cost approach – Based on the amount that currently would be required to replace the service<br />
capacity of an asset (replacement cost)<br />
Assets (liabilities) measured at fair value on a recurring basis include (in millions):<br />
Carrying Amount Level 1 Level 2 Level 3<br />
Valuation<br />
Technique<br />
March 31, 20<strong>10</strong><br />
Cash and cash equivalents $2,861 $2,861 $- $ - (A)<br />
Short-term investments:<br />
Auction rate securities 164 - - 164 (B)<br />
CDARS 82 82 - - (A)<br />
Asset-backed securities 46 46 - - (A)<br />
Restricted cash, cash equivalents and<br />
short-term investments 164 164 - - (A)<br />
Auction rate securities put right 16 - - 16 (B)<br />
Fuel derivatives:<br />
Swaps 24 - - 24 (A)<br />
Call options 14 - - 14 (A)<br />
Foreign currency forward contracts 4 - 4 - (A)<br />
December 31, <strong>2009</strong><br />
Cash and cash equivalents $2,546 $2,546 $- $ - (A)<br />
Short-term investments:<br />
Auction rate securities 201 - - 201 (B)<br />
CDARS <strong>10</strong>2 <strong>10</strong>2 - - (A)<br />
Asset-backed securities 7 7 - - (A)<br />
Restricted cash, cash equivalents and<br />
short-term investments 164 164 - - (A)<br />
Auction rate securities put right 20 - - 20 (B)<br />
Fuel derivatives:<br />
Swaps 6 - - 6 (A)<br />
Call options 8 - - 8 (A)<br />
Foreign currency forward contracts 5 - 5 - (A)<br />
11
Carrying Amount Level 1 Level 2 Level 3<br />
Valuation<br />
Technique<br />
March 31, <strong>2009</strong><br />
Cash and cash equivalents $2,2<strong>10</strong> $2,2<strong>10</strong> $- $ - (A)<br />
Short-term investments:<br />
Auction rate securities 229 - - 229 (B)<br />
CDARS 189 189 - - (A)<br />
Asset-backed securities 20 20 - - (A)<br />
Restricted cash, cash equivalents and<br />
short-term investments 173 173 - - (A)<br />
Auction rate securities put right 26 - - 26 (B)<br />
Fuel derivatives:<br />
Swaps 2 - - 2 (A)<br />
Collars (254) - - (254) (A)<br />
Foreign currency forward contracts 5 - 5 - (A)<br />
The determination of fair value of each of these items is discussed below:<br />
Cash, Cash Equivalents and Restricted Cash. Cash, cash equivalents and restricted cash consist primarily<br />
of U.S. Government and Agency money market funds and other AAA-rated money market funds with original<br />
maturities of three months or less. The original cost of these assets approximates fair value due to their short-term<br />
maturity.<br />
Short-Term Investments Other than Auction Rate Securities. Short-term investments other than auction<br />
rate securities primarily consist of certificates of deposit placed through an account registry service (“CDARS”) and<br />
automobile and equipment loan-related asset-backed securities. The fair values of these investments are based on<br />
observable market data.<br />
Student Loan-Related Auction Rate Securities. At March 31, 20<strong>10</strong>, we held student loan-related auction<br />
rate securities with a fair value of $164 million and a par value of $209 million. These securities were classified as<br />
follows (in millions):<br />
Fair Value Par Value Amortized Cost<br />
Short-term investments:<br />
Available-for-sale $117 $145 $116<br />
Trading 47 64 N/A<br />
Total $164 $209<br />
These securities are variable-rate debt instruments with contractual maturities generally greater than ten<br />
years and whose interest rates are reset every seven, 28 or 35 days, depending on the terms of the particular<br />
instrument. These securities are secured by pools of student loans guaranteed by state-designated guaranty agencies<br />
and reinsured by the U.S. government. All of the auction rate securities we hold are senior obligations under the<br />
applicable indentures authorizing the issuance of the securities. We estimated the fair value of these securities to be<br />
$164 million at March 31, 20<strong>10</strong>, taking into consideration the limited sales and offers to purchase such securities<br />
12
and using internally-developed models of the expected future cash flows related to the securities. Our models<br />
incorporated our probability-weighted assumptions about the cash flows of the underlying student loans and<br />
discounts to reflect a lack of liquidity in the market for these securities.<br />
In addition, in 2008, one institution granted us a put right permitting us in 20<strong>10</strong> to sell to the institution at<br />
their full par value certain auction rate securities. The institution has also committed to loan us 75% of the market<br />
value of these securities at any time until the put right is exercised. As of March 31, 20<strong>10</strong>, we held auction rate<br />
securities with a par value of $64 million that were subject to the put right. The put right is recorded at fair value in<br />
prepayments and other assets on our consolidated balance sheet. We determined the fair value based on the<br />
difference between the risk-adjusted discounted expected cash flows from the underlying auction rate securities<br />
without the put right and with the put right being exercised in 20<strong>10</strong>. We have classified the underlying auction rate<br />
securities as trading securities and elected the fair value option under the Fair Value Subsections of ASC Topic 825-<br />
<strong>10</strong>, “Financial Instruments,” for the put right, with changes in the fair value of the put right and the underlying<br />
auction rate securities recognized in other non-operating income (expense) currently.<br />
During the first quarter of 20<strong>10</strong>, we sold, at par, auction rate securities having a par value of $42 million.<br />
Certain of these auction rate securities were subject to the put right discussed above. We recognized gains on the<br />
sales using the specific identification method and recorded losses on the cancellation of any related put rights. The<br />
net gains are included in other non-operating income (expense) in our consolidated statement of operations and were<br />
not material.<br />
We continue to monitor the market for auction rate securities and consider its impact, if any, on the fair<br />
value of our investments. If current market conditions deteriorate further, we may be required to record additional<br />
losses on these securities.<br />
Fuel Derivatives. We determine the fair value of our fuel derivatives by obtaining inputs from a broker's<br />
pricing model that is based on inputs that are either readily available in public markets or can be derived from<br />
information available in publicly quoted markets. We verify the reasonableness of these inputs by comparing the<br />
resulting fair values to similar quotes from our counterparties as of each date for which financial statements are<br />
prepared. For derivatives not covered by collateral, we also make an adjustment to incorporate credit risk into the<br />
valuation. Due to the fact that certain of the inputs utilized to determine the fair value of the fuel derivatives are<br />
unobservable (principally volatility of crude oil prices and the credit risk adjustments), we have categorized these<br />
option contracts as Level 3.<br />
Foreign Currency Forward Contracts. We determine the fair value of our foreign currency derivatives by<br />
comparing our contract rate to a published forward price of the underlying currency, which is based on market rates<br />
for comparable transactions.<br />
13
Unobservable Inputs. The reconciliation of our assets (liabilities) measured at fair value on a recurring<br />
basis using unobservable inputs (Level 3) is as follows (in millions):<br />
Auction<br />
Fuel Derivatives<br />
Rate Securities Put Right Swaps Call Options Collars<br />
Three Months Ended March 31, 20<strong>10</strong><br />
Balance at beginning of period $201 $20 $ 6 $ 8 $ -<br />
Purchases, sales, issuances and<br />
settlements (net) (42) - (4) 12 -<br />
Gains and losses:<br />
Reported in earnings:<br />
Realized 6 (5) - - -<br />
Unrealized - 1 - - -<br />
Reported in other comprehensive<br />
income (loss) (1) - 22 (6) -<br />
Balance as of March 31, 20<strong>10</strong> $164 $16 $24 $14 $ -<br />
Three Months Ended March 31, <strong>2009</strong><br />
Balance at beginning of period $229 $26 $ 2 $ 1 $(418 )<br />
Purchases, sales, issuances and<br />
settlements (net) - - 5 (1) 190<br />
Gains and losses:<br />
Reported in earnings:<br />
Realized - - - - -<br />
Unrealized - - - - (2)<br />
Reported in other comprehensive<br />
income (loss) - - (5) - (24)<br />
Balance as of March 31, <strong>2009</strong> $229 $26 $ 2 $ - $(254 )<br />
Other Financial Instruments. Other financial instruments that are not subject to the disclosure requirements<br />
of ASC Topic 820 are as follows:<br />
• Debt. The fair value of our debt with a carrying value of $6.0 billion at March 31, 20<strong>10</strong> was approximately<br />
$5.9 billion. These estimates were based on either market prices or the discounted amount of future cash<br />
flows using our current incremental rate of borrowing for similar liabilities.<br />
• Accounts Receivable and Accounts Payable. The fair values of accounts receivable and accounts payable<br />
approximated carrying value due to their short-term maturity.<br />
NOTE 5 - HEDGING ACTIVITIES<br />
As part of our risk management program, we use a variety of derivative financial instruments to help<br />
manage our risks associated with changes in fuel prices and foreign currency exchange rates. We do not hold or<br />
issue derivative financial instruments for trading purposes.<br />
14
We are exposed to credit losses in the event of non-performance by issuers of derivative financial<br />
instruments. To manage credit risks, we select issuers based on credit ratings, limit our exposure to any one issuer<br />
under our defined guidelines and monitor the market position with each counterparty.<br />
Fuel Price Risk Management. We routinely hedge a portion of our future fuel requirements, provided the<br />
hedges are expected to be cost effective. We have historically entered into swap agreements, purchased call options<br />
or costless collar arrangements to protect us against sudden and significant increases in jet fuel prices. We typically<br />
conduct our fuel hedging activities using a combination of crude oil, jet fuel and heating oil contracts. We strive to<br />
maintain fuel hedging levels and exposure generally comparable to that of our major competitors, so that our fuel<br />
cost is not disproportionate to theirs.<br />
As of March 31, 20<strong>10</strong>, our projected consolidated fuel requirements for the remainder of 20<strong>10</strong> and the first<br />
quarter of 2011 were hedged as follows:<br />
% of<br />
Expected<br />
Consumption<br />
Maximum Price<br />
Weighted<br />
Average Price<br />
(per gallon)<br />
% of<br />
Expected<br />
Consumption<br />
Minimum Price<br />
Weighted<br />
Average Price<br />
(per gallon)<br />
Remainder of 20<strong>10</strong><br />
WTI crude oil swaps <strong>10</strong> % $1.83 <strong>10</strong> % $1.83<br />
WTI crude oil call options 14 $2.25 N/A N/A<br />
Total 24 % <strong>10</strong> %<br />
First Quarter of 2011<br />
WTI crude oil call options 2 % $2.33 N/A N/A<br />
We account for our fuel derivatives as cash flow hedges and record them at fair value in our consolidated<br />
balance sheet with the change in fair value, to the extent effective, being recorded to accumulated other<br />
comprehensive income (loss) (“accumulated OCI”), net of applicable income taxes. Fuel hedge gains (losses) are<br />
recognized as a component of fuel expense when the underlying fuel hedged is used. The ineffective portion of our<br />
fuel hedges is determined based on the correlation between jet fuel and crude oil or heating oil prices and is included<br />
in nonoperating income (expense) in our consolidated statement of operations.<br />
When our fuel hedges are in a liability position, we may be required to post cash collateral with our<br />
counterparties. We were not required to post any such collateral at March 31, 20<strong>10</strong> or December 31, <strong>2009</strong>. At<br />
March 31, <strong>2009</strong>, we had posted cash collateral with our counterparties totaling $168 million and granted a lien in<br />
favor of a counterparty on one Boeing 777-200 aircraft in lieu of posting an additional $63 million in cash. The cash<br />
collateral is reported in prepayments and other current assets in our consolidated balance sheet.<br />
Foreign Currency Exchange Risk Management. We have historically used foreign currency average rate<br />
options and forward contracts to hedge against the currency risk associated with our forecasted Japanese yen, British<br />
pound, Canadian dollar and euro-denominated cash flows. The average rate options and forward contracts have<br />
only nominal intrinsic value at the date contracted. At March 31, 20<strong>10</strong>, we had forward contracts outstanding to<br />
hedge 34% of our projected Japanese yen-denominated cash inflows, primarily from passenger ticket sales, through<br />
20<strong>10</strong>.<br />
15
We account for these instruments as cash flow hedges. They are recorded at fair value in our consolidated<br />
balance sheet with the offset to accumulated OCI, net of applicable income taxes and hedge ineffectiveness, and are<br />
recognized as passenger revenue in the month of sale. We measure hedge effectiveness of average rate options and<br />
forward contracts based on the forward price of the underlying currency. Hedge ineffectiveness, if any, is included<br />
in other nonoperating income (expense) in our consolidated statement of operations.<br />
Quantitative Disclosures. All of our derivative instruments were designated as cash flow hedges and were<br />
reported in our consolidated balance sheet as follows (in millions):<br />
March 31,<br />
20<strong>10</strong><br />
Asset Derivatives (1) Liability Derivatives (2)<br />
December 31, March 31, March 31, December 31,<br />
<strong>2009</strong> <strong>2009</strong><br />
20<strong>10</strong> <strong>2009</strong><br />
March 31,<br />
<strong>2009</strong><br />
Fuel derivatives $38 $14 $ - $ - $ - $252<br />
Foreign currency<br />
derivatives 4 5 5 - - -<br />
Total derivatives $42 $19 $ 5 $ - $ - $252<br />
____________________<br />
(1) Amounts are included in prepayments and other current assets.<br />
(2) Amounts are included in accrued other current liabilities.<br />
The gains and losses related to our derivative instruments reported in our consolidated balance sheet at the<br />
indicated dates and our consolidated statement of operations for the three months ended March 31 were as follows<br />
(in millions):<br />
Cash Flow<br />
Hedges<br />
March 31,<br />
20<strong>10</strong><br />
Gain (Loss) Recognized in<br />
OCI (Effective Portion)<br />
December 31,<br />
<strong>2009</strong><br />
Gain (Loss) Reclassified<br />
from Accumulated OCI<br />
into <strong>Inc</strong>ome<br />
(Effective Portion) (1)<br />
Gain (Loss) Recognized in<br />
<strong>Inc</strong>ome (Ineffective Portion) (2)<br />
March 31,<br />
<strong>2009</strong> 20<strong>10</strong> <strong>2009</strong> 20<strong>10</strong> <strong>2009</strong><br />
Fuel derivatives $16 $36 $(29 ) $4 $(141 ) $- $(2 )<br />
Foreign currency<br />
derivatives - <strong>10</strong> 12 - (1) - -<br />
Total $16 $46 $(17 ) $4 $(142 ) $- $(2 )<br />
____________________<br />
(1) Amounts related to fuel derivatives are included in aircraft fuel and related taxes and amounts related to<br />
foreign currency derivatives are included in passenger revenue.<br />
(2) Amounts are included in other nonoperating income (expense).<br />
16
NOTE 6 - COMPREHENSIVE INCOME (LOSS)<br />
Total comprehensive income (loss) for the three months ended March 31 included the following (in<br />
millions):<br />
20<strong>10</strong> <strong>2009</strong><br />
Net loss $(146 ) $(136 )<br />
Other comprehensive income (loss) adjustments, before tax:<br />
Derivative financial instruments:<br />
Reclassification into earnings (4) 144<br />
Change in fair value 16 (17)<br />
Employee benefit plans:<br />
Amortization of net actuarial losses 21 27<br />
Amortization of prior service cost 8 7<br />
Comprehensive income (loss) adjustments, before tax 41 161<br />
<strong>Inc</strong>ome taxes related to items of other comprehensive income (loss) - -<br />
Total comprehensive income (loss) $(<strong>10</strong>5 ) $ 25<br />
NOTE 7 – STOCK-BASED COMPENSATION AND EMPLOYEE BENEFIT PLANS<br />
Profit Based RSU Awards. In February 20<strong>10</strong>, we issued 1.4 million profit based restricted stock unit (“RSUs”)<br />
awards, which can result in cash payments to our officers upon the achievement of specified profit sharing-based<br />
performance targets. The performance period for these awards is January 1, 20<strong>10</strong> through December 31, 2012. These<br />
awards have cumulative profit sharing performance targets ranging from $4 million to $120 million and payment<br />
percentages ranging from 25% to 200%. The cash hurdle associated with these awards is $2.2 billion. These awards<br />
were issued pursuant to our <strong>Inc</strong>entive Plan 20<strong>10</strong>, which is subject to stockholder approval at our annual meeting of<br />
stockholders to be held on June 9, 20<strong>10</strong>. Accordingly, we recognized no expense related to the awards in the three<br />
months ended March 31, 20<strong>10</strong>.<br />
Stock-Based Compensation Expense. Total stock-based compensation expense (credit) included in wages,<br />
salaries and related costs for the three months ended March 31, 20<strong>10</strong> and <strong>2009</strong> was $9 million and $(24) million,<br />
respectively. As of March 31, 20<strong>10</strong>, $3 million of compensation cost attributable to future service related to unvested<br />
employee stock options had not yet been recognized. This amount will be recognized in expense over a weightedaverage<br />
period of 1.3 years.<br />
17
Defined Benefit Pension and Retiree Medical Plans. Net periodic defined benefit pension and retiree<br />
medical benefits expense for the three months ended March 31 included the following components (in millions):<br />
Defined<br />
Benefit Pension<br />
Retiree<br />
Medical Benefits<br />
20<strong>10</strong> <strong>2009</strong> 20<strong>10</strong> <strong>2009</strong><br />
Service cost $ 16 $16 $ 3 $ 3<br />
Interest cost 40 38 3 4<br />
Expected return on plan assets (28) (22) - -<br />
Amortization of unrecognized net actuarial<br />
(gain) loss 22 28 (1) (1)<br />
Amortization of prior service cost 3 2 5 5<br />
Net periodic benefit expense $ 53 $62 $<strong>10</strong> $ 11<br />
During the first quarter of 20<strong>10</strong>, we contributed $34 million to our tax-qualified defined benefit pension<br />
plans and on April 8, 20<strong>10</strong> we contributed an additional $40 million to the plans. Our remaining minimum funding<br />
requirements during calendar year 20<strong>10</strong> are approximately $50 million.<br />
Defined Contribution Plans. Our defined contribution 401(k) employee savings plans cover substantially<br />
all employees. Company matching contributions are made in cash. Total expense for all defined contribution plans,<br />
including two pilot-only plans, was $26 million and $25 million for the three months ended March 31, 20<strong>10</strong> and<br />
<strong>2009</strong>, respectively.<br />
NOTE 8 - SPECIAL CHARGES<br />
Special charges for the three months ended March 31 were as follows (in millions):<br />
20<strong>10</strong> <strong>2009</strong><br />
Aircraft-related charges, net $ 6 $ 4<br />
Severance 4 -<br />
Total special charges $<strong>10</strong> $ 4<br />
The special charges all relate to our mainline segment unless otherwise noted.<br />
In the first quarter of 20<strong>10</strong>, we recorded $6 million of aircraft-related charges related to grounded Boeing<br />
737-300 aircraft, which is net of gains on the sale of two Boeing 737-500 aircraft to a foreign buyer.<br />
During the first quarter of 20<strong>10</strong>, we announced plans to eliminate 600 reservation positions due to a<br />
continued decline in the number of customers calling our reservation center. We also announced plans to eliminate<br />
150 ground handling workers at seven cities served by our regional operations where ground handling functions will<br />
be performed by third parties. We recorded a charge of $4 million for severance and other costs in connection with<br />
these reductions in force and furloughs, including $2 million related to our regional operations.<br />
In the first quarter of <strong>2009</strong>, we recorded a $4 million charge for future lease costs and return conditions on<br />
a permanently grounded Boeing 737-300 aircraft.<br />
18
Accrual Activity. Activity related to the accruals for severance and associated continuing medical coverage<br />
costs and future lease payments on unused facilities is as follows (in millions):<br />
Severance/<br />
Medical Costs<br />
Unused<br />
Facilities<br />
Balance, December 31, <strong>2009</strong> $14 $26<br />
Accrual 4 -<br />
Payments (5) (1)<br />
Balance, March 31, 20<strong>10</strong> $13 $25<br />
Cash payments related to the accruals for severance and associated continuing medical coverage costs will<br />
be made through the third quarter of 2011. Remaining lease payments on unused facilities will be made through<br />
2018.<br />
NOTE 9 - INCOME TAXES<br />
Our effective tax rates differ from the federal statutory rate of 35% primarily due to the following: changes<br />
in the valuation allowance, expenses that are not deductible for federal income tax purposes and state income taxes.<br />
We are required to provide a valuation allowance for our deferred tax assets in excess of deferred tax liabilities<br />
because we have concluded that it is more likely than not that such deferred tax assets will ultimately not be<br />
realized. As a result, our pre-tax losses for the first quarter of 20<strong>10</strong> were not reduced by any tax benefit.<br />
Section 382 of the Internal Revenue Code ("Section 382") imposes limitations on a corporation's ability to<br />
utilize NOLs if it experiences an "ownership change." In general terms, an ownership change may result from<br />
transactions increasing the ownership of certain stockholders in the stock of a corporation by more than 50<br />
percentage points over a three-year period. In the event of an ownership change, utilization of our NOLs would be<br />
subject to an annual limitation under Section 382 determined by multiplying the value of our stock at the time of the<br />
ownership change by the applicable long-term tax-exempt rate (which is 4.03% for March 20<strong>10</strong>). Any unused<br />
annual limitation may be carried over to later years. The amount of the limitation may, under certain circumstances,<br />
be increased by the built-in gains in assets held by us at the time of the change that are recognized in the five-year<br />
period after the change. If we were to have an ownership change as of March 31, 20<strong>10</strong> under current conditions, our<br />
annual NOL utilization could be limited to $123 million per year, before consideration of any built-in gains.<br />
NOTE <strong>10</strong> - SEGMENT REPORTING<br />
We have two reportable segments: mainline and regional. The mainline segment consists of flights using<br />
larger jets while the regional segment currently consists of flights with a capacity of 79 or fewer seats. As of March<br />
31, 20<strong>10</strong>, the regional segment was operated by ExpressJet, Chautauqua, CommutAir and Colgan through capacity<br />
purchase agreements.<br />
We evaluate segment performance based on several factors, of which the primary financial measure is<br />
operating income (loss). However, we do not manage our business or allocate resources based on segment operating<br />
profit or loss because (1) our flight schedules are designed to maximize revenue from passengers flying, (2) many<br />
operations of the two segments are substantially integrated (for example, airport operations, sales and marketing,<br />
scheduling and ticketing) and (3) management decisions are based on their anticipated impact on the overall<br />
network, not on one individual segment.<br />
19
Financial information for the three months ended March 31 by business segment is set forth below (in<br />
millions):<br />
20<strong>10</strong> <strong>2009</strong><br />
Operating Revenue:<br />
Mainline $2,676 $2,529<br />
Regional 493 433<br />
Total Consolidated $3,169 $2,962<br />
Operating <strong>Inc</strong>ome (Loss):<br />
Mainline $ 23 $ 63<br />
Regional (74) (118)<br />
Total Consolidated $ (51) $ (55)<br />
Net Loss:<br />
Mainline $ (69) $ (15)<br />
Regional (77) (121)<br />
Total Consolidated $(146 ) $(136 )<br />
The amounts in the table above are presented on the basis of how our management reviews segment results.<br />
Under this basis, the regional segment's revenue includes a pro-rated share of our ticket revenue for segments flown<br />
by regional carriers and expenses include all activity related to the regional operations, regardless of whether the<br />
costs were paid directly by us or to the regional carriers.<br />
NOTE 11 - COMMITMENTS AND CONTINGENCIES<br />
Aircraft Purchase Commitments. As of March 31, 20<strong>10</strong>, we had firm commitments to purchase 86 new<br />
aircraft (58 Boeing 737 aircraft, three Boeing 777 aircraft and 25 Boeing 787 aircraft) scheduled for delivery from<br />
20<strong>10</strong> through 2016, with an estimated aggregate cost of $5.1 billion including related spare engines. We are<br />
currently scheduled to take delivery of two Boeing 777 aircraft and 12 Boeing 737 aircraft through the end of 20<strong>10</strong>.<br />
In addition to our firm order aircraft, we had options to purchase a total of 98 additional Boeing aircraft as of March<br />
31, 20<strong>10</strong>.<br />
We have obtained financing for the two Boeing 777 aircraft and nine of the Boeing 737 aircraft to be<br />
delivered in 20<strong>10</strong>, provided that they are delivered by August 31, 20<strong>10</strong>. We expect the 11 aircraft to be delivered by<br />
such date. However, we do not have backstop financing or any other financing currently in place for the balance of<br />
the Boeing aircraft on order. Further financing will be needed to satisfy our capital commitments for our firm<br />
aircraft and other related capital expenditures. We can provide no assurance that backstop financing or any other<br />
financing not already in place for our aircraft deliveries will be available to us when needed on acceptable terms or<br />
at all. Since the commitments for firm order aircraft are non-cancelable, and assuming no breach of the agreement<br />
by Boeing, if we are unable to obtain financing and cannot otherwise satisfy our commitment to purchase these<br />
aircraft, the manufacturer could exercise its rights and remedies under applicable law, such as seeking to terminate<br />
the contract for a material breach, selling the aircraft to one or more other parties and suing us for damages to<br />
recover any resulting losses incurred by the manufacturer.<br />
Financings and Guarantees. We are the guarantor of approximately $1.7 billion in aggregate principal<br />
amount of tax-exempt special facilities revenue bonds and interest thereon, excluding the US Airways contingent<br />
20
liability described below. These bonds, issued by various airport municipalities, are payable solely from our rentals<br />
paid under long-term agreements with the respective governing bodies. The leasing arrangements associated with<br />
approximately $1.5 billion of these obligations are accounted for as operating leases, and the leasing arrangements<br />
associated with approximately $190 million of these obligations are accounted for as capital leases.<br />
We are contingently liable for US Airways' obligations under a lease agreement between US Airways and<br />
the Port Authority of New York and New Jersey related to the East End Terminal at LaGuardia airport. These<br />
obligations include the payment of ground rentals to the Port Authority and the payment of other rentals in respect of<br />
the full amounts owed on special facilities revenue bonds issued by the Port Authority having an outstanding par<br />
amount of $<strong>10</strong>9 million at March 31, 20<strong>10</strong> and a final scheduled maturity in 2015. If US Airways defaults on these<br />
obligations, we would be obligated to cure the default and we would have the right to occupy the terminal after US<br />
Airways' interest in the lease had been terminated.<br />
We also had letters of credit and performance bonds relating to various real estate, customs, and aircraft<br />
financing obligations at March 31, 20<strong>10</strong> in the amount of $<strong>10</strong>8 million. These letters of credit and performance<br />
bonds have expiration dates through April 2014.<br />
General Guarantees and Indemnifications. We are the lessee under many real estate leases. It is common in<br />
such commercial lease transactions for us as the lessee to agree to indemnify the lessor and other related third parties for<br />
tort liabilities that arise out of or relate to our use or occupancy of the leased premises and the use or occupancy of the<br />
leased premises by regional carriers operating flights on our behalf. In some cases, this indemnity extends to related<br />
liabilities arising from the negligence of the indemnified parties, but usually excludes any liabilities caused by their gross<br />
negligence or willful misconduct. Additionally, we typically indemnify such parties for any environmental liability that<br />
arises out of or relates to our use of the leased premises.<br />
In our aircraft financing agreements, we typically indemnify the financing parties, trustees acting on their behalf<br />
and other related parties against liabilities that arise from the manufacture, design, ownership, financing, use, operation<br />
and maintenance of the aircraft and for tort liability, whether or not these liabilities arise out of or relate to the negligence<br />
of these indemnified parties, except for their gross negligence or willful misconduct.<br />
We expect that we would be covered by insurance (subject to deductibles) for most tort liabilities and related<br />
indemnities described above with respect to real estate we lease and aircraft we operate.<br />
In our financing transactions that include loans, we typically agree to reimburse lenders for any reduced returns<br />
with respect to the loans due to any change in capital requirements and, in the case of loans in which the interest rate is<br />
based on the London Interbank Offered Rate (“LIBOR”), for certain other increased costs that the lenders incur in<br />
carrying these loans as a result of any change in law, subject in most cases to certain mitigation obligations of the<br />
lenders. At March 31, 20<strong>10</strong>, we had $1.4 billion of floating rate debt and $272 million of fixed rate debt, with remaining<br />
terms of up to ten years, that is subject to these increased cost provisions. In several financing transactions involving<br />
loans or leases from non-U.S. entities, with remaining terms of up to ten years and an aggregate carrying value of $1.5<br />
billion, we bear the risk of any change in tax laws that would subject loan or lease payments thereunder to non-U.S.<br />
entities to withholding taxes, subject to customary exclusions.<br />
We may be required to make future payments under the foregoing indemnities and agreements due to unknown<br />
variables related to potential government changes in capital adequacy requirements, laws governing LIBOR based loans<br />
or tax laws, the amounts of which cannot be estimated at this time.<br />
21
Credit Card Processing Agreement. The covenants contained in our domestic bank-issued credit card<br />
processing agreement with Chase Bank USA, N.A. (“Chase”) require that we post additional cash collateral if we<br />
fail to maintain (1) a minimum level of unrestricted cash, cash equivalents and short-term investments, (2) a<br />
minimum ratio of unrestricted cash, cash equivalents and short-term investments to current liabilities of 0.25 to 1.0<br />
or (3) a minimum senior unsecured debt rating of at least Caa3 and CCC- from Moody’s and Standard & Poor’s,<br />
respectively.<br />
Under the terms of our credit card processing agreement with American Express, if a covenant trigger<br />
under the Chase processing agreement requires us to post additional collateral under that agreement, we would be<br />
required to post additional collateral under the American Express processing agreement. The amount of additional<br />
collateral required under the American Express processing agreement would be based on a percentage of the value<br />
of unused tickets (for travel at a future date) purchased by customers using the American Express card. The<br />
percentage for purposes of this calculation is the same as the percentage applied under the Chase processing<br />
agreement, after taking into account certain other risk protection maintained by American Express.<br />
Under these processing agreements and based on our current air traffic liability exposure (as defined in<br />
each agreement), we would be required to post collateral up to the following amounts if we failed to comply with the<br />
covenants described above:<br />
• a total of $72 million if our unrestricted cash, cash equivalents and short-term investments balance falls<br />
below $2.0 billion;<br />
• a total of $222 million if we fail to maintain the minimum unsecured debt ratings specified above;<br />
• a total of $422 million if our unrestricted cash, cash equivalents and short-term investments balance (plus<br />
any collateral posted at Chase) falls below $1.4 billion or if our ratio of unrestricted cash, cash equivalents<br />
and short-term investments to current liabilities falls below 0.25 to 1.0; and<br />
• a total of $921 million if our unrestricted cash, cash equivalents and short-term investments balance (plus<br />
any collateral posted at Chase) falls below $1.0 billion or if our ratio of unrestricted cash, cash equivalents<br />
and short-term investments to current liabilities falls below 0.22 to 1.0.<br />
The amounts shown above are incremental to the current collateral we have posted with these companies.<br />
We are currently in compliance with all of the covenants under these processing agreements.<br />
Credit Ratings. At March 31, 20<strong>10</strong>, our senior unsecured debt was rated B3 by Moody’s and CCC+ by<br />
Standard & Poor’s. These ratings are significantly below investment grade. Due to our current credit ratings, our<br />
borrowing costs are higher and our financing options are more limited than borrowers with investment grade credit<br />
ratings. Additional downgrades in our credit ratings could further increase our borrowing costs and reduce the<br />
availability of financing to us in the future. We do not have any debt obligations that would be accelerated as a<br />
result of a credit rating downgrade. However, as discussed above, we would have to post additional collateral of<br />
approximately $222 million under our Chase and American Express processing agreements if our senior unsecured<br />
debt rating were to fall below Caa3 as rated by Moody’s or CCC- as rated by Standard & Poor’s. The insurer under<br />
our workers’ compensation program has the right to require us to post up to $32 million of additional collateral<br />
under a number of conditions, including based on our current senior unsecured debt rating, which is currently at the<br />
minimum of B3 as rated by Moody’s and below the minimum of B- as rated by Standard & Poor’s. We could also<br />
be required to post a higher amount of collateral with our fuel hedge counterparties if our credit ratings were to fall,<br />
or if our unrestricted cash, cash equivalents and short-term investments balance fell below certain specified levels,<br />
and our fuel hedges were in a liability position. In such a case, the total amount of the collateral that we might be<br />
required to post at any time would be up to the amount of our liability to our respective counterparties under the<br />
related derivative instruments. Our fuel hedging agreement with one counterparty also requires us to post additional<br />
22
collateral of up to <strong>10</strong>% of the notional amount of our hedging contracts with that counterparty if our senior<br />
unsecured debt rating by Moody’s or Standard & Poor’s is below B3 or B-, respectively. Our fuel derivative<br />
contracts do not contain any other credit risk-related contingent features, other than those related to a change in<br />
control.<br />
Employees. As of March 31, 20<strong>10</strong>, we had approximately 41,385 employees. Due to the number of part-time<br />
employees and adjusting for overtime, we had an average of 39,365 full-time equivalent employees for the three months<br />
ended March 31, 20<strong>10</strong>. <strong>Inc</strong>luding the fleet service employees discussed below, approximately 60% of our full-time<br />
equivalent employees are represented by unions.<br />
On February 12, 20<strong>10</strong>, the National Mediation Board informed us that our fleet service employees had voted in<br />
favor of representation by the International Brotherhood of Teamsters (Teamsters). The election covers approximately<br />
7,600 employees, or 6,340 full-time equivalent ramp, operations and cargo agents. We will negotiate a collective<br />
bargaining agreement with the Teamsters covering our fleet service employees.<br />
On March 18, 20<strong>10</strong>, we announced that we had reached a tentative agreement on a new four-year labor contract<br />
with the Transport Workers Union (“TWU”) that represents our dispatchers, which agreement our dispatchers ratified on<br />
April 20, 20<strong>10</strong>.<br />
Most of our collective bargaining agreements are currently amendable or become amendable in 20<strong>10</strong>. The<br />
collective bargaining agreements with our pilots, mechanics and certain other work groups became amendable in<br />
December 2008 and those with our flight attendants and CMI mechanics became amendable in December <strong>2009</strong>. With<br />
respect to our workgroups with amendable contracts, we have been meeting with representatives of the applicable unions<br />
to negotiate amended collective bargaining agreements with a goal of reaching agreements that are fair to us and to our<br />
employees. We cannot predict the outcome of our ongoing negotiations with our unionized workgroups, although<br />
significant increases in the pay and benefits resulting from new collective bargaining agreements could have a material<br />
adverse effect on us. Furthermore, there can be no assurance that our generally good labor relations and high labor<br />
productivity will continue.<br />
Environmental Matters. At March 31, 20<strong>10</strong>, we had an accrual for estimated costs of environmental<br />
remediation throughout our system of $30 million, based primarily on third-party environmental studies and<br />
estimates as to the extent of the contamination and nature of the required remedial actions. We have evaluated and<br />
recorded this accrual for environmental remediation costs separately from any related insurance recovery. We did<br />
not have any receivables related to environmental insurance recoveries at March 31, 20<strong>10</strong>. Based on currently<br />
available information, we believe that our accrual for potential environmental remediation costs is adequate,<br />
although our accrual could be adjusted in the future due to new information or changed circumstances. However,<br />
we do not expect these items to materially affect our results of operations, financial condition or liquidity. We are<br />
continuing environmental remediation of jet fuel contamination on and near our aircraft maintenance hangar<br />
leasehold in Los Angeles, which began in 2005 under a work plan approved by the Los Angeles Regional Water<br />
Quality Control Board and our landlord, Los Angeles World Airports. Solvent contamination also exists on and<br />
near this site and, if we were found responsible for this contamination and environmental remediation were required,<br />
we could incur additional costs.<br />
Legal Proceedings. During the period between 1997 and 2001, we reduced or capped the base<br />
commissions that we paid to domestic travel agents, and in 2002 we eliminated those base commissions. These<br />
actions were similar to those also taken by other air carriers. We are a defendant, along with several other air<br />
carriers, in two lawsuits brought by travel agencies that purportedly opted out of a prior class action entitled Sarah<br />
Futch Hall d/b/a Travel Specialists v. <strong>United</strong> Air Lines, et al. (U.S.D.C., Eastern District of North Carolina), filed on<br />
23
June 21, 2000, in which the defendant airlines prevailed on summary judgment that was upheld on appeal. These<br />
similar suits against <strong>Continental</strong> and other major carriers allege violations of antitrust laws in reducing and<br />
ultimately eliminating the base commissions formerly paid to travel agents and seek unspecified money damages<br />
and certain injunctive relief under the Clayton Act and the Sherman Anti-Trust Act. The pending cases, which<br />
currently involve a total of 90 travel agency plaintiffs, are Tam Travel, <strong>Inc</strong>. v. Delta Air Lines, <strong>Inc</strong>., et al. (U.S.D.C.,<br />
Northern District of California), filed on April 9, 2003 and Swope Travel Agency, et al. v. Orbitz LLC et al.<br />
(U.S.D.C., Eastern District of Texas), filed on June 5, 2003. By order dated November <strong>10</strong>, 2003, these actions were<br />
transferred and consolidated for pretrial purposes by the Judicial Panel on Multidistrict Litigation to the Northern<br />
District of Ohio. On October 29, 2007, the judge for the consolidated lawsuit dismissed the case for failure to meet<br />
the heightened pleading standards established earlier in 2007 by the U.S. Supreme Court’s decision in Bell Atlantic<br />
Corp. v. Twombly. On October 2, <strong>2009</strong>, the U.S. Court of Appeals for the Sixth Circuit affirmed the trial court’s<br />
dismissal of the case. On December 18, <strong>2009</strong>, the plaintiffs’ request for rehearing by the Sixth Circuit en banc was<br />
denied. On March 18, 20<strong>10</strong>, the plaintiffs filed a Petition for a Writ of Certiorari with the U.S. Supreme Court. The<br />
plaintiffs in the Swope lawsuit, encompassing 43 travel agencies, have also alleged that certain claims raised in their<br />
lawsuit were not, in fact, dismissed. The trial court has not yet ruled on that issue. In the consolidated lawsuit, we<br />
believe the plaintiffs’ claims are without merit, and we intend to defend vigorously any appeal. Nevertheless, a final<br />
adverse court decision awarding substantial money damages could have a material adverse effect on our results of<br />
operations, financial condition or liquidity.<br />
We and/or certain of our subsidiaries are defendants in various other pending lawsuits and proceedings and<br />
are subject to various other claims arising in the normal course of our business, many of which are covered in whole<br />
or in part by insurance. Although the outcome of these lawsuits and proceedings (including the probable loss we<br />
might experience as a result of an adverse outcome) cannot be predicted with certainty at this time, we believe, after<br />
consulting with outside counsel, that the ultimate disposition of such suits will not have a material adverse effect on<br />
us.<br />
Item 2. Management's Discussion and Analysis of Financial Condition and Results of Operations.<br />
This quarterly report on <strong>Form</strong> <strong>10</strong>-Q contains forward-looking statements that are not limited to historical<br />
facts, but reflect our current beliefs, expectations or intentions regarding future events. All forward-looking<br />
statements involve risks and uncertainties that could cause actual results to differ materially from those in the<br />
forward-looking statements. For examples of such risks and uncertainties, please see the risk factors set forth in<br />
Part I, Item 1A. “Risk Factors” in our Annual Report on <strong>Form</strong> <strong>10</strong>-K for the year ended December 31, <strong>2009</strong> (the<br />
“<strong>2009</strong> <strong>Form</strong> <strong>10</strong>-K”) and in our reports and registration statements filed from time to time with the Securities and<br />
Exchange Commission (“SEC”), which identify important matters such as the potential for significant volatility in<br />
the cost of aircraft fuel, the consequences of our high leverage and other significant capital commitments, our high<br />
labor and pension costs, delays in scheduled aircraft deliveries, service interruptions at one of our hub airports,<br />
disruptions to the operations of our regional operators, disruptions in our computer systems, and industry<br />
conditions, including continuing weakness in the U.S. and global economies, the airline pricing environment,<br />
terrorist attacks, regulatory matters, excessive taxation, industry consolidation and airline alliances, the availability<br />
and cost of insurance, public health threats and the seasonal nature of the airline business. We undertake no<br />
obligation to publicly update or revise any forward-looking statements to reflect events or circumstances that may<br />
arise after the date of this report, except as required by applicable law.<br />
24
OVERVIEW<br />
We are a major <strong>United</strong> States air carrier engaged in the business of transporting passengers, cargo and mail.<br />
We are the world's fifth largest airline as measured by the number of scheduled miles flown by revenue passengers<br />
in <strong>2009</strong>. <strong>Inc</strong>luding our wholly-owned subsidiary, <strong>Continental</strong> Micronesia, <strong>Inc</strong>. ("CMI"), and regional flights<br />
operated on our behalf under capacity purchase agreements with other carriers, we operate more than 2,200 daily<br />
departures. As of March 31, 20<strong>10</strong>, we flew to 118 domestic and 125 international destinations and offered<br />
additional connecting service through alliances with domestic and foreign carriers.<br />
General information about us can be found on our website, continental.com. Electronic copies of our<br />
annual reports on <strong>Form</strong> <strong>10</strong>-K, quarterly reports on <strong>Form</strong> <strong>10</strong>-Q and current reports on <strong>Form</strong> 8-K, as well as any<br />
amendments to those reports, are available free of charge through our website as soon as reasonably practicable after<br />
we file them with, or furnish them to, the SEC.<br />
We recorded a net loss of $146 million for the three months ended March 31, 20<strong>10</strong>, as compared to a net<br />
loss of $136 million for the three months ended March 31, <strong>2009</strong>. Our net loss in both periods was primarily due to<br />
weakness in demand resulting from the global recession. Excluding special items, we recorded a net loss of $136<br />
million for the three months ended March 31, 20<strong>10</strong>, compared to a net loss of $132 million for the three months<br />
ended March 31, <strong>2009</strong>. Net loss excluding special items is significant because it provides management and<br />
investors the ability to measure and monitor our performance on a consistent basis. Special items relate to activities<br />
that are not central to our ongoing operations or are unusual in nature. A reconciliation of our net loss to the non-<br />
GAAP financial measure of net loss excluding special items is provided at the end of this Item.<br />
First Quarter Financial Highlights<br />
• Passenger revenue and cargo revenue increased 7.1% and 20.0%, respectively, during the first quarter of 20<strong>10</strong><br />
as compared to the first quarter of <strong>2009</strong> primarily due to increasing demand resulting from improving<br />
economic conditions.<br />
• We recorded an operating loss of $51 million during the first quarter of 20<strong>10</strong> as compared to an operating loss<br />
of $55 million in the first quarter of <strong>2009</strong>, due primarily to weakness in demand resulting from the global<br />
recession.<br />
• Unrestricted cash, cash equivalents and short-term investments totaled $3.2 billion at March 31, 20<strong>10</strong>.<br />
First Quarter Operational Highlights<br />
• Consolidated traffic increased 5.7% and capacity remained essentially flat during the first quarter of 20<strong>10</strong> as<br />
compared to the first quarter of <strong>2009</strong>, resulting in a record first quarter load factor of 79.5%.<br />
• We recorded a U.S. Department of Transportation (“DOT”) on-time arrival rate of 78.4% for <strong>Continental</strong><br />
mainline flights and a mainline segment completion factor of 98.3% for the first quarter of 20<strong>10</strong>, compared to a<br />
DOT on-time arrival rate of 76% and a mainline segment completion factor of 99.2% for the first quarter of<br />
<strong>2009</strong>. Our operating results for the first quarter of 20<strong>10</strong> were adversely impacted by severe winter weather,<br />
particularly at our New York hub at Newark Liberty International Airport during February.<br />
25
• We began to offer customers the option of purchasing premium seat assignments for unreserved economy-class<br />
seats with extra legroom and announced plans to offer food for purchase in the economy cabin on select flights<br />
to U.S., Canadian and Latin American destinations beginning in fall 20<strong>10</strong>.<br />
Outlook<br />
• We completed the installation of flat-bed seats on seven of our Boeing 777 aircraft and four of our Boeing 757-<br />
200 aircraft.<br />
The severe global economic recession significantly diminished the demand for air travel beginning in the<br />
fourth quarter of 2008 and disrupted the global capital markets, resulting in a difficult financial environment for U.S.<br />
network carriers. Although we have seen some indications that the airline industry may be experiencing the early<br />
stages of a recovery, we cannot predict how quickly or fully demand for air travel will recover, and continued<br />
weakness in such demand would hinder our ability to achieve and sustain profitability. Moreover, we continue to<br />
experience significant volatility in jet fuel prices, which rose to an 18 month high in April 20<strong>10</strong>. Higher fuel prices<br />
will also impair our ability to achieve and sustain profitability if we are unable in the current economic environment<br />
to raise fares or other fees sufficiently to offset fully our increased costs.<br />
Set forth below is a discussion of the principal matters that we believe could currently impact our financial<br />
and operating performance outlook and cause our results of operations in future periods to differ materially from our<br />
historical operating results and/or from our anticipated results of operations described in our forward-looking<br />
statements.<br />
Economic Conditions. The severe economic recession in the U.S. and global economies had a significant<br />
negative impact on the demand for air carrier services beginning in the fourth quarter of 2008. Passenger revenue in<br />
<strong>2009</strong> for U.S. airlines, as reported by the Air Transport Association of America, declined 18% compared to 2008.<br />
The decline in demand for air travel in 2008 and <strong>2009</strong> disproportionately reduced the volume of high-yield traffic, as<br />
many business travelers either curtailed their travel or purchased lower yield economy tickets. Although recent<br />
improvements in corporate bookings and revenue trends suggest that the airline industry may be experiencing the<br />
early stages of a recovery, we cannot predict how quickly or fully demand for air travel will recover. If global<br />
economic conditions fail to improve or worsen, resulting in continuing demand weakness and reduced revenues, we<br />
may be unable to offset the reduced revenues fully through further cost and capacity reductions or other measures.<br />
In addition to its effect on demand for our services, the global economic recession severely disrupted the<br />
global capital markets, resulting in a diminished availability of financing and higher cost for financing that was<br />
obtainable. Although access to the capital markets has improved over the past several months, if economic<br />
conditions again worsen or these markets experience further disruptions, we may be unable to obtain financing on<br />
acceptable terms (or at all) to refinance certain maturing debt we would normally expect to refinance and to satisfy<br />
future capital commitments.<br />
Fuel Costs. Fuel costs have been very volatile in recent years and have been increasing in 20<strong>10</strong>, reaching an 18<br />
month high in April 20<strong>10</strong>. Our average consolidated (mainline and regional) jet fuel price per gallon including related<br />
taxes increased to $2.15 in the first quarter of 20<strong>10</strong> from $1.82 in the first quarter of <strong>2009</strong>. If fuel prices continue to rise<br />
significantly, we may be unable to raise fares or other fees sufficiently to offset fully our increased costs.<br />
In an effort to address the risk of rising fuel prices, we routinely hedge a portion of our fuel requirements.<br />
However, a precipitous decline in crude oil prices, as experienced during the second half of 2008, may result in<br />
significant costs to us in cases where our hedging arrangements obligate us to make payments to the counterparties to the<br />
26
extent that the price of crude falls below the applicable agreed-upon amounts. As of March 31, 20<strong>10</strong>, we have hedged<br />
24% of an expected fuel requirements for the remainder of 20<strong>10</strong>.<br />
Based on our expected fuel consumption in 20<strong>10</strong>, a one dollar change in the price of a barrel of crude oil would<br />
change our annual fuel expense by approximately $40 million, assuming no changes to the refining margins and our fuel<br />
hedging program. We believe that our modern, fuel-efficient fleet continues to provide us with a competitive advantage<br />
relative to our peers and a long-term hedge against rising fuel prices.<br />
Industry Consolidation. We are facing stronger competition from carriers that have participated in industry<br />
consolidation, including as a result of the merger of Delta and Northwest in 2008, which changed the competitive<br />
environment for us and the airline industry. Further consolidation could adversely affect our competitive position,<br />
as our competitors have the opportunity through consolidation to significantly expand the reach of their networks,<br />
which is of primary importance to business travelers, and to achieve cost reductions by eliminating redundancy in<br />
their operations. In addition, if <strong>United</strong> were to merge with another carrier, it could threaten the antitrust immunity<br />
granted to us by the DOT. Although we cannot predict whether any consolidation transactions will occur, we<br />
regularly review our strategic options and will act in the best interests of our stockholders, employees, customers<br />
and the communities we serve.<br />
Revenue-Generating and Cost Saving Measures. We are implementing a number of measures to raise revenues<br />
and reduce costs. During the first quarter of 20<strong>10</strong> we began to offer customers the option of purchasing premium seat<br />
assignments for unreserved economy-class seats with extra legroom and we announced that we will begin to offer food<br />
for purchase in the economy cabin on select flights to U.S., Canadian and Latin American destinations.<br />
Going forward, we intend to offer for purchase additional products and services relating to air travel that will<br />
permit customers to select product offerings that they wish to consume and pay for, and decline other product offerings<br />
that they do not wish to consume or pay for. Some of the new product and service offerings will represent enhanced<br />
choice among various attributes of our current product, and others will represent new product or service offerings. The<br />
revenue that we derive from these products and services, which is generally referred to as ancillary revenue, typically has<br />
higher margins than that of our core product and is an important element of our strategy to return to profitability and<br />
sustain that profitability.<br />
Additionally, we will continue to invest in technology designed to assist customers with self-service. We<br />
believe that many of our customers desire more control over their travel experience, and wish to use tools that will permit<br />
them to do so through all phases of travel, from pre-purchase to post-flight. We will also invest in technology designed<br />
to help us make better operational decisions and more efficiently assist customers at airports, while lowering our<br />
operating costs.<br />
During the first quarter of 20<strong>10</strong>, we announced plans to eliminate 600 reservation positions due to a continued<br />
decline in the number of customers calling our reservation center. We also announced plans to eliminate 150 ground<br />
handling workers at seven cities served by our regional operations where ground handling functions will be performed<br />
by third parties.<br />
Capacity. We expect only modest capacity growth for 20<strong>10</strong>, with our consolidated and mainline capacity to<br />
increase between 0.5% and 1.5%, with mainline domestic capacity down 0.5% to 1.5% and mainline international<br />
capacity increasing between 2.0% and 3.0%. The international increase is primarily due to the run-rate of international<br />
routes added in <strong>2009</strong> and the restoration of our full schedule to Mexico following our capacity reduction in <strong>2009</strong> related<br />
to the H1N1 virus.<br />
27
Our future ability to grow our capacity could be adversely impacted by manufacturer delays in aircraft<br />
deliveries. Due to issues arising out of the governmental certification process used by the manufacturer of the coach<br />
seats on the Boeing 777 aircraft and the coach and first class seats on the Boeing 737 aircraft scheduled for delivery this<br />
year, we have incurred delays and expect to continue to incur delays of up to six months for most of the aircraft<br />
scheduled for delivery in 20<strong>10</strong>. We currently expect the first of our 25 Boeing 787 aircraft to be delivered in the second<br />
half of 2011.<br />
Star Alliance. On October 27, <strong>2009</strong>, we joined Star Alliance and implemented code-sharing and reciprocity of<br />
frequent flier programs, elite customer recognition and airport lounge use with <strong>United</strong>, Lufthansa, Air Canada and other<br />
Star Alliance members.<br />
On July <strong>10</strong>, <strong>2009</strong>, the DOT approved our application to join <strong>United</strong> and a group of eight other carriers within<br />
Star Alliance that already hold antitrust immunity. This approval enables us, <strong>United</strong> and these other immunized Star<br />
Alliance carriers to work closely together to deliver highly competitive international flight schedules, fares and service<br />
and provides competitive balance to antitrust-immunized carriers in SkyTeam. Additionally, we, <strong>United</strong>, Lufthansa and<br />
Air Canada have received final DOT approval to establish a trans-Atlantic joint venture to create a more efficient and<br />
comprehensive trans-Atlantic network for our respective customers, offering those customers more service, scheduling<br />
and pricing options and establishing a framework for similar joint ventures in other regions of the world. The DOT’s<br />
approval of antitrust immunity is subject to certain conditions and limitations that are not expected to diminish materially<br />
the benefits of our participation in Star Alliance or the trans-Atlantic joint venture. On December 23, <strong>2009</strong>, we, <strong>United</strong><br />
and ANA filed an application with the DOT for antitrust immunity to enable the three carriers to establish a trans-Pacific<br />
joint venture, offering similar benefits to our trans-Pacific customers. We are seeking a modification to our pilot<br />
collective bargaining agreement to permit us to engage in revenue sharing with a domestic air carrier, which is a<br />
component of the proposed joint ventures.<br />
The full implementation of some of the arrangements relating to Star Alliance requires the approval of domestic<br />
and foreign regulatory agencies. These agencies may deny us necessary approvals, delay certain approvals or, in<br />
connection with granting any such approvals, impose requirements, limitations or costs on us or on other Star Alliance<br />
members, or require us or them to divest slots, gates, routes or other assets. In certain cases, such actions could prevent<br />
us from consummating the transactions contemplated by our alliance agreements.<br />
Closure of European Airspace. In April 20<strong>10</strong>, the volcanic ash from an eruption in Iceland necessitated the<br />
closing of a significant portion of the airspace over Europe, denying airlines access to most of Europe’s largest airports<br />
for several days. As a result of this eruption and the closure of European airspace, airlines serving affected airports<br />
cancelled tens of thousands of flights and, according to the International Air Transport Association, lost in excess of<br />
$200 million per day in total revenue. Although this eruption had a disproportionately larger impact on European<br />
carriers, including several of our Star Alliance partners, we estimate that our revenues were reduced by approximately<br />
$24 million through April 21, 20<strong>10</strong> due to our cancellation of hundreds of flights. Further eruptions by this Icelandic<br />
volcano or others having a similar effect could have a material adverse effect on us directly, due to lost revenue from<br />
flight cancellations, and indirectly, as a result of flight cancellations or similar actions taken by other members of Star<br />
Alliance.<br />
Labor Costs. Our ability to achieve and sustain profitability also depends on continuing our efforts to<br />
implement and maintain a more competitive cost structure. On February 12, 20<strong>10</strong>, the National Mediation Board<br />
informed us that our fleet service employees had voted in favor of representation by the Teamsters. The election covers<br />
approximately 7,600 employees, or 6,340 full-time equivalent ramp, operations and cargo agents. We will negotiate a<br />
collective bargaining agreement with the Teamsters covering our fleet service employees.<br />
28
On March 18, 20<strong>10</strong>, we announced that we had reached a tentative agreement on a new four-year labor contract<br />
with the TWU that represents our dispatchers, which agreement our dispatchers ratified on April 20, 20<strong>10</strong>.<br />
Most of our collective bargaining agreements are currently amendable or become amendable in 20<strong>10</strong>. The<br />
collective bargaining agreements with our pilots, mechanics and certain other work groups became amendable in<br />
December 2008 and those with our flight attendants and CMI mechanics became amendable in December <strong>2009</strong>. With<br />
respect to our workgroups with amendable contracts, we have been meeting with representatives of the applicable unions<br />
to negotiate amended collective bargaining agreements with a goal of reaching agreements that are fair to us and to our<br />
employees. Negotiations often take considerable time. For example, we began negotiating with our pilots’ union in<br />
February 2007, and we received their first economic proposal in December <strong>2009</strong>. We cannot predict the outcome of our<br />
ongoing negotiations with our unionized workgroups, although significant increases in the pay and benefits resulting<br />
from new collective bargaining agreements could have a material adverse effect on us. Furthermore, there can be no<br />
assurance that our generally good labor relations and high labor productivity can continue.<br />
RESULTS OF OPERATIONS<br />
The following discussion provides an analysis of our results of operations and reasons for material changes<br />
therein for the three months ended March 31, 20<strong>10</strong> as compared to the corresponding period in <strong>2009</strong>.<br />
Consolidated Results of Operations<br />
Statistical Information. Certain statistical information for our consolidated operations for the three months<br />
ended March 31 is as follows:<br />
20<strong>10</strong> <strong>2009</strong><br />
% <strong>Inc</strong>rease<br />
(Decrease)<br />
Passengers (thousands) (1) 14,535 14,408 0.9 %<br />
Revenue passenger miles (millions) (2) 20,919 19,790 5.7 %<br />
Available seat miles (millions) (3) 26,316 26,323 -<br />
Passenger load factor (4) 79.5% 75.2% 4.3 pts.<br />
Passenger revenue per available seat mile (cents) <strong>10</strong>.65 9.94 7.1 %<br />
Total revenue per available seat mile (cents) 12.04 11.25 7.0 %<br />
Average yield per revenue passenger mile (cents) (5) 13.40 13.23 1.3 %<br />
Cost per available seat miles (cents) 12.23 11.46 6.7 %<br />
Cost per available seat mile excluding special charges and<br />
aircraft fuel and related taxes (cents) (6) 8.95 8.65 3.5 %<br />
Average price per gallon of fuel, including fuel taxes $2.15 $1.82 18.1 %<br />
Fuel gallons consumed (millions) 398 403 (1.2)%<br />
Average full-time equivalent employees 39,365 40,320 (2.4)%<br />
____________________<br />
(1) The number of revenue passengers measured by each flight segment flown.<br />
(2) The number of scheduled miles flown by revenue passengers.<br />
(3) The number of seats available for passengers multiplied by the number of scheduled miles those seats are<br />
flown.<br />
(4) Revenue passenger miles divided by available seat miles.<br />
(5) The average passenger revenue received for each revenue passenger mile flown.<br />
29
(6) See “Reconciliation of GAAP to non-GAAP Financial Measures” at the end of this item.<br />
Results of Operations. We recorded a net loss of $146 million in the first quarter of 20<strong>10</strong> as compared to a net<br />
loss of $136 million in the first quarter of <strong>2009</strong>. We consider a key measure of our performance to be operating income<br />
(loss), which was a loss of $51 million for the first quarter of 20<strong>10</strong>, as compared to a loss of $55 million for the first<br />
quarter of <strong>2009</strong>. Significant components of our consolidated operating results for the three months ended March 31 are<br />
as follows (in millions, except percentage changes):<br />
20<strong>10</strong> <strong>2009</strong><br />
<strong>Inc</strong>rease<br />
(Decrease)<br />
% <strong>Inc</strong>rease<br />
(Decrease)<br />
Operating Revenue $3,169 $2,962 $207 7.0 %<br />
Operating Expenses 3,220 3,017 203 6.7 %<br />
Operating Loss (51) (55) (4) (7.3)%<br />
Nonoperating <strong>Inc</strong>ome (Expense) (95) (81) 14 17.3 %<br />
Net Loss $ (146) $ (136) $ <strong>10</strong> 7.4 %<br />
Each of these items is discussed in the following sections.<br />
Operating Revenue. The table below shows components of operating revenue for the quarter ended March<br />
31, 20<strong>10</strong> and period to period comparisons for operating revenue, available seat miles (“ASMs”) and passenger<br />
revenue per available seat mile ("RASM") by geographic region for our mainline and regional operations:<br />
Percentage <strong>Inc</strong>rease (Decrease) in<br />
Revenue First Quarter 20<strong>10</strong> vs First Quarter <strong>2009</strong><br />
(in millions) Revenue ASMs RASM<br />
Passenger revenue:<br />
Domestic $1,<strong>10</strong>4 3.1 % (1.7)% 4.9 %<br />
Trans-Atlantic 520 9.4 % (5.3)% 15.6 %<br />
Latin America 439 4.4 % 5.2 % (0.8)%<br />
Pacific 259 11.6 % 15.5 % (3.4)%<br />
Total Mainline 2,322 5.6 % 0.2 % 5.4 %<br />
Regional 481 14.8 % (1.6 )% 16.7 %<br />
Total 2,803 7.1 % - 7.1 %<br />
Cargo <strong>10</strong>2 20.0 %<br />
Other 264 1.5 %<br />
Operating Revenue $3,169 7.0 %<br />
Passenger revenue increased in the first quarter of 20<strong>10</strong> as compared to the first quarter of <strong>2009</strong> due to<br />
increased traffic and higher RASM. The increased revenue is a result of the improving economic conditions in the U.S.<br />
and globally.<br />
30
Cargo revenue increased due to increased freight volume. Other revenue increased due to higher fees for<br />
checking bags.<br />
Operating Expenses. The table below shows period-to-period comparisons by type of operating expense<br />
for our consolidated operations for the three months ended March 31 (in millions, except percentage changes):<br />
20<strong>10</strong> <strong>2009</strong><br />
<strong>Inc</strong>rease<br />
(Decrease)<br />
% <strong>Inc</strong>rease<br />
(Decrease)<br />
Aircraft fuel and related taxes $ 854 $ 735 $119 16.2 %<br />
Wages, salaries and related costs 796 765 31 4.1 %<br />
Aircraft rentals 229 237 (8) (3.4)%<br />
Landing fees and other rentals 213 209 4 1.9 %<br />
Regional capacity purchase, net 201 213 (12) (5.6)%<br />
Distribution costs 171 156 15 9.6 %<br />
Maintenance, materials and repairs 147 153 (6) (3.9)%<br />
Depreciation and amortization 134 111 23 20.7 %<br />
Passenger services 93 88 5 5.7 %<br />
Special charges <strong>10</strong> 4 6 NM<br />
Other 372 346 26 7.5 %<br />
Total $3,220 $3,017 $203 6.7 %<br />
NM = Not Meaningful<br />
Operating expenses increased 6.7% primarily due to the following:<br />
• Aircraft fuel and related taxes increased due to an 18.1% increase in consolidated jet fuel prices, partially<br />
offset by a decrease in gallons consumed. Our average jet fuel price per gallon including related taxes<br />
increased to $2.15 in the first quarter of 20<strong>10</strong> from $1.82 in the first quarter of <strong>2009</strong>. Our average jet fuel<br />
price includes gains related to our fuel hedging program of $0.01 per gallon in the first quarter of 20<strong>10</strong>,<br />
compared to losses of $0.35 per gallon in the first quarter of <strong>2009</strong>.<br />
• Wages, salaries and related costs increased primarily due to higher variable compensation expense in 20<strong>10</strong>.<br />
We recorded a $24 million net credit in stock-based compensation expense in the first quarter of <strong>2009</strong>,<br />
primarily related to our profit based RSU awards.<br />
• Aircraft rentals decreased due to the retirement of leased Boeing 737 aircraft in <strong>2009</strong> and the first quarter of<br />
20<strong>10</strong>.<br />
• Regional capacity purchase, net, includes expenses related to our capacity purchase agreements. Our most<br />
significant capacity purchase agreement is with ExpressJet. We also have agreements with Chautauqua,<br />
Colgan and CommutAir. Capacity purchase expenses decreased due to capacity reductions.<br />
• Distribution costs increased due to higher credit card discount fees, booking fees and travel agency<br />
commissions, all of which resulted from increased passenger revenue.<br />
31
• Depreciation and amortization expense increased in 20<strong>10</strong> due to higher capitalizable project costs and<br />
increased depreciation from new aircraft placed in service during <strong>2009</strong>. In addition, we recorded $11 million<br />
of depreciation expense during the quarter ended March 31, 20<strong>10</strong> that relates to prior periods.<br />
• Special charges. See Note 8 to our consolidated financial statements contained in Item 1 of this report for a<br />
discussion of the special charges.<br />
• Other operating expenses increased due to higher OnePass reward expenses in 20<strong>10</strong> and the receipt in <strong>2009</strong><br />
of insurance settlements related to Hurricane Ike, which reduced other operating expenses in <strong>2009</strong>.<br />
Nonoperating <strong>Inc</strong>ome (Expense). Nonoperating expense increased $14 million in the first quarter of 20<strong>10</strong><br />
compared to the first quarter of <strong>2009</strong> primarily as a result of foreign currency losses, a portion of which related to<br />
the Venezuelan currency devaluation in the first quarter of 20<strong>10</strong>.<br />
<strong>Inc</strong>ome Taxes. Our effective tax rates differ from the federal statutory rate of 35% primarily due to the<br />
following: changes in the valuation allowance, expenses that are not deductible for federal income tax purposes and state<br />
income taxes. We are required to provide a valuation allowance for our deferred tax assets in excess of deferred tax<br />
liabilities because we have concluded that it is more likely than not that such deferred tax assets will ultimately not be<br />
realized. As a result, our pre-tax losses for the first quarter of 20<strong>10</strong> were not reduced by any tax benefit.<br />
Segment Results of Operations<br />
We have two reportable segments: mainline and regional. The mainline segment consists of flights to<br />
cities using larger jets while the regional segment currently consists of flights with a capacity of 79 or fewer seats.<br />
As of March 31, 20<strong>10</strong>, the regional segment was operated by ExpressJet, Chautauqua, CommutAir and Colgan<br />
through capacity purchase agreements. Under these agreements, we purchase all of the capacity related to aircraft<br />
covered by the contracts and are responsible for setting prices and selling all of the related seat inventory. In<br />
exchange for the regional carriers' operation of the flights, we pay the regional carriers for each scheduled block<br />
hour based on agreed formulas. Under the agreements, we recognize all passenger, cargo and other revenue<br />
associated with each flight, and are responsible for all revenue-related expenses, including commissions,<br />
reservations and catering.<br />
We evaluate segment performance based on several factors, of which the primary financial measure is<br />
operating income (loss). However, we do not manage our business or allocate resources based on segment operating<br />
profit or loss because (1) our flight schedules are designed to maximize revenue from passengers flying, (2) many<br />
operations of the two segments are substantially integrated (for example, airport operations, sales and marketing,<br />
scheduling and ticketing), and (3) management decisions are based on their anticipated impact on the overall<br />
network, not on one individual segment.<br />
32
Statistical Information. Certain statistical information for our segments' operations for the three months<br />
ended March 31 is as follows:<br />
<strong>Inc</strong>rease<br />
20<strong>10</strong> <strong>2009</strong> (Decrease)<br />
Mainline Operations:<br />
Passengers (thousands) <strong>10</strong>,562 <strong>10</strong>,562 -<br />
Revenue passenger miles (millions) 18,727 17,690 5.9 %<br />
Available seat miles (millions) 23,393 23,352 0.2 %<br />
Cargo ton miles (millions) 262 200 31.0 %<br />
Passenger load factor:<br />
Mainline 80.1% 75.8% 4.3 pts.<br />
Domestic 81.7% 79.7% 2.0 pts.<br />
International 78.6% 72.1% 6.5 pts.<br />
Passenger revenue per available seat mile (cents) 9.92 9.41 5.4 %<br />
Total revenue per available seat mile (cents) 11.44 <strong>10</strong>.83 5.6 %<br />
Average yield per revenue passenger mile (cents) 12.40 12.43 (0.2)%<br />
Average fare per revenue passenger $221.81 $209.94 5.7 %<br />
Cost per available seat mile (cents) 11.34 <strong>10</strong>.56 7.4 %<br />
Cost per available seat mile excluding special charges and aircraft fuel<br />
and related taxes (cents) (1) 8.29 7.93 4.5 %<br />
Average price per gallon of fuel, including fuel taxes $2.14 $1.83 16.9 %<br />
Fuel gallons consumed (millions) 330 333 (0.9)%<br />
Aircraft in fleet at end of period (2) 333 354 (5.9)%<br />
Average length of aircraft flight (miles) 1,590 1,502 5.9 %<br />
Average daily utilization of each aircraft (hours) <strong>10</strong>:34 <strong>10</strong>:22 1.8 %<br />
Regional Operations:<br />
Passengers (thousands) 3,973 3,846 3.3 %<br />
Revenue passenger miles (millions) 2,192 2,<strong>10</strong>0 4.4 %<br />
Available seat miles (millions) 2,923 2,971 (1.6)%<br />
Passenger load factor 75.0% 70.7% 4.3 pts.<br />
Passenger revenue per available seat mile (cents) 16.46 14.11 16.7 %<br />
Average yield per revenue passenger mile (cents) 21.95 19.96 <strong>10</strong>.0 %<br />
Aircraft in fleet at end of period (2) 253 280 (9.6)%<br />
________________________<br />
(1) See “Reconciliation of GAAP to non-GAAP Financial Measures” at the end of this Item.<br />
(2) Excludes aircraft that were removed from service. Regional aircraft include aircraft operated by all carriers under<br />
capacity purchase agreements, but exclude any aircraft that we sublease to other operators but are not operated on<br />
our behalf.<br />
33
Mainline Results of Operations. Significant components of our mainline segment's operating results for the<br />
three months ended March 31 are as follows (in millions, except percentage changes):<br />
20<strong>10</strong> <strong>2009</strong><br />
<strong>Inc</strong>rease<br />
(Decrease)<br />
% <strong>Inc</strong>rease<br />
(Decrease)<br />
Operating Revenue $2,676 $2,529 $147 5.8 %<br />
Operating Expenses:<br />
Aircraft fuel and related taxes 707 6<strong>10</strong> 97 15.9 %<br />
Wages, salaries and related costs 754 723 31 4.3 %<br />
Aircraft rentals 152 158 (6) (3.8)%<br />
Landing fees and other rentals 186 184 2 1.1 %<br />
Distribution costs 147 135 12 8.9 %<br />
Maintenance, materials and repairs 147 153 (6) (3.9)%<br />
Depreciation and amortization 130 <strong>10</strong>8 22 20.4 %<br />
Passenger services 86 81 5 6.2 %<br />
Special charges 8 4 4 NM<br />
Other 336 3<strong>10</strong> 26 8.4 %<br />
Total Operating Expenses 2,653 2,466 187 7.6 %<br />
Operating <strong>Inc</strong>ome $ 23 $ 63 $(40 ) (63.5 )%<br />
The variances in specific line items for the mainline segment are due to the same factors discussed under<br />
consolidated results of operations.<br />
Regional Results of Operations. Significant components of our regional segment’s operating results for the<br />
three months ended March 31 are as follows (in millions, except percentage changes):<br />
20<strong>10</strong> <strong>2009</strong><br />
<strong>Inc</strong>rease<br />
(Decrease)<br />
% <strong>Inc</strong>rease<br />
(Decrease)<br />
Operating Revenue $ 493 $ 433 $ 60 13.9 %<br />
Operating Expenses:<br />
Aircraft fuel and related taxes 147 125 22 17.6 %<br />
Wages, salaries and related costs 42 42 - -<br />
Aircraft rentals 77 79 (2) (2.5)%<br />
Landing fees and other rentals 27 25 2 8.0 %<br />
Regional capacity purchase, net 201 213 (12) (5.6)%<br />
Distribution costs 24 21 3 14.3 %<br />
Depreciation and amortization 4 3 1 33.3 %<br />
Passenger services 7 7 - -<br />
Special charges 2 - 2 NM<br />
Other 36 36 - -<br />
Total Operating Expenses 567 551 16 2.9 %<br />
Operating Loss $ (74 ) $(118 ) $(44 ) (37.3 )%<br />
34
The reported results of our regional segment do not reflect the total contribution of the regional segment to<br />
our system-wide operations. The regional segment generates revenue for the mainline segment as it feeds passengers<br />
from smaller cities into our hubs. The variances in specific line items for the regional segment reflect generally the<br />
same factors discussed under consolidated results of operations.<br />
LIQUIDITY AND CAPITAL RESOURCES<br />
Current Liquidity<br />
As of March 31, 20<strong>10</strong>, we had $3.2 billion in unrestricted cash, cash equivalents and short-term<br />
investments, which is $297 million higher than at December 31, <strong>2009</strong>. At March 31, 20<strong>10</strong>, we also had $164 million<br />
of restricted cash, cash equivalents and short-term investments, which is primarily collateral for estimated future<br />
workers' compensation claims, credit card processing contracts, letters of credit and performance bonds. Restricted<br />
cash, cash equivalents and short-term investments at December 31, <strong>2009</strong> also totaled $164 million.<br />
As is the case with many of our principal competitors, we have a high proportion of debt compared to our<br />
capital. We have a significant amount of fixed obligations, including debt, aircraft leases and financings, leases of<br />
airport property and other facilities and pension funding obligations. At March 31, 20<strong>10</strong>, we had approximately<br />
$6.2 billion of debt and capital lease obligations, including $1.9 billion that will come due by the end of 2011<br />
(consisting of $0.8 billion during the remainder of 20<strong>10</strong> and $1.1 billion during 2011). In addition, we have<br />
substantial non-cancelable commitments for capital expenditures, including the acquisition of new aircraft and<br />
related spare engines.<br />
We do not currently have any undrawn lines of credit or revolving credit facilities and most of our otherwise<br />
readily financeable assets are encumbered. The global economic recession severely disrupted the global capital<br />
markets, resulting in a diminished availability of financing and higher cost for financing that was obtainable. Although<br />
access to the capital markets has improved over the past several months, we cannot give any assurances that we will be<br />
able to obtain additional financing or otherwise access the capital markets in the future on acceptable terms (or at all).<br />
We must achieve and sustain profitability and/or access the capital markets to meet our significant long-term debt and<br />
capital lease obligations and future commitments for capital expenditures, including the acquisition of aircraft and related<br />
spare engines.<br />
Sources and Uses of Cash<br />
Operating Activities. Cash flows provided by operations for the three months ended March 31, 20<strong>10</strong> were<br />
$431 million compared to $1<strong>10</strong> million in the same period in <strong>2009</strong>. The increase in cash flows provided by operations<br />
in 20<strong>10</strong> compared to <strong>2009</strong> is primarily the result of higher advance ticket sales in 20<strong>10</strong>.<br />
35
Investing Activities. Cash flows provided by (used in) investing activities for the three months ended<br />
March 31 were as follows (in millions):<br />
20<strong>10</strong> <strong>2009</strong><br />
Cash<br />
<strong>Inc</strong>rease<br />
(Decrease)<br />
Capital expenditures $(80 ) $(86 ) $ 6<br />
Aircraft purchase deposits (paid) refunded, net (52) 27 (79)<br />
Proceeds from sales of short-term investments, net 24 41 (17)<br />
Proceeds from sales of property and equipment 24 5 19<br />
Decrease (increase) in restricted cash, cash<br />
equivalents and short-term investments - 17 (17)<br />
Other cash flows from investing activities - (1) 1<br />
Total $(84 ) $ 3 $(87 )<br />
We have substantial commitments for capital expenditures, including for the acquisition of new aircraft. As<br />
of March 31, 20<strong>10</strong>, we had firm commitments to purchase 86 new Boeing aircraft scheduled for delivery from 20<strong>10</strong><br />
through 2016, with an estimated aggregate cost of $5.1 billion including related spare engines. In addition to our firm<br />
order aircraft, we had options to purchase a total of 98 additional Boeing aircraft as of March 31, 20<strong>10</strong>.<br />
Projected net capital expenditures for 20<strong>10</strong> are as follows (in millions):<br />
Fleet related (excluding aircraft to be acquired through the issuance of debt) $265<br />
Non-fleet 140<br />
Net capital expenditures 405<br />
Aircraft purchase deposits 20<br />
Projected net capital expenditures $425<br />
Projected fleet expenditures include the portion of the aircraft purchase price in excess of financings, flight<br />
simulator data packages related to Boeing 787 aircraft, aircraft reconfigurations and other product enhancements<br />
including winglet installations, flat-bed BusinessFirst seats and in-seat power installations. Projected non-fleet<br />
capital expenditures are primarily for Star Alliance-related costs and technology and terminal enhancements. While<br />
some of our projected capital expenditures are related to projects we have committed to, a significant number of<br />
projects can be deferred. Should economic conditions warrant, we will reduce our capital expenditures, and expect<br />
to be able to do so without materially impacting our operations.<br />
We paid net aircraft purchase deposits in the first quarter of 20<strong>10</strong> related to future deliveries. During the<br />
first quarter of <strong>2009</strong>, we received net purchase deposit refunds related to deliveries during the first quarter of <strong>2009</strong>.<br />
We sold two Boeing 737-500 aircraft to a foreign buyer in the first quarter of 20<strong>10</strong> for cash proceeds of<br />
$19 million (in addition to deposits received in 2008 on these aircraft).<br />
36
Financing Activities. Cash flows used in financing activities for the three months ended March 31 were as<br />
follows (in millions):<br />
20<strong>10</strong> <strong>2009</strong><br />
Cash<br />
<strong>Inc</strong>rease<br />
(Decrease)<br />
Payments on long-term debt and capital lease obligations $(151 ) $(98 ) $(53 )<br />
Proceeds from issuance of long-term debt, net <strong>10</strong>9 26 83<br />
Proceeds from issuance of common stock purchase to stock plans <strong>10</strong> 4 6<br />
Total $ (32) $(68 ) $ 36<br />
Cash flows used in financing activities decreased due to higher debt issuances in the first quarter of 20<strong>10</strong>,<br />
partially offset by higher debt payments.<br />
On December 30, <strong>2009</strong>, we entered into an amendment of our Debit Card Marketing Agreement with<br />
JPMorgan Chase Bank, N.A. (“JP Morgan Chase”) under which JP Morgan Chase purchases frequent flyer mileage<br />
credits to be earned by OnePass members for making purchases using a <strong>Continental</strong> branded debit card issued by JP<br />
Morgan Chase. We received a payment of $40 million in January 20<strong>10</strong> for the advance purchase of frequent flyer<br />
mileage credits beginning January 1, 2016, or earlier in certain circumstances. The purchase of mileage credits has<br />
been treated as a loan from JP Morgan Chase with an implicit interest rate of 5.5% and is reported as long-term debt<br />
in our consolidated balance sheet.<br />
In November <strong>2009</strong>, we obtained financing for eight currently-owned Boeing aircraft, nine new Boeing 737-<br />
800 aircraft and two new Boeing 777 aircraft. We applied a portion of this financing to refinance one Boeing 737-<br />
800 aircraft and one Boeing 777-200 aircraft during the first quarter of 20<strong>10</strong> and recorded related debt of $66<br />
million. The remaining aircraft are expected to be refinanced or delivered, as applicable, by August 31, 20<strong>10</strong>. In<br />
connection with this financing, enhanced equipment trusts raised $644 million through the issuance of two classes of<br />
enhanced equipment trust certificates. Class A certificates, with an aggregate principal amount of $528 million, bear<br />
interest at 7.25% and Class B certificates, with an aggregate principal amount of $117 million, bear interest at<br />
9.25%. The proceeds from the sale of the certificates are initially being held by a depositary in escrow for the<br />
benefit of the certificate holders until we issue equipment notes to the trust, which will purchase such notes with a<br />
portion of the escrowed funds. These escrowed funds are not guaranteed by us and are not reported as debt on our<br />
consolidated balance sheet because the proceeds held by the depositary are not our assets. Any unused proceeds will<br />
be distributed directly to the certificate holders. Principal payments on the equipment notes and the corresponding<br />
distribution of these payments to certificate holders will begin in November 20<strong>10</strong> and will end in November 2019<br />
for Class A certificates and in May 2017 for Class B certificates.<br />
We do not have backstop financing or any other financing currently in place for the balance of the Boeing<br />
aircraft on order. Further financing will be needed to satisfy our capital commitments for our firm order aircraft and<br />
other related capital expenditures. We can provide no assurance that the backstop financing or any other financing<br />
not already in place for our aircraft deliveries will be available to us when needed on acceptable terms or at all.<br />
Since the commitments for firm order aircraft are non-cancelable, and assuming no breach of the agreement by<br />
Boeing, if we are unable to obtain financing and cannot otherwise satisfy our commitment to purchase these aircraft,<br />
the manufacturer could exercise its rights and remedies under applicable law, such as seeking to terminate the<br />
contract for a material breach, selling the aircraft to one or more other parties and suing us for damages to recover<br />
any resulting losses incurred by the manufacturer.<br />
37
Other Liquidity Matters<br />
See the indicated notes to our consolidated financial statements contained in Item 1 of this report for the<br />
following other matters affecting our liquidity and commitments.<br />
Investment in student loan-related auction rate securities Note 4<br />
Fuel hedges Note 5<br />
Pension obligations Note 7<br />
Guarantees and indemnifications, credit card processing agreements, credit ratings<br />
and environmental liabilities Note 11<br />
Reconciliation of GAAP to non-GAAP Financial Measures<br />
Non-GAAP financial measures are presented because they provide management and investors the ability to<br />
measure and monitor our performance on a consistent basis. Special items relate to activities that are not central to<br />
our ongoing operations. A reconciliation of net loss to the non-GAAP financial measure of net loss excluding<br />
special items for the three months ended March 31 is as follows (in millions):<br />
20<strong>10</strong> <strong>2009</strong><br />
Net loss – GAAP $(146 ) $(136 )<br />
Special charges:<br />
Aircraft-related charges, net 6 4<br />
Severance 4 -<br />
Net loss excluding special items – non-GAAP $(136 ) $(132 )<br />
38
Cost per available seat mile (CASM) is a common metric used in the airline industry to measure an airline’s<br />
cost structure and efficiency. CASM trends can be distorted by items that are not central to our ongoing operations.<br />
Additionally, both the cost and availability of fuel are subject to many economic and political factors beyond our control.<br />
CASM excluding special charges and aircraft fuel and related taxes provides management and investors the ability to<br />
measure our cost performance absent special items and fuel price volatility. A reconciliation of GAAP operating<br />
expenses used to determine CASM to the non-GAAP operating expenses used to determine CASM excluding special<br />
charges and aircraft fuel and related taxes for the three months ended March 31 is as follows (in millions, except CASM<br />
amounts):<br />
20<strong>10</strong> <strong>2009</strong><br />
Mainline cost per available seat mile excluding special<br />
charges and aircraft fuel and related taxes:<br />
Operating expenses – GAAP $2,653 $ 2,466<br />
Special charges:<br />
Aircraft-related charges, net 6 4<br />
Severance 2 -<br />
Aircraft fuel and related taxes 707 6<strong>10</strong><br />
Operating expenses excluding above items –<br />
non-GAAP $ 1,938 $ 1,852<br />
Available seat miles – mainline 23,393 23,352<br />
CASM – GAAP (cents) 11.34 <strong>10</strong>.56<br />
CASM excluding special charges and aircraft<br />
`<br />
fuel and related taxes – non-GAAP (cents)<br />
8.29 7.93<br />
Consolidated cost per available seat mile excluding<br />
special charges and aircraft fuel and related taxes:<br />
Operating expenses – GAAP $3,220 $3,017<br />
Special charges:<br />
Aircraft-related charges, net 6 4<br />
Severance 4 -<br />
Aircraft fuel and related taxes 854 735<br />
Operating expenses excluding above items –<br />
non-GAAP $ 2,356 $ 2,278<br />
Available seat miles – consolidated 26,316 26,323<br />
CASM – GAAP (cents) 12.23 11.46<br />
CASM excluding special charges and aircraft<br />
fuel and related taxes – non-GAAP (cents) 8.95 8.65<br />
39
Item 3. Quantitative and Qualitative Disclosures about Market Risk.<br />
There have been no material changes in market risk from the information provided in Item 7A. "Quantitative<br />
and Qualitative Disclosures About Market Risk" in our <strong>2009</strong> <strong>Form</strong> <strong>10</strong>-K except as follows:<br />
Aircraft Fuel. As of March 31, 20<strong>10</strong>, our projected consolidated fuel requirements for the remainder of<br />
20<strong>10</strong> and the first quarter of 2011 were hedged as follows:<br />
% of<br />
Expected<br />
Consumption<br />
Maximum Price<br />
Weighted<br />
Average price<br />
(per gallons)<br />
% of<br />
Expected<br />
Consumption<br />
Minimum Price<br />
Weighted<br />
Average price<br />
(per gallons)<br />
Remainder of 20<strong>10</strong><br />
WTI crude oil swaps <strong>10</strong> % $1.83 <strong>10</strong> % $1.83<br />
WTI crude oil call options 14 $2.25 N/A N/A<br />
24 % <strong>10</strong> %<br />
First Quarter of 2011<br />
WTI crude oil call options 2 % $2.33 N/A N/A<br />
At March 31, 20<strong>10</strong>, the fair value of our fuel derivatives was $38 million and is included in prepayments<br />
and other current assets in our consolidated balance sheet. We estimate that a <strong>10</strong>% decrease in the price of crude oil<br />
at March 31, 20<strong>10</strong> would decrease the fair value of the fuel derivatives outstanding at that date by approximately<br />
$40 million.<br />
Foreign Currency. At March 31, 20<strong>10</strong>, we had forward contracts outstanding to hedge 34% of our projected<br />
Japanese yen-denominated cash inflows, primarily from passenger ticket sales, for the remainder of 20<strong>10</strong>. At March 31,<br />
20<strong>10</strong>, the fair value of our foreign currency hedges was $4 million and is included in prepayments and other current<br />
assets in our consolidated balance sheet. We estimate that a uniform <strong>10</strong>% strengthening in the value of the U.S. dollar<br />
relative to the Japanese yen at March 31, 20<strong>10</strong> would increase the fair value of our yen hedges by $5 million and<br />
increase our underlying exposure by $21 million, resulting in a net loss of $16 million.<br />
Item 4. Controls and Procedures.<br />
Management’s Conclusion on the Effectiveness of Disclosure Controls and Procedures. As required by<br />
Rule 13a-15(b) of the Securities Exchange Act of 1934, as amended (the “Exchange Act”), we have evaluated,<br />
under the supervision and with the participation of our management, including our principal executive officer and<br />
principal financial officer, the effectiveness of the design and operation of our disclosure controls and procedures (as<br />
defined in Rules 13a-15(e) and 15d-15(e) under the Exchange Act) as of the end of the period covered by this <strong>Form</strong><br />
<strong>10</strong>-Q. Our disclosure controls and procedures are designed to provide reasonable assurance that the information<br />
required to be disclosed by us in reports that we file under the Exchange Act is accumulated and communicated to<br />
our management, including our principal executive officer and principal financial officer, as appropriate, to allow<br />
timely decisions regarding required disclosure and is recorded, processed, summarized and reported within the time<br />
periods specified in the rules and forms of the SEC. Based upon the evaluation, our principal executive officer and<br />
principal financial officer have concluded that our disclosure controls and procedures were effective as of March 31,<br />
20<strong>10</strong> at the reasonable assurance level.<br />
40
Changes in Internal Controls. There was no change in our internal control over financial reporting during<br />
the quarter ended March 31, 20<strong>10</strong> that materially affected, or is reasonably likely to materially affect, our internal<br />
control over financial reporting.<br />
41
PART II - OTHER INFORMATION<br />
Item 1. Legal Proceedings.<br />
During the period between 1997 and 2001, we reduced or capped the base commissions that we paid to<br />
domestic travel agents, and in 2002 we eliminated those base commissions. These actions were similar to those also<br />
taken by other air carriers. We are a defendant, along with several other air carriers, in two lawsuits brought by<br />
travel agencies that purportedly opted out of a prior class action entitled Sarah Futch Hall d/b/a/ Travel Specialists v.<br />
<strong>United</strong> Air Lines, et al. (U.S.D.C., Eastern District of North Carolina), filed on June 21, 2000, in which the<br />
defendant airlines prevailed on summary judgment that was upheld on appeal. These similar suits against<br />
<strong>Continental</strong> and other major carriers allege violations of antitrust laws in reducing and ultimately eliminating the<br />
base commissions formerly paid to travel agents and seek unspecified money damages and certain injunctive relief<br />
under the Clayton Act and the Sherman Anti-Trust Act. The pending cases, which currently involve a total of 90<br />
travel agency plaintiffs, are Tam Travel, <strong>Inc</strong>. v. Delta Air Lines, <strong>Inc</strong>., et al. (U.S.D.C., Northern District of<br />
California), filed on April 9, 2003 and Swope Travel Agency, et al. v. Orbitz LLC et al. (U.S.D.C., Eastern District<br />
of Texas), filed on June 5, 2003. By order dated November <strong>10</strong>, 2003, these actions were transferred and<br />
consolidated for pretrial purposes by the Judicial Panel on Multidistrict Litigation to the Northern District of Ohio.<br />
On October 29, 2007, the judge for the consolidated lawsuit dismissed the case for failure to meet the heightened<br />
pleading standards established earlier in 2007 by the U.S. Supreme Court's decision in Bell Atlantic Corp. v.<br />
Twombly. On October 2, <strong>2009</strong>, the U.S. Court of Appeals for the Sixth Circuit affirmed the trial court’s dismissal<br />
of the case. On December 18, <strong>2009</strong>, the plaintiffs’ request for rehearing by the Sixth Circuit en banc was denied.<br />
On March 18, 20<strong>10</strong>, the plaintiffs filed a Petition for a Writ of Certiorari with the U.S. Supreme Court. The<br />
plaintiffs in the Swope lawsuit, encompassing 43 travel agencies, have also alleged that certain claims raised in their<br />
lawsuit were not, in fact, dismissed. The trial court has not yet ruled on that issue. In the consolidated lawsuit, we<br />
believe the plaintiffs' claims are without merit, and we intend to vigorously defend any appeal. Nevertheless, a final<br />
adverse court decision awarding substantial money damages could have a material adverse effect on our results of<br />
operations, financial condition or liquidity.<br />
Item 1A. Risk Factors<br />
Part 1, Item 1A, “Risk Factors,” of our <strong>2009</strong> <strong>Form</strong> <strong>10</strong>-K includes a detailed discussion of our risk factors.<br />
Additional risks and uncertainties not currently known to us, or that we currently deem to be immaterial, also may<br />
materially adversely affect our business, financial condition and future results.<br />
<strong>Airlines</strong> may continue to participate in industry consolidation or alliances, which could have a<br />
material adverse effect on us. We are facing stronger competition from carriers that have participated in industry<br />
consolidation, including as a result of the merger of Delta and Northwest in 2008, which changed the competitive<br />
environment for us and the airline industry. Further consolidation could adversely affect our competitive position,<br />
as our competitors have the opportunity through consolidation to significantly expand the reach of their networks,<br />
which is of primary importance to business travelers, and to achieve cost reductions by eliminating redundancy in<br />
their operations. In addition, if <strong>United</strong> were to merge with another carrier, it could threaten the antitrust immunity<br />
granted to us by the DOT. Although we cannot predict whether any consolidation transactions will occur, we<br />
regularly review our strategic options and will act in the best interests of our stockholders, employees, customers<br />
and the communities we serve.<br />
42
<strong>Airlines</strong> may enter into new alliances or joint ventures, or modify existing alliances or joint ventures,<br />
which could have a material adverse effect on us. We are facing stronger competition from expanded airline<br />
alliances and joint ventures. Through participation in airline alliances and/or joint ventures, carriers granted antitrust<br />
immunity by the appropriate regulatory authorities are able to coordinate their routes, pool their revenues and<br />
costs and enjoy other mutual benefits, such as frequent flier program reciprocity, achieving many of the benefits of<br />
consolidation. For example, in <strong>2009</strong>, Air France-KLM, Delta and Northwest launched a new trans-Atlantic joint<br />
venture among those airlines that involves coordination of routes, fares, schedules and other matters among those<br />
airlines, Alitalia and CSA Czech <strong>Airlines</strong>. American <strong>Airlines</strong>, British Airways and Iberia have received tentative<br />
DOT approval of their application for anti-trust immunity for a similar trans-Atlantic joint venture, which would<br />
also involve many of the same benefits. There may be additional changes in airline alliances and/or joint ventures in<br />
the future, any of which could result in one or more alliances with more extensive route networks and/or lower cost<br />
structures than currently exist, impairing our ability to realize the expected benefits from our alliance relationships<br />
and having a material adverse effect on us.<br />
Our results of operations fluctuate due to seasonality and other factors affecting the airline industry.<br />
Due to greater demand for air travel during the summer months, revenue in the airline industry in the second and<br />
third quarters of the year is generally stronger than revenue in the first and fourth quarters of the year for most U.S.<br />
air carriers. Our result of operations are also impacted by numerous other factors that are not necessarily seasonal,<br />
including excise and similar taxes, weather and air traffic control delays, as well as geological events and natural<br />
disasters. For example, in April 20<strong>10</strong>, the volcanic ash from an eruption in Iceland necessitated the closing of a<br />
significant portion of the airspace over Europe, denying us access to most of Europe’s largest airports for several<br />
days. We estimate that our revenues were reduced by approximately $24 million through April 21, 20<strong>10</strong> due to our<br />
cancellation of hundreds of flights. As a consequence of these factors, many of which are unpredictable, our<br />
operating results for a quarterly period are not necessarily indicative of operating results for an entire year, and<br />
historical operating results are not necessarily indicative of future operating results.<br />
Item 2. Unregistered Sales of Equity Securities and Use of Proceeds.<br />
None.<br />
Item 3. Defaults Upon Senior Securities.<br />
None.<br />
Item 4. (Removed and Reserved).<br />
Item 5. Other Information.<br />
None.<br />
Item 6.<br />
Exhibits.<br />
3.1 Amended and Restated Certificate of <strong>Inc</strong>orporation of <strong>Continental</strong>, as amended through June 6,<br />
2006 – incorporated by reference to Exhibit 3.1 to <strong>Continental</strong>’s Annual Report on <strong>Form</strong> <strong>10</strong>-K<br />
for the year ended December 31, 2006 (File no. 1-<strong>10</strong>323).<br />
3.1(a)<br />
Certification of Designation of Series A Junior Participating Preferred Stock, included as<br />
Exhibit A to Exhibit 3.1.<br />
43
3.1(a)(i)<br />
3.1(a)(ii)<br />
Certificate of Amendment of Certificate of Designation of Series A Junior Participating<br />
Preferred Stock – incorporated by reference to Exhibit 3.1(b) to <strong>Continental</strong>’s Annual Report on<br />
<strong>Form</strong> <strong>10</strong>-K for the year ended December 31, 2001 (File no. 1-<strong>10</strong>323).<br />
Certificate of <strong>Inc</strong>rease – Series A Junior Participating Preferred Stock – incorporated by<br />
reference to Exhibit 3.1(a)(ii) to <strong>Continental</strong>’s Quarterly Report on <strong>Form</strong> <strong>10</strong>-Q for the period<br />
ended June 30, 2008 (File no. 1-<strong>10</strong>323).<br />
3.2 Amended and Restated Bylaws of <strong>Continental</strong>, effective as of June <strong>10</strong>, <strong>2009</strong> – incorporated by<br />
reference to Exhibit 3.2 to <strong>Continental</strong>’s Current Report on <strong>Form</strong> 8-K dated June <strong>10</strong>, <strong>2009</strong> (File<br />
no. 1-<strong>10</strong>323).<br />
<strong>10</strong>.1* <strong>Continental</strong> <strong>Airlines</strong>, <strong>Inc</strong>. Long-Term <strong>Inc</strong>entive and RSU Program, as amended and restated<br />
through March 11, 20<strong>10</strong> (adopted pursuant to <strong>Inc</strong>entive Plan 20<strong>10</strong>).<br />
<strong>10</strong>.2 Supplemental Agreement No. 54, dated March 2, 20<strong>10</strong>, to Purchase Agreement No. 1951<br />
(“P.A. 1951”), dated July 23, 1996, between <strong>Continental</strong> and The Boeing Company (“Boeing”)<br />
relating to the purchase of Boeing 737 aircraft. (1)<br />
<strong>10</strong>.3 Supplemental Agreement No. 55, dated March 31, 20<strong>10</strong>, to P.A. 1951. (1)<br />
<strong>10</strong>.4 Supplemental Agreement No. 19, dated March 2, 20<strong>10</strong>, to Purchase Agreement No. 2061, dated<br />
October <strong>10</strong>, 1997, between <strong>Continental</strong> and Boeing relating to the purchase of Boeing 777<br />
aircraft. (1)<br />
31.1 Rule 13a-14 (a)/15d-14 (a) Certification of Chief Executive Officer.<br />
31.2 Rule 13a-14 (a)/15d-14 (a) Certification of Chief Financial Officer.<br />
32.1 Section 1350 Certifications.<br />
*This exhibit relates to management contracts or compensatory plans or arrangements.<br />
(1) <strong>Continental</strong> has applied to the SEC for confidential treatment of a portion of this exhibit.<br />
44
SIGNATURES<br />
Pursuant to the requirements of the Securities Exchange Act of 1934, the Registrant has duly caused this<br />
report to be signed on its behalf by the undersigned, thereunto duly authorized.<br />
CONTINENTAL AIRLINES, INC.<br />
Registrant<br />
Date: April 22, 20<strong>10</strong> by: /s/ Chris Kenny<br />
Chris Kenny<br />
Vice President and Controller<br />
(Principal Accounting Officer)<br />
45
INDEX TO EXHIBITS<br />
OF<br />
CONTINENTAL AIRLINES, INC.<br />
3.1 Amended and Restated Certificate of <strong>Inc</strong>orporation of <strong>Continental</strong>, as amended through June 6,<br />
2006 – incorporated by reference to Exhibit 3.1 to <strong>Continental</strong>’s Annual Report on <strong>Form</strong> <strong>10</strong>-K for<br />
the year ended December 31, 2006 (File no. 1-<strong>10</strong>323).<br />
3.1(a)<br />
3.1(a)(i)<br />
3.1(a)(ii)<br />
Certification of Designation of Series A Junior Participating Preferred Stock, included as Exhibit<br />
A to Exhibit 3.1.<br />
Certificate of Amendment of Certificate of Designation of Series A Junior Participating Preferred<br />
Stock – incorporated by reference to Exhibit 3.1(b) to <strong>Continental</strong>’s Annual Report on <strong>Form</strong> <strong>10</strong>-K<br />
for the year ended December 31, 2001 (File no. 1-<strong>10</strong>323).<br />
Certificate of <strong>Inc</strong>rease – Series A Junior Participating Preferred Stock – incorporated by reference<br />
to Exhibit 3.1(a)(ii) to <strong>Continental</strong>’s Quarterly Report on <strong>Form</strong> <strong>10</strong>-Q for the period ended June 30,<br />
2008 (File no. 1-<strong>10</strong>323).<br />
3.2 Amended and Restated Bylaws of <strong>Continental</strong>, effective as of June <strong>10</strong>, <strong>2009</strong> – incorporated by<br />
reference to Exhibit 3.2 to <strong>Continental</strong>’s Current Report on <strong>Form</strong> 8-K dated June <strong>10</strong>, <strong>2009</strong> (File<br />
no. 1-<strong>10</strong>323).<br />
<strong>10</strong>.1* <strong>Continental</strong> <strong>Airlines</strong>, <strong>Inc</strong>. Long-Term <strong>Inc</strong>entive and RSU Program, as amended and restated<br />
through March 11, 20<strong>10</strong> (adopted pursuant to <strong>Inc</strong>entive Plan 20<strong>10</strong>).<br />
<strong>10</strong>.2 Supplemental Agreement No. 54, dated March 2, 20<strong>10</strong>, to Purchase Agreement No. 1951 (“P.A.<br />
1951”), dated July 23, 1996, between <strong>Continental</strong> and The Boeing Company (“Boeing”) relating<br />
to the purchase of Boeing 737 aircraft. (1)<br />
<strong>10</strong>.3 Supplemental Agreement No. 55, dated March 31, 20<strong>10</strong>, to P.A. 1951. (1)<br />
<strong>10</strong>.4 Supplemental Agreement No. 19, dated March 2, 20<strong>10</strong>, to Purchase Agreement No. 2061, dated<br />
October <strong>10</strong>, 1997, between <strong>Continental</strong> and Boeing relating to the purchase of Boeing 777<br />
aircraft. (1)<br />
31.1 Rule 13a-14 (a)/15d-14 (a) Certification of Chief Executive Officer.<br />
31.2 Rule 13a-14 (a)/15d-14 (a) Certification of Chief Financial Officer.<br />
32.1 Section 1350 Certifications.<br />
*This exhibit relates to management contracts or compensatory plans or arrangements.<br />
(1) <strong>Continental</strong> has applied to the SEC for confidential treatment of a portion of this exhibit.<br />
46