16-Estimation of Capital Formation at State Level.pdf - Mimts.org
16-Estimation of Capital Formation at State Level.pdf - Mimts.org
16-Estimation of Capital Formation at State Level.pdf - Mimts.org

You also want an ePaper? Increase the reach of your titles
YUMPU automatically turns print PDFs into web optimized ePapers that Google loves.
The Journal <strong>of</strong> income and wealth, Vol. 31, No. 1, January-June, 2009<br />
ESTIMATION OF CAPITAL FORMATION<br />
AT STATE LEVEL<br />
T. Rajeswari, Anindita Sinha Ray, Harihar Sahoo<br />
N<strong>at</strong>ional Accounts Division<br />
Central St<strong>at</strong>istical Organis<strong>at</strong>ion<br />
www.IndianJournals.com<br />
Members Copy, Not for Commercial Sale<br />
Downloaded From IP - 115.248.73.67 on d<strong>at</strong>ed 29-Nov-2010<br />
<strong>Capital</strong> form<strong>at</strong>ion is one <strong>of</strong> the important indic<strong>at</strong>ors for assessing the growth<br />
potential <strong>of</strong> the economy. For policy making <strong>at</strong> the st<strong>at</strong>e level and balanced regional<br />
development, estim<strong>at</strong>es <strong>of</strong> gross capital form<strong>at</strong>ion are required. It assesses the<br />
investments made in the st<strong>at</strong>e in public and priv<strong>at</strong>e sector. The first <strong>at</strong>tempt to<br />
examine the d<strong>at</strong>a availability <strong>at</strong> st<strong>at</strong>e level and to suggest compil<strong>at</strong>ion <strong>of</strong> capital<br />
form<strong>at</strong>ion <strong>at</strong> st<strong>at</strong>e level was made by the Regional Accounts Committee (RAC), set<br />
up in May 1972 under the chairmanship <strong>of</strong> Pr<strong>of</strong>. M. Mukherjee. The st<strong>at</strong>e level<br />
estim<strong>at</strong>es need to be compiled by the St<strong>at</strong>e DESs as suggested by the RAC. Presently<br />
only few st<strong>at</strong>es are compiling estim<strong>at</strong>es <strong>of</strong> GFCF fully/partly. The N<strong>at</strong>ional<br />
St<strong>at</strong>istical Commission (NSC) in its report have also recommended th<strong>at</strong> all the St<strong>at</strong>es<br />
should prepare estim<strong>at</strong>es <strong>of</strong> capital form<strong>at</strong>ion. Most <strong>of</strong> the st<strong>at</strong>es prepare estim<strong>at</strong>es<br />
<strong>of</strong> GFCF for public sector only as most st<strong>at</strong>es are already analyzing the budget<br />
documents and reports <strong>of</strong> public enterprises. GFCF <strong>of</strong> supra-regional sectors like<br />
railways, communic<strong>at</strong>ion, Banking and Insurance and Public administr<strong>at</strong>ion and<br />
Defence are prepared by the CSO and supplied to st<strong>at</strong>es annually. But the main<br />
concern is priv<strong>at</strong>e corpor<strong>at</strong>e sector and to some extent household sector. CSO has<br />
taken initi<strong>at</strong>ives to compile the estim<strong>at</strong>es <strong>of</strong> GFCF <strong>at</strong> st<strong>at</strong>e level, particularly for the<br />
priv<strong>at</strong>e sector using various sources <strong>of</strong> d<strong>at</strong>a. Recently, CSO compiled St<strong>at</strong>e wise<br />
estim<strong>at</strong>es <strong>of</strong> GFCF for the year 2004-05 and the same were discussed with the st<strong>at</strong>es<br />
during the regional workshops. In the present paper, estim<strong>at</strong>es <strong>of</strong> GFCF <strong>at</strong> st<strong>at</strong>e<br />
level have been prepared for the priv<strong>at</strong>e sector by different industry <strong>of</strong> use for the<br />
years 1999-2000 to 2005-06.<br />
I. Introduction<br />
Estim<strong>at</strong>es <strong>of</strong> capital form<strong>at</strong>ion can be prepared by following any <strong>of</strong> the three approaches:<br />
1. Production or commodity flow approach: in this approach the estim<strong>at</strong>es for entire<br />
country/st<strong>at</strong>es/regional economy is prepared on the basis <strong>of</strong> commodities flowing into<br />
various types <strong>of</strong> assets <strong>of</strong> the capital form<strong>at</strong>ion namely construction, machinery and<br />
s<strong>of</strong>tware.<br />
2. Saving and flow <strong>of</strong> funds approach: in this approach the estim<strong>at</strong>es <strong>of</strong> saving are prepared<br />
and then the net capital in flow from outside the region/st<strong>at</strong>e/country is added to get the<br />
total estim<strong>at</strong>es <strong>of</strong> capital form<strong>at</strong>ion.<br />
3. Expenditure approach: in this approach the expenditure incurred on acquiring fixed<br />
assets namely construction, machinery and s<strong>of</strong>tware is estim<strong>at</strong>ed and the estim<strong>at</strong>es <strong>of</strong><br />
GFCF is arrived <strong>at</strong>. To this change in stocks is added to obtain capital form<strong>at</strong>ion.<br />
At n<strong>at</strong>ional level, all the three approaches are currently adopted by the CSO. The RAC<br />
has recommended th<strong>at</strong> instead <strong>of</strong> GCF, st<strong>at</strong>es should compile the estim<strong>at</strong>es <strong>of</strong> GFCF only, as
28 The journal <strong>of</strong> income and wealth<br />
the estim<strong>at</strong>ion <strong>of</strong> change in stock is not conceptually viable or feasible <strong>at</strong> the st<strong>at</strong>e level due to<br />
open boundaries <strong>of</strong> the st<strong>at</strong>es. Moreover the estim<strong>at</strong>es <strong>of</strong> change in stock are subject to higher<br />
fluctu<strong>at</strong>ions. Thus, it was felt th<strong>at</strong> <strong>at</strong> the st<strong>at</strong>e level, GFCF would be a better indic<strong>at</strong>or <strong>of</strong> capital<br />
form<strong>at</strong>ion. For measurement <strong>of</strong> GFCF <strong>at</strong> st<strong>at</strong>e level, only expenditure approach can be adopted<br />
as the other two methods require d<strong>at</strong>a on imports and exports <strong>of</strong> capital goods across the st<strong>at</strong>e<br />
boundaries and net inflow <strong>of</strong> resources from outside the st<strong>at</strong>e, which are not available.<br />
www.IndianJournals.com<br />
Members Copy, Not for Commercial Sale<br />
Downloaded From IP - 115.248.73.67 on d<strong>at</strong>ed 29-Nov-2010<br />
Estim<strong>at</strong>es <strong>of</strong> GFCF <strong>at</strong> st<strong>at</strong>e level are not presently compiled by the CSO because <strong>of</strong> nonavailability<br />
<strong>of</strong> st<strong>at</strong>e-wise details on capital expenditures made by the two institutional sectors<br />
namely (I) priv<strong>at</strong>e corpor<strong>at</strong>e sector and (II) household sector. The only institutional sector for<br />
which GFCF estim<strong>at</strong>es are available is in respect <strong>of</strong> the public sector. Although d<strong>at</strong>a on GFCF<br />
in respect <strong>of</strong> the priv<strong>at</strong>e corpor<strong>at</strong>e sector <strong>at</strong> the n<strong>at</strong>ional level are available from the Studies <strong>of</strong><br />
Company Finances conducted by the RBI, such details are not available <strong>at</strong> st<strong>at</strong>e level due to the<br />
small sample size adopted by the RBI for these studies. Further, the blow-up factor adopted for<br />
the n<strong>at</strong>ional level estim<strong>at</strong>es is the paid-up capital (PUC), details <strong>of</strong> which are not available <strong>at</strong> st<strong>at</strong>e<br />
level. Similarly for the household sector, though d<strong>at</strong>a for benchmark years for pure households<br />
are available from the AIDIS, detailed d<strong>at</strong>a on GFCF for the unincorpor<strong>at</strong>ed enterprises are<br />
not available. The benchmark enterprise surveys conducted by the CSO/NSSO also do not<br />
give reliable estim<strong>at</strong>es <strong>of</strong> GFCF <strong>at</strong> st<strong>at</strong>e/regional level. Hence, the major bottlenecks in the<br />
compil<strong>at</strong>ion <strong>of</strong> st<strong>at</strong>e level GFCF refer to the priv<strong>at</strong>e corpor<strong>at</strong>e sector and household sector.<br />
However, in the recent years, CSO has taken initi<strong>at</strong>ives to compile the estim<strong>at</strong>es <strong>of</strong> GFCF<br />
<strong>at</strong> st<strong>at</strong>e level particularly for the priv<strong>at</strong>e sector using various sources <strong>of</strong> d<strong>at</strong>a. For public sector,<br />
inform<strong>at</strong>ion is available from budget documents and annual reports <strong>of</strong> public enterprises, to a<br />
large extent. The GFCF <strong>of</strong> supra-regional sectors like railways, communic<strong>at</strong>ion, Banking and<br />
Insurance, Public administr<strong>at</strong>ion and Defence and supra-regional part <strong>of</strong> central government<br />
administr<strong>at</strong>ion, central departmental commercial undertakings (DCUs) and central nondepartmental<br />
commercial undertakings (NDCUs), are prepared by the CSO and supplied to<br />
st<strong>at</strong>es annually. The estim<strong>at</strong>es <strong>of</strong> GFCF for the local bodies has been compiled by analysing the<br />
budgets <strong>of</strong> a sample <strong>of</strong> local bodies.<br />
In the case <strong>of</strong> priv<strong>at</strong>e sector, the method th<strong>at</strong> has been adopted is to distribute all India GFCF<br />
in the priv<strong>at</strong>e sector in respect <strong>of</strong> specific industries over the st<strong>at</strong>es using appropri<strong>at</strong>e indic<strong>at</strong>ors<br />
from various benchmark enterprise surveys conducted by the CSO and NSSO. Adopting this<br />
approach, CSO recently compiled St<strong>at</strong>e wise estim<strong>at</strong>es <strong>of</strong> GFCF for the year 2004-05 and the<br />
same were discussed with the st<strong>at</strong>es during the regional workshops. Moving forward in this<br />
direction, in the present paper, estim<strong>at</strong>es <strong>of</strong> GFCF <strong>at</strong> st<strong>at</strong>e level have been prepared for the<br />
priv<strong>at</strong>e sector by different industry <strong>of</strong> use for the years 1999-2000 to 2005-06 using the l<strong>at</strong>est<br />
available d<strong>at</strong>a.<br />
II. Approach for compil<strong>at</strong>ion <strong>of</strong> GFCF <strong>at</strong> the St<strong>at</strong>e level<br />
The whole st<strong>at</strong>e economy has been grouped into specified user industries on the same lines as<br />
done for the gross domestic product (GDP). Estim<strong>at</strong>es <strong>of</strong> the GFCF <strong>at</strong> st<strong>at</strong>e level can then be<br />
prepared separ<strong>at</strong>ely for the public sector, priv<strong>at</strong>e sector and supra-regional sectors. This is a<br />
slight devi<strong>at</strong>ion from the method adopted for the n<strong>at</strong>ional level estim<strong>at</strong>es to the extent th<strong>at</strong> the two<br />
institutions sectors, namely priv<strong>at</strong>e corpor<strong>at</strong>e sector and household sector are clubbed together
ESTIMATION OF CAPITAL FORMATION AT STATE LEVEL 29<br />
www.IndianJournals.com<br />
Members Copy, Not for Commercial Sale<br />
Downloaded From IP - 115.248.73.67 on d<strong>at</strong>ed 29-Nov-2010<br />
for the st<strong>at</strong>e level estim<strong>at</strong>es. GFCF <strong>of</strong> the priv<strong>at</strong>e sector can then be estim<strong>at</strong>ed by collecting d<strong>at</strong>a<br />
<strong>at</strong> regular periodic intervals, compiling s<strong>at</strong>isfactory benchmark estim<strong>at</strong>es in every few years and<br />
moving the same by means <strong>of</strong> appropri<strong>at</strong>e indic<strong>at</strong>ors or by alloc<strong>at</strong>ion <strong>of</strong> n<strong>at</strong>ional totals among<br />
the st<strong>at</strong>es by meaningful indic<strong>at</strong>ors.<br />
Priv<strong>at</strong>e sector comprises all non government joint stock companies, co-oper<strong>at</strong>ives societies,<br />
priv<strong>at</strong>e banks, priv<strong>at</strong>e insurance companies, quasi corpor<strong>at</strong>e bodies and household sector.<br />
The household sector includes, apart from individuals, all non-government, non-corpor<strong>at</strong>e<br />
enterprises like sole proprietorships and partnerships owned and/or controlled by individuals<br />
and non-pr<strong>of</strong>it institutions which furnish educ<strong>at</strong>ional, health, cultural, recre<strong>at</strong>ional and other<br />
social and community services to the households. Alloc<strong>at</strong>ion <strong>of</strong> expenditure on construction<br />
activity in the form <strong>of</strong> <strong>of</strong>f shore drilling for oil and N<strong>at</strong>ural gas like Bombay high have not been<br />
alloc<strong>at</strong>ed to any st<strong>at</strong>e as recommended by the RAC.<br />
The All India estim<strong>at</strong>es <strong>of</strong> GFCF by industry <strong>of</strong> use as published in NAS 2008 have been<br />
alloc<strong>at</strong>ed among the St<strong>at</strong>es using suitable indic<strong>at</strong>ors and using d<strong>at</strong>a sources as discussed in<br />
following paragraphs.<br />
III. Methodology<br />
Agriculture including livestock<br />
For preparing the estim<strong>at</strong>es <strong>of</strong> GFCF in Agriculture, results <strong>of</strong> All-India surveys on Debt<br />
and Investment (AIDIS) conducted in 2002-03 by the NSSO in the 59 th round have been used.<br />
This report gives the fixed capital expenditure on different items <strong>of</strong> farm business including<br />
livestock used as fixed assets. Firstly, the GFCF estim<strong>at</strong>es for household sector have been<br />
prepared on the basis <strong>of</strong> AIDIS results . Then the all India estim<strong>at</strong>es <strong>of</strong> Priv<strong>at</strong>e corpor<strong>at</strong>e sector<br />
have been distributed over st<strong>at</strong>es using the st<strong>at</strong>e level estim<strong>at</strong>es <strong>of</strong> Gross value Added (GVA) <strong>of</strong><br />
Agriculture for the year 2002-03. Then, for arriving <strong>at</strong> the estim<strong>at</strong>es for the other years, the sum<br />
<strong>of</strong> GFCF <strong>of</strong> household and priv<strong>at</strong>e corpor<strong>at</strong>e sector is moved forward and backward on the basis<br />
<strong>of</strong> st<strong>at</strong>e wise growth <strong>of</strong> GVA <strong>of</strong> agriculture industry.<br />
Forestry and logging<br />
Almost all forests are owned by the government and hence this industry is mainly covered by<br />
the public sector. However a small portion exists in the priv<strong>at</strong>e sector. The GFCF estim<strong>at</strong>es<br />
have been prepared on the basis <strong>of</strong> d<strong>at</strong>a available in the public<strong>at</strong>ion ‘Forestry St<strong>at</strong>istics in India,<br />
1996’. This report provides inform<strong>at</strong>ion on area under forest departments, corpor<strong>at</strong>e bodies<br />
and priv<strong>at</strong>e forest. The estim<strong>at</strong>e <strong>of</strong> n<strong>at</strong>ional level GFCF in the priv<strong>at</strong>e sector has been alloc<strong>at</strong>ed<br />
over the st<strong>at</strong>es on the basis <strong>of</strong> st<strong>at</strong>ewise inform<strong>at</strong>ion on ownership p<strong>at</strong>tern <strong>of</strong> corpor<strong>at</strong>e /priv<strong>at</strong>e<br />
bodies.<br />
Fishing<br />
The st<strong>at</strong>e-wise estim<strong>at</strong>es <strong>of</strong> GFCF have been obtained by alloc<strong>at</strong>ing the n<strong>at</strong>ional level estim<strong>at</strong>es<br />
using the st<strong>at</strong>e-wise fish production taken from Department <strong>of</strong> Animal Husbandry, Dairying<br />
and Fisheries, Ministry <strong>of</strong> Agriculture. Livestock Census provides inform<strong>at</strong>ion on number <strong>of</strong><br />
mechanized bo<strong>at</strong>s, traditional bo<strong>at</strong>s (motorized & non-motorised) and number <strong>of</strong> fishing gears.
30 The journal <strong>of</strong> income and wealth<br />
However, the ownership p<strong>at</strong>tern as well as value is not available, as such this inform<strong>at</strong>ion could<br />
not be utilized.<br />
Mining and Quarrying<br />
The GFCF estim<strong>at</strong>es have been prepared on the basis <strong>of</strong> Gross Value <strong>of</strong> Output (GVO) <strong>of</strong> the<br />
Minor and Major Minerals for household sector and priv<strong>at</strong>e corpor<strong>at</strong>e sector respectively.<br />
www.IndianJournals.com<br />
Members Copy, Not for Commercial Sale<br />
Downloaded From IP - 115.248.73.67 on d<strong>at</strong>ed 29-Nov-2010<br />
Manufacturing<br />
Annual survey <strong>of</strong> Industries (ASI) provides st<strong>at</strong>e wise estim<strong>at</strong>es <strong>of</strong> GFCF in the registered<br />
manufacturing sector. The n<strong>at</strong>ional level GFCF estim<strong>at</strong>es <strong>of</strong> the priv<strong>at</strong>e sector have been<br />
alloc<strong>at</strong>ed on the basis <strong>of</strong> st<strong>at</strong>e wise GFCF as available from ASI. GFCF estim<strong>at</strong>e for un<strong>org</strong>anized<br />
manufacturing sector have been prepared on the basis <strong>of</strong> survey results on un<strong>org</strong>anized<br />
manufacturing sector (NSS 56 th round for the years 1999-2000 to 2004-05 and 62 nd round for<br />
2005-06). Inform<strong>at</strong>ion on GVA and net additions in fixed assets available in the 56 th round<br />
survey have been utilized to prepare the estim<strong>at</strong>es for 2000-01 and moved forward to 2004-05<br />
on the basis <strong>of</strong> growth on GVA. For the year 2005-06, the inform<strong>at</strong>ion available from the 62 nd<br />
round survey have been used.<br />
Electricity, Gas and W<strong>at</strong>er Supply<br />
Under this sector capital investment made in the biogas plants and wind energy systems are<br />
covered under household sector. The estim<strong>at</strong>es <strong>of</strong> n<strong>at</strong>ional level GFCF in gas sub sector have<br />
been alloc<strong>at</strong>ed over the st<strong>at</strong>es on the basis <strong>of</strong> number <strong>of</strong> gobar gas plants constructed during<br />
the year. The d<strong>at</strong>a on st<strong>at</strong>e level capacity <strong>of</strong> wind energy has been utilized to alloc<strong>at</strong>e the all<br />
India estim<strong>at</strong>es <strong>of</strong> GFCF in wind energy over the st<strong>at</strong>es. Inform<strong>at</strong>ion available on cumul<strong>at</strong>ive<br />
achievement <strong>of</strong> the corresponding year from the Annual Report <strong>of</strong> Ministry <strong>of</strong> New and<br />
Renewable Energy has been used for this purpose. The GFCF estim<strong>at</strong>es rel<strong>at</strong>ing to electricity in<br />
the priv<strong>at</strong>e sector have been alloc<strong>at</strong>ed on the basis <strong>of</strong> GSDP estim<strong>at</strong>es.<br />
Construction<br />
The estim<strong>at</strong>es <strong>of</strong> priv<strong>at</strong>e sector GFCF in construction industry <strong>at</strong> all India level has been<br />
distributed among the st<strong>at</strong>es on the basis <strong>of</strong> st<strong>at</strong>e level inform<strong>at</strong>ion available on new constructions<br />
<strong>of</strong> NDCUs. Firstly, the new construction component <strong>of</strong> this sector has been alloc<strong>at</strong>ed over st<strong>at</strong>es<br />
on the basis <strong>of</strong> st<strong>at</strong>ewise d<strong>at</strong>a on new constructions <strong>of</strong> NDCUs. As all India estim<strong>at</strong>es under<br />
this sector includes investment in plants and machinery, the construction estim<strong>at</strong>es so obtained<br />
have been blown up to arrive <strong>at</strong> st<strong>at</strong>e wise GFCF assuming th<strong>at</strong> investment in new construction<br />
constitutes only thirty percent. This r<strong>at</strong>io is based on all India estim<strong>at</strong>es <strong>of</strong> priv<strong>at</strong>e corpor<strong>at</strong>e<br />
sector.<br />
Trade, Hotels & Restaurants, Transport by other means, Storage,<br />
Communic<strong>at</strong>ion, Real Est<strong>at</strong>e, Business Services & Other Services<br />
The survey on informal sector in India conducted by the NSSO in the 55 th round provides the<br />
st<strong>at</strong>e level inform<strong>at</strong>ion on net additions to fixed assets and gross value added <strong>of</strong> these industries<br />
during the year 1999-2000.On the basis <strong>of</strong> r<strong>at</strong>io <strong>of</strong> fixed capital to valued added, GFCF for the
ESTIMATION OF CAPITAL FORMATION AT STATE LEVEL 31<br />
year 1999-2000 have been worked out using respective GSDP estim<strong>at</strong>es. Thereafter, index <strong>of</strong><br />
value added for the years 2000-01 to 2005-06 with base 1999-2000 has been worked out for<br />
each st<strong>at</strong>e and the estim<strong>at</strong>es <strong>of</strong> GFCF worked out for 1999-2000 has been moved forward till<br />
the year 2005-06.<br />
Ownership <strong>of</strong> Dwellings<br />
The estim<strong>at</strong>es <strong>of</strong> GFCF in respect <strong>of</strong> Ownership <strong>of</strong> dwelling as published in the NAS 2008 have<br />
been alloc<strong>at</strong>ed using st<strong>at</strong>e level inform<strong>at</strong>ion available in AIDIS 2002-03.<br />
www.IndianJournals.com<br />
Members Copy, Not for Commercial Sale<br />
Downloaded From IP - 115.248.73.67 on d<strong>at</strong>ed 29-Nov-2010<br />
Supra regional sectors<br />
In the case <strong>of</strong> Banking and Insurance st<strong>at</strong>e wise d<strong>at</strong>a on construction and machinery and<br />
equipment for priv<strong>at</strong>e sector banks, Banking Department <strong>of</strong> RBI, Insurance corpor<strong>at</strong>ions and<br />
Central Financial corpor<strong>at</strong>ions, st<strong>at</strong>e-wise d<strong>at</strong>a on paid up capital for financial investment<br />
companies, annual reports <strong>of</strong> St<strong>at</strong>e financial corpor<strong>at</strong>ions, d<strong>at</strong>a supplied by NABARD in respect<br />
<strong>of</strong> regional rural banks and cooper<strong>at</strong>ive credit societies are used. In the case <strong>of</strong> communic<strong>at</strong>ion,<br />
the all India total priv<strong>at</strong>e sector GFCF <strong>of</strong> this sector has been distributed over st<strong>at</strong>es on the basis<br />
<strong>of</strong> st<strong>at</strong>ewise estim<strong>at</strong>es <strong>of</strong> public sector.<br />
IV. Conclusions<br />
It may be seen th<strong>at</strong> the estim<strong>at</strong>es <strong>of</strong> GFCF has been prepared entirely for the priv<strong>at</strong>e sector,<br />
r<strong>at</strong>her than distinguishing between priv<strong>at</strong>e corpor<strong>at</strong>e sector and household sector. Although the<br />
enterprise surveys are the ideal source, unfortun<strong>at</strong>ely the quality <strong>of</strong> capital form<strong>at</strong>ion d<strong>at</strong>a in<br />
these surveys is not good. Hence the d<strong>at</strong>a available from various surveys has been used as<br />
indic<strong>at</strong>ors for alloc<strong>at</strong>ing the all India totals. The altern<strong>at</strong>ive to this is to use capital output r<strong>at</strong>ios<br />
<strong>of</strong> public sector or capital output r<strong>at</strong>ios <strong>of</strong> priv<strong>at</strong>e sector <strong>at</strong> all-India level. The SDP and GDP<br />
d<strong>at</strong>a is available separ<strong>at</strong>ely for public and priv<strong>at</strong>e sectors and so is the estim<strong>at</strong>es <strong>of</strong> GFCF <strong>at</strong> all<br />
India level. The quality <strong>of</strong> the estim<strong>at</strong>es particularly for priv<strong>at</strong>e sector needs to be improved<br />
upon gradually. Once the st<strong>at</strong>e level d<strong>at</strong>a <strong>of</strong> GFCF in respect <strong>of</strong> priv<strong>at</strong>e corpor<strong>at</strong>e sector based<br />
on Studies <strong>of</strong> Company Finances conducted by the RBI becomes available, the quality <strong>of</strong> GFCF<br />
estim<strong>at</strong>es would improve to a gre<strong>at</strong> extent.<br />
References<br />
Central St<strong>at</strong>istical Organiz<strong>at</strong>ion, India (2008), N<strong>at</strong>ional Accounts St<strong>at</strong>istics 2008.<br />
Central St<strong>at</strong>istical Organis<strong>at</strong>ion, India (2007), N<strong>at</strong>ional Accounts St<strong>at</strong>istics: Sources and Methods.<br />
Commission <strong>of</strong> European Communities, Intern<strong>at</strong>ional Monetary Fund, Organis<strong>at</strong>ion for Economic Cooper<strong>at</strong>ion<br />
and Development, United N<strong>at</strong>ions and World Bank (1993), System <strong>of</strong> N<strong>at</strong>ional Accounts, 1993.<br />
N<strong>at</strong>ional Sample Survey Organiz<strong>at</strong>ion, India (2002-03), Report No- 504: Household <strong>Capital</strong> Expenditure; All<br />
India Debt and Investment Survey, 2002-03.<br />
Central St<strong>at</strong>istical Organiz<strong>at</strong>ion, India (2000), Annual survey <strong>of</strong> India (ASI).<br />
Central St<strong>at</strong>istical Organiz<strong>at</strong>ion, India (2001), Annual survey <strong>of</strong> India (ASI).<br />
Central St<strong>at</strong>istical Organiz<strong>at</strong>ion, India (2002), Annual survey <strong>of</strong> India (ASI).<br />
Central St<strong>at</strong>istical Organiz<strong>at</strong>ion, India (2003), Annual survey <strong>of</strong> India (ASI).<br />
Central St<strong>at</strong>istical Organiz<strong>at</strong>ion, India (2004), Annual survey <strong>of</strong> India (ASI).
32 The journal <strong>of</strong> income and wealth<br />
Central St<strong>at</strong>istical Organiz<strong>at</strong>ion, India (2005), Annual survey <strong>of</strong> India (ASI).<br />
Forest Survey <strong>of</strong> India (1999), The St<strong>at</strong>e <strong>of</strong> Forest Report.<br />
Indian Council <strong>of</strong> Forestry Research and Educ<strong>at</strong>ion (1999), Forestry St<strong>at</strong>istics in India, 1996.<br />
N<strong>at</strong>ional Sample Survey Organiz<strong>at</strong>ion, Government <strong>of</strong> India: Report No.480-Un<strong>org</strong>anized manufacturing<br />
sector in India (2000-01).<br />
N<strong>at</strong>ional Sample Survey Organiz<strong>at</strong>ion, Government <strong>of</strong> India – Report No. 525 – Un<strong>org</strong>anized manufacturing<br />
sector in India (2005-06)–Employment, assets & liabilities 15)N<strong>at</strong>ional Sample Survey Organiz<strong>at</strong>ion,<br />
Government <strong>of</strong> India Report No. 526-Un<strong>org</strong>anized manufacturing sector in India (2005-06)-Input, Output<br />
& Value added.<br />
www.IndianJournals.com<br />
Members Copy, Not for Commercial Sale<br />
Downloaded From IP - 115.248.73.67 on d<strong>at</strong>ed 29-Nov-2010<br />
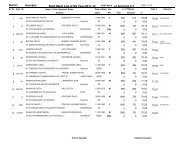
St<strong>at</strong>ewise Gross Fixed <strong>Capital</strong> <strong>Form<strong>at</strong>ion</strong> in the priv<strong>at</strong>e sector<br />
(<strong>at</strong> current prices)<br />
All Industries<br />
Rs. Crore<br />
Sl. No St<strong>at</strong>es 1999-00 2000-01 2001-02 2002-03 2003-04 2004-05 2005-06<br />
1 Andhra Pradesh 2<strong>16</strong>91 21788 25403 29115 35220 46882 60412<br />
2 Arunachal Pradesh 68 65 248 143 137 240 378<br />
3 Assam <strong>16</strong>29 5427 2568 2518 4435 4527 6384<br />
4 Bihar 2480 2982 3407 6563 2967 3857 5055<br />
5 Ch<strong>at</strong>tisgarh 1849 2846 8575 3350 6080 15059 24791<br />
6 Goa 2682 3010 3374 3683 3472 5458 10670<br />
7 Gujar<strong>at</strong> 377<strong>16</strong> 29312 57620 36372 45430 58582 70468<br />
8 Haryana 15749 15368 14776 19966 21478 32475 47801<br />
9 Himachal Pradesh 3131 2899 3314 4928 5506 6525 8973<br />
10 Jharkhand 1033 5830 2920 2793 4349 8749 12046<br />
11 Jammu & Kashmir 1503 <strong>16</strong>70 1887 2362 2459 3708 4787<br />
12 Karn<strong>at</strong>aka 27552 24751 27772 31323 34208 49832 59057<br />
13 Kerala 17961 18885 21521 25009 32247 37356 46156<br />
14 Madhya Pradesh 104<strong>16</strong> 10874 9375 11505 13481 192<strong>16</strong> 20977<br />
15 Maharashtra 58330 58352 62293 72001 92854 117293 142588<br />
<strong>16</strong> Manipur 397 396 554 575 666 900 1177<br />
17 Meghalaya 156 157 261 240 272 406 515<br />
18 Mizoram 71 <strong>16</strong>4 105 111 125 176 253<br />
19 Nagaland 106 357 <strong>16</strong>6 187 194 376 408<br />
20 Orissa 3394 7451 11291 11834 10541 12740 20919<br />
21 Punjab 10360 10632 10964 <strong>16</strong>128 15534 23328 28328<br />
22 Rajasthan 15960 14794 17607 18717 23938 30742 34019<br />
23 Sikkim 63 482 131 208 115 150 366<br />
24 Tamil Nadu 37391 41402 39133 52836 64172 85896 105023<br />
25 Tripura 144 674 180 217 282 322 332<br />
26 Uttar Pradesh 28962 28914 30741 37007 42728 55955 65635<br />
27 Uttaranchal 1756 2666 2684 2972 3955 6372 12030<br />
28 West Bengal 14636 17146 19837 22084 24319 37990 41083<br />
29 Andaman & N.I. 73 70 102 108 127 227 291<br />
30 Chandigarh 577 603 859 833 1072 1525 2198<br />
31 Dadra & Nagar H. 1150 1530 791 1541 1722 3272 4266<br />
32 Daman & Diu 906 1905 610 1106 1330 1847 1937<br />
33 Delhi 6200 7735 8269 10223 11722 <strong>16</strong>047 12655<br />
34 Lakshadweep 22 23 33 26 48 57 69<br />
35 Pondicherry 867 814 930 1248 1873 1202 1385<br />
37 Unalloc<strong>at</strong>ed 148 143 <strong>16</strong>6 195 220 3474 4218<br />
36 All India 327129 342118 390470 430028 509277 692762 857651
ESTIMATION OF CAPITAL FORMATION AT STATE LEVEL 33<br />
www.IndianJournals.com<br />
Members Copy, Not for Commercial Sale<br />
Downloaded From IP - 115.248.73.67 on d<strong>at</strong>ed 29-Nov-2010<br />
St<strong>at</strong>ewise Gross Fixed <strong>Capital</strong> <strong>Form<strong>at</strong>ion</strong> in the Priv<strong>at</strong>e Sector- Percentage Distribution<br />
Sl. No St<strong>at</strong>es 1999-00 2000-01 2001-02 2002-03 2003-04 2004-05 2005-06<br />
1 Andhra Pradesh 6.6 6.4 6.5 6.8 6.9 6.8 7.0<br />
2 Arunachal Pradesh 0.0 0.0 0.1 0.0 0.0 0.0 0.0<br />
3 Assam 0.5 1.6 0.7 0.6 0.9 0.7 0.7<br />
4 Bihar 0.8 0.9 0.9 1.5 0.6 0.6 0.6<br />
5 Ch<strong>at</strong>tisgarh 0.6 0.8 2.2 0.8 1.2 2.2 2.9<br />
6 Goa 0.8 0.9 0.9 0.9 0.7 0.8 1.2<br />
7 Gujar<strong>at</strong> 11.5 8.6 14.8 8.5 8.9 8.5 8.2<br />
8 Haryana 4.8 4.5 3.8 4.6 4.2 4.7 5.6<br />
9 Himachal Pradesh 1.0 0.8 0.8 1.1 1.1 0.9 1.0<br />
10 Jharkhand 0.3 1.7 0.7 0.6 0.9 1.3 1.4<br />
11 Jammu & Kashmir 0.5 0.5 0.5 0.5 0.5 0.5 0.6<br />
12 Karn<strong>at</strong>aka 8.4 7.2 7.1 7.3 6.7 7.2 6.9<br />
13 Kerala 5.5 5.5 5.5 5.8 6.3 5.4 5.4<br />
14 Madhya Pradesh 3.2 3.2 2.4 2.7 2.6 2.8 2.4<br />
15 Maharashtra 17.8 17.1 <strong>16</strong>.0 <strong>16</strong>.7 18.2 <strong>16</strong>.9 <strong>16</strong>.6<br />
<strong>16</strong> Manipur 0.1 0.1 0.1 0.1 0.1 0.1 0.1<br />
17 Meghalaya 0.0 0.0 0.1 0.1 0.1 0.1 0.1<br />
18 Mizoram 0.0 0.0 0.0 0.0 0.0 0.0 0.0<br />
19 Nagaland 0.0 0.1 0.0 0.0 0.0 0.1 0.0<br />
20 Orissa 1.0 2.2 2.9 2.8 2.1 1.8 2.4<br />
21 Punjab 3.2 3.1 2.8 3.8 3.1 3.4 3.3<br />
22 Rajasthan 4.9 4.3 4.5 4.4 4.7 4.4 4.0<br />
23 Sikkim 0.0 0.1 0.0 0.0 0.0 0.0 0.0<br />
24 Tamil Nadu 11.4 12.1 10.0 12.3 12.6 12.4 12.2<br />
25 Tripura 0.0 0.2 0.0 0.1 0.1 0.0 0.0<br />
26 Uttar Pradesh 8.9 8.5 7.9 8.6 8.4 8.1 7.7<br />
27 Uttaranchal 0.5 0.8 0.7 0.7 0.8 0.9 1.4<br />
28 West Bengal 4.5 5.0 5.1 5.1 4.8 5.5 4.8<br />
29 Andaman & N.I. 0.0 0.0 0.0 0.0 0.0 0.0 0.0<br />
30 Chandigarh 0.2 0.2 0.2 0.2 0.2 0.2 0.3<br />
31 Dadra & Nagar H. 0.4 0.4 0.2 0.4 0.3 0.5 0.5<br />
32 Daman & Diu 0.3 0.6 0.2 0.3 0.3 0.3 0.2<br />
33 Delhi 1.9 2.3 2.1 2.4 2.3 2.3 1.5<br />
34 Lakshadweep 0.0 0.0 0.0 0.0 0.0 0.0 0.0<br />
35 Pondicherry 0.3 0.2 0.2 0.3 0.4 0.2 0.2<br />
36 Unalloc<strong>at</strong>ed 0.0 0.0 0.0 0.0 0.0 0.5 0.5<br />
36 All India 100 100.0 100.0 100.0 100.0 100.0 100.0