Bratislava region (pdf, 390kB) - Sario
Bratislava region (pdf, 390kB) - Sario
Bratislava region (pdf, 390kB) - Sario

Create successful ePaper yourself
Turn your PDF publications into a flip-book with our unique Google optimized e-Paper software.
I Slovak Investment and Trade Development Agency<br />
HBPO<br />
Mobelix – XXX Lutz<br />
GBM Europe<br />
Automotive<br />
Furniture<br />
Logistics<br />
Front and End<br />
parts Assembly<br />
Distribution<br />
Centre<br />
Musical<br />
instruments<br />
Spain<br />
Germany<br />
Austria<br />
Schnellecke Logistic Logistic Germany<br />
DHL<br />
Logistics Park Senec<br />
Logistics Logistics Germany<br />
Gebruder Weiss 500<br />
Logistics Logistics Germany<br />
HOPI Logistics Logistics Slovakia<br />
Source: SARIO<br />
* informative data – exact data not available<br />
5. Foreign Direct Investment<br />
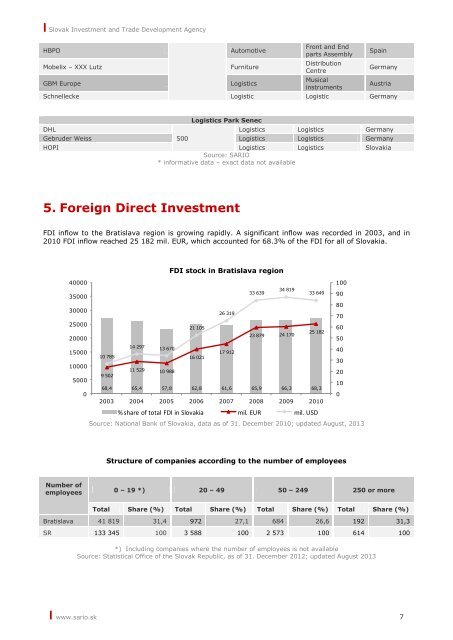
FDI inflow to the <strong>Bratislava</strong> <strong>region</strong> is growing rapidly. A significant inflow was recorded in 2003, and in<br />
2010 FDI inflow reached 25 182 mil. EUR, which accounted for 68.3% of the FDI for all of Slovakia.<br />
FDI stock in <strong>Bratislava</strong> <strong>region</strong><br />
40000<br />
35000<br />
33 639<br />
34 819<br />
33 649<br />
100<br />
90<br />
30000<br />
26 319<br />
80<br />
70<br />
25000<br />
20000<br />
21 105<br />
23 879 24 170<br />
25 182<br />
60<br />
50<br />
14 297 13 670<br />
15000<br />
17 912<br />
10 785<br />
16 021<br />
10000<br />
5000<br />
11 529<br />
9 502<br />
10 988<br />
20<br />
10<br />
68,4 65,4 57,8 62,8 61,6 65,9 66,3 68,3<br />
0<br />
0<br />
2003 2004 2005 2006 2007 2008 2009 2010<br />
% share of total FDI in Slovakia mil. EUR mil. USD<br />
Source: National Bank of Slovakia, data as of 31. December 2010; updated August, 2013<br />
40<br />
30<br />
Structure of companies according to the number of employees<br />
Number of<br />
employees 0 – 19 *) 20 – 49 50 – 249 250 or more<br />
Total Share (%) Total Share (%) Total Share (%) Total Share (%)<br />
<strong>Bratislava</strong> 41 819 31,4 972 27,1 684 26,6 192 31,3<br />
SR 133 345 100 3 588 100 2 573 100 614 100<br />
*) Including companies where the number of employees is not available<br />
Source: Statistical Office of the Slovak Republic, as of 31. December 2012; updated August 2013<br />
I www.sario.sk 7