World Drug Report 2005 - United Nations Office on Drugs and Crime
World Drug Report 2005 - United Nations Office on Drugs and Crime
World Drug Report 2005 - United Nations Office on Drugs and Crime

Create successful ePaper yourself
Turn your PDF publications into a flip-book with our unique Google optimized e-Paper software.
1. Trends in world drug markets The dynamics of the world drug market<br />
the last decade, last year’s increases were higher than<br />
average in all categories, except ATS, which was about<br />
the same. The reas<strong>on</strong>s for this surge are still unclear.<br />
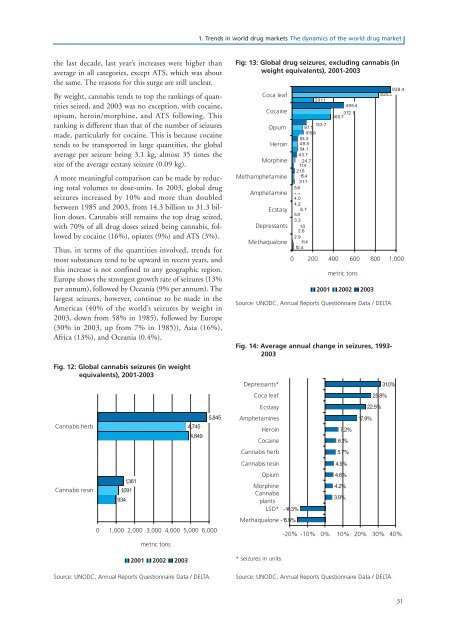
By weight, cannabis tends to top the rankings of quantities<br />
seized, <strong>and</strong> 2003 was no excepti<strong>on</strong>, with cocaine,<br />
opium, heroin/morphine, <strong>and</strong> ATS following. This<br />
ranking is different than that of the number of seizures<br />
made, particularly for cocaine. This is because cocaine<br />
tends to be transported in large quantities, the global<br />
average per seizure being 3.1 kg, almost 35 times the<br />
size of the average ecstasy seizure (0.09 kg).<br />
A more meaningful comparis<strong>on</strong> can be made by reducing<br />
total volumes to dose-units. In 2003, global drug<br />
seizures increased by 10% <strong>and</strong> more than doubled<br />
between 1985 <strong>and</strong> 2003, from 14.3 billi<strong>on</strong> to 31.3 billi<strong>on</strong><br />
doses. Cannabis still remains the top drug seized,<br />
with 70% of all drug doses seized being cannabis, followed<br />
by cocaine (16%), opiates (9%) <strong>and</strong> ATS (3%).<br />
Thus, in terms of the quantities involved, trends for<br />
most substances tend to be upward in recent years, <strong>and</strong><br />
this increase is not c<strong>on</strong>fined to any geographic regi<strong>on</strong>.<br />
Europe shows the str<strong>on</strong>gest growth rate of seizures (13%<br />
per annum), followed by Oceania (9% per annum). The<br />
largest seizures, however, c<strong>on</strong>tinue to be made in the<br />
Americas (40% of the world’s seizures by weight in<br />
2003, down from 58% in 1985), followed by Europe<br />
(30% in 2003, up from 7% in 1985)), Asia (16%),<br />
Africa (13%), <strong>and</strong> Oceania (0.4%).<br />
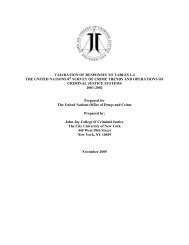
Fig. 12: Global cannabis seizures (in weight<br />
equivalents), 2001-2003<br />
Cannabis herb<br />
Cannabis resin<br />
934<br />
1,361<br />
1,091<br />
4,745<br />
4,849<br />
5,845<br />
0 1,000 2,000 3,000 4,000 5,000 6,000<br />
metric t<strong>on</strong>s<br />
2001 2002 2003<br />
Source: UNODC, Annual <str<strong>on</strong>g>Report</str<strong>on</strong>g>s Questi<strong>on</strong>naire Data / DELTA.<br />
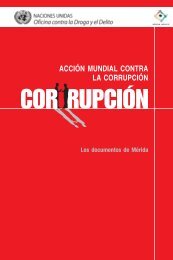
Fig: 13: Global drug seizures, excluding cannabis (in<br />
weight equivalents), 2001-2003<br />
Coca leaf<br />
Cocaine<br />
Opium<br />
Heroin<br />
Morphine<br />
Methamphetamine<br />
Amphetamine<br />
Ecstasy<br />
Depressants<br />
Methaqual<strong>on</strong>e<br />
201.1<br />
133.7<br />
97.1<br />
10 5.8<br />
53.3<br />
48.5<br />
54.1<br />
43.7<br />
24.7<br />
11.4<br />
21.6<br />
15.4<br />
21.1<br />
5.6<br />
4.4<br />
4.0<br />
4.2<br />
6.7<br />
5.0<br />
3.3<br />
1.0<br />
2.6<br />
2.9<br />
11.4<br />
10 .4<br />
495.4<br />
372.1<br />
365.7<br />
938.4<br />
825.3<br />
0 200 400 600 800 1,000<br />
metric t<strong>on</strong>s<br />
2001 2002 2003<br />
Source: UNODC, Annual <str<strong>on</strong>g>Report</str<strong>on</strong>g>s Questi<strong>on</strong>naire Data / DELTA.<br />
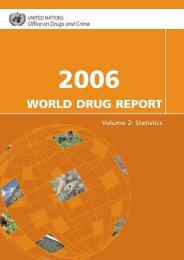
Fig. 14: Average annual change in seizures, 1993-<br />
2003<br />
Depressants*<br />
Coca leaf<br />
Ecstasy<br />
Amphetamines<br />
Heroin<br />
Cocaine<br />
Cannabis herb<br />
Cannabis resin<br />
Opium<br />
Morphine<br />
Cannabis<br />
plants<br />
LSD*<br />
-14.3%<br />
Methaqual<strong>on</strong>e -15.9%<br />
* seizures in units<br />
6.1%<br />
5.7%<br />
4.9%<br />
4.6%<br />
4.2%<br />
3.9%<br />
7.2%<br />
17.9%<br />
25.8%<br />
22.5%<br />
31.0%<br />
-20% -10% 0% 10% 20% 30% 40%<br />
Source: UNODC, Annual <str<strong>on</strong>g>Report</str<strong>on</strong>g>s Questi<strong>on</strong>naire Data / DELTA.<br />
31