2011/2012 ANNUAL REPORT - MaRS Discovery District
2011/2012 ANNUAL REPORT - MaRS Discovery District
2011/2012 ANNUAL REPORT - MaRS Discovery District

You also want an ePaper? Increase the reach of your titles
YUMPU automatically turns print PDFs into web optimized ePapers that Google loves.
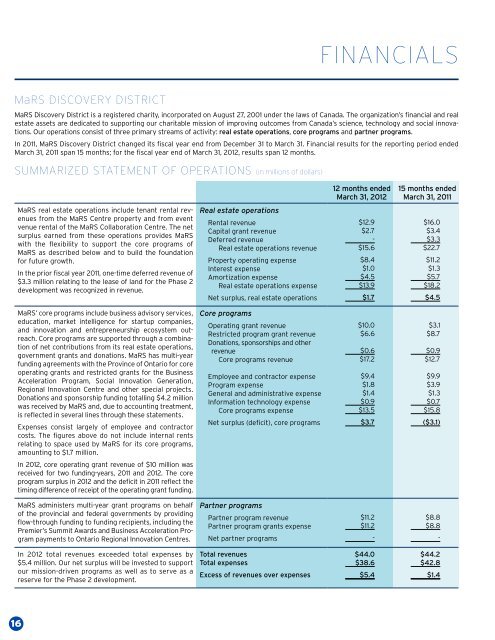
FINANCIALS<br />
<strong>MaRS</strong> <strong>Discovery</strong> <strong>District</strong><br />
<strong>MaRS</strong> <strong>Discovery</strong> <strong>District</strong> is a registered charity, incorporated on August 27, 2001 under the laws of Canada. The organization’s financial and real<br />
estate assets are dedicated to supporting our charitable mission of improving outcomes from Canada’s science, technology and social innovations.<br />
Our operations consist of three primary streams of activity: real estate operations, core programs and partner programs.<br />
In <strong>2011</strong>, <strong>MaRS</strong> <strong>Discovery</strong> <strong>District</strong> changed its fiscal year end from December 31 to March 31. Financial results for the reporting period ended<br />
March 31, <strong>2011</strong> span 15 months; for the fiscal year end of March 31, <strong>2012</strong>, results span 12 months.<br />
Summarized Statement of Operations (in millions of dollars)<br />
12 months ended<br />
March 31, <strong>2012</strong><br />
15 months ended<br />
March 31, <strong>2011</strong><br />
<strong>MaRS</strong> real estate operations include tenant rental revenues<br />
from the <strong>MaRS</strong> Centre property and from event<br />
venue rental of the <strong>MaRS</strong> Collaboration Centre. The net<br />
surplus earned from these operations provides <strong>MaRS</strong><br />
with the flexibility to support the core programs of<br />
<strong>MaRS</strong> as described below and to build the foundation<br />
for future growth.<br />
In the prior fiscal year <strong>2011</strong>, one-time deferred revenue of<br />
$3.3 million relating to the lease of land for the Phase 2<br />
development was recognized in revenue.<br />
Real estate operations<br />
Rental revenue<br />
Capital grant revenue<br />
Deferred revenue<br />
Real estate operations revenue<br />
Property operating expense<br />
Interest expense<br />
Amortization expense<br />
Real estate operations expense<br />
Net surplus, real estate operations<br />
$12.9<br />
$2.7<br />
-<br />
$15.6<br />
$8.4<br />
$1.0<br />
$4.5<br />
$13.9<br />
$1.7<br />
$16.0<br />
$3.4<br />
$3.3<br />
$22.7<br />
$11.2<br />
$1.3<br />
$5.7<br />
$18.2<br />
$4.5<br />
<strong>MaRS</strong>’ core programs include business advisory services,<br />
education, market intelligence for startup companies,<br />
and innovation and entrepreneurship ecosystem outreach.<br />
Core programs are supported through a combination<br />
of net contributions from its real estate operations,<br />
government grants and donations. <strong>MaRS</strong> has multi-year<br />
funding agreements with the Province of Ontario for core<br />
operating grants and restricted grants for the Business<br />
Acceleration Program, Social Innovation Generation,<br />
Regional Innovation Centre and other special projects.<br />
Donations and sponsorship funding totalling $4.2 million<br />
was received by <strong>MaRS</strong> and, due to accounting treatment,<br />
is reflected in several lines through these statements.<br />
Expenses consist largely of employee and contractor<br />
costs. The figures above do not include internal rents<br />
relating to space used by <strong>MaRS</strong> for its core programs,<br />
amounting to $1.7 million.<br />
In <strong>2012</strong>, core operating grant revenue of $10 million was<br />
received for two funding-years, <strong>2011</strong> and <strong>2012</strong>. The core<br />
program surplus in <strong>2012</strong> and the deficit in <strong>2011</strong> reflect the<br />
timing difference of receipt of the operating grant funding.<br />
Core programs<br />
Operating grant revenue<br />
Restricted program grant revenue<br />
Donations, sponsorships and other<br />
revenue<br />
Core programs revenue<br />
Employee and contractor expense<br />
Program expense<br />
General and administrative expense<br />
Information technology expense<br />
Core programs expense<br />
Net surplus (deficit), core programs<br />
$10.0<br />
$6.6<br />
$0.6<br />
$17.2<br />
$9.4<br />
$1.8<br />
$1.4<br />
$0.9<br />
$13.5<br />
$3.7<br />
$3.1<br />
$8.7<br />
$0.9<br />
$12.7<br />
$9.9<br />
$3.9<br />
$1.3<br />
$0.7<br />
$15.8<br />
($3.1)<br />
<strong>MaRS</strong> administers multi-year grant programs on behalf<br />
of the provincial and federal governments by providing<br />
flow-through funding to funding recipients, including the<br />
Premier’s Summit Awards and Business Acceleration Program<br />
payments to Ontario Regional Innovation Centres.<br />
Partner programs<br />
Partner program revenue<br />
Partner program grants expense<br />
Net partner programs<br />
$11.2<br />
$11.2<br />
-<br />
$8.8<br />
$8.8<br />
-<br />
In <strong>2012</strong> total revenues exceeded total expenses by<br />
$5.4 million. Our net surplus will be invested to support<br />
our mission-driven programs as well as to serve as a<br />
reserve for the Phase 2 development.<br />
Total revenues<br />
Total expenses<br />
Excess of revenues over expenses<br />
$44.0<br />
$38.6<br />
$5.4<br />
$44.2<br />
$42.8<br />
$1.4<br />
16