- Page 1 and 2:
2009 EDITION The European Union at
- Page 3 and 4:
2009 Edition Fact
- Page 5:
Note to readers This 2009 edition o
- Page 9 and 10:
Contents 1 1.1. Historical evolutio
- Page 11:
5 Economic and monetary union 5.1.
- Page 15 and 16:
1 How the European Union works 1 Hi
- Page 17 and 18:
1 How the European Union works 1 Hi
- Page 19 and 20:
1 How the European Union works 1 Hi
- Page 21 and 22:
1 How the European Union works 1 Hi
- Page 23 and 24:
1 How the European Union works 1 Hi
- Page 25 and 26:
1 How the European Union works 1 Hi
- Page 27 and 28:
1 How the European Union works 1 Hi
- Page 29 and 30:
1 How the European Union works 1 Hi
- Page 31 and 32:
1 How the European Union works 1 Hi
- Page 33 and 34:
1 How the European Union works 1 Hi
- Page 35 and 36:
1 How the European Union works 2 Ma
- Page 37 and 38:
1 How the European Union works 2 Ma
- Page 39 and 40:
1 How the European Union works 2 Ma
- Page 41 and 42:
1 How the European Union works 3 Eu
- Page 43 and 44:
1 How the European Union works 3 Eu
- Page 45 and 46:
1 How the European Union works 3 Eu
- Page 47 and 48:
1 How the European Union works 3 Eu
- Page 49 and 50:
1 How the European Union works 3 Eu
- Page 51 and 52:
1 How the European Union works 3 Eu
- Page 53 and 54:
1 How the European Union works 3 Eu
- Page 55 and 56:
1 How the European Union works 3 Eu
- Page 57 and 58:
1 How the European Union works 3 Eu
- Page 59 and 60:
1 How the European Union works 3 Eu
- Page 61 and 62:
1 How the European Union works 3 Eu
- Page 63 and 64:
1 How the European Union works 3 Eu
- Page 65 and 66:
1 How the European Union works 3 Eu
- Page 67 and 68:
1 How the European Union works 3 Eu
- Page 69 and 70:
1 How the European Union works 3 Eu
- Page 71 and 72:
1 How the European Union works 4 De
- Page 73 and 74:
1 How the European Union works 4 De
- Page 75 and 76:
1 How the European Union works 4 De
- Page 77 and 78:
1 How the European Union works 4 De
- Page 79 and 80:
1 How the European Union works 4 De
- Page 81 and 82:
1 How the European Union works 5 Fi
- Page 83 and 84:
1 How the European Union works 5 Fi
- Page 85 and 86:
1 How the European Union works 5 Fi
- Page 87 and 88:
1 How the European Union works 5 Fi
- Page 89 and 90:
1 How the European Union works 5 Fi
- Page 91:
2 6 1 How the European Union works
- Page 94 and 95:
— entitlement to effective legal
- Page 96 and 97:
2.2. The citizens of the Union and
- Page 98 and 99:
of the internal market, in which it
- Page 100 and 101:
the EU-25 Member States to introduc
- Page 102 and 103:
2.4. Voting rights and eligibility
- Page 104 and 105:
of the Member State concerned, as t
- Page 107:
3 How the European Union 1 works 4
- Page 110 and 111:
— the elimination of physical fro
- Page 112 and 113:
3.2. The main freedoms of the inter
- Page 114 and 115:
EEC. Under this approach the guidin
- Page 116 and 117:
Certain advantages specific to Unio
- Page 118 and 119:
— a proposal for a directive on t
- Page 120 and 121:
No 2157/2001 on the statute for a E
- Page 122 and 123:
— purchases of securities that ar
- Page 124 and 125:
3.3. Rules of competition 3.3.1. Ge
- Page 126 and 127:
ceilings for all the undertakings c
- Page 128 and 129:
— It is to enable more effective
- Page 130 and 131:
emergencies. For this reason the EC
- Page 132 and 133:
On 7 May 1998, horizontal aid becam
- Page 134 and 135:
The regimes based on special and ex
- Page 136 and 137:
In its resolution of 14 January 200
- Page 138 and 139:
and Decisions 93/676/EEC, 97/367/EC
- Page 140 and 141:
— The aim is also to guarantee le
- Page 142 and 143:
— a proposal for a directive on t
- Page 144 and 145:
The committee proposed a range of r
- Page 146 and 147:
Implementation of the directive is
- Page 148 and 149:
3.4.5. Intellectual, industrial and
- Page 150 and 151:
4. Efforts to combat counterfeiting
- Page 152 and 153:
4.7. Trans-European networks, 236 4
- Page 154 and 155:
— reform of State aid policy; —
- Page 156 and 157:
4.2. Common agricultural policy 4.2
- Page 158 and 159:
and other committees (socioeconomic
- Page 160 and 161:
policy and aid); EUR 14 billion ear
- Page 162 and 163:
— an external heading, with an ex
- Page 164 and 165:
4.2.4. The first pillar of the CAP:
- Page 166 and 167:
existing coupled aid be eliminated
- Page 168 and 169:
— support to improve the economic
- Page 170 and 171:
Guarantee Section and the Guidance
- Page 172 and 173:
increase its impact on compulsory e
- Page 174 and 175:
As far as tariff quotas are concern
- Page 176 and 177:
2004, which set out the key princip
- Page 178 and 179:
4.2.9. The CAP and the Treaty of Li
- Page 180 and 181:
Union’s activity. It should be re
- Page 182 and 183:
Table III — Basic agri-environmen
- Page 184 and 185:
Table V — Trade in agricultural a
- Page 186 and 187:
funds (EDF) and headings in the EU
- Page 188 and 189:
— the implementation of internati
- Page 190 and 191:
management measures based on total
- Page 192 and 193:
the baselines, where Member States
- Page 194 and 195:
4.4.3. Fisheries structural assista
- Page 196 and 197:
d. Fisheries partnership agreements
- Page 198 and 199:
with Norway represents more than 60
- Page 200 and 201:
1. Cooperation between Member State
- Page 202 and 203:
The enlargement of 2004 caused an 8
- Page 204 and 205:
It also reformed the decision-makin
- Page 206 and 207:
4.5.2. The European Regional Develo
- Page 208 and 209:
Parliament also succeeded in retain
- Page 210 and 211:
and their interoperability, road an
- Page 212 and 213:
Community financial assistance is p
- Page 214 and 215:
(COM(95) 961) dealt with the extern
- Page 216 and 217:
previously, transport between two M
- Page 218 and 219:
decide to provide public passenger
- Page 220 and 221:
1998 on the recognition of the dist
- Page 222 and 223:
4.6.4. Road traffic and safety prov
- Page 224 and 225:
4.6.5. Air transport: market access
- Page 226 and 227:
formation of global alliances. As w
- Page 228 and 229:
chances for new competitors, as wel
- Page 230 and 231:
components. Firstly, it proposes se
- Page 232 and 233:
country which call at Community por
- Page 234 and 235:
Memorandum of Understanding) if pre
- Page 236 and 237:
ecently focused on the promotion of
- Page 238 and 239:
In its resolution of 26 October 200
- Page 240 and 241:
European energy networks (TEN-E). T
- Page 242 and 243:
— demonstration that the project
- Page 244 and 245:
4.8. Industrial policy 4.8.1. Gener
- Page 246 and 247:
— The resolution of 13 June 2002
- Page 248 and 249:
Czech Republic held meetings with t
- Page 250 and 251:
the country’s leadership in the i
- Page 252 and 253:
which employs more than 2 million p
- Page 254 and 255:
4.8.5. The chemicals and pharmaceut
- Page 256 and 257:
completed by an ‘Inventory and co
- Page 258 and 259:
Following a broad consultation proc
- Page 260 and 261:
In October 2003 Parliament adopted
- Page 262 and 263:
provided that the scheduled duratio
- Page 264 and 265:
networks’ could provide an opport
- Page 266 and 267:
applications. By mid-2008 the Commi
- Page 268 and 269:
focus on the issues of information
- Page 270 and 271:
Directive 98/44/EC on the legal pro
- Page 272 and 273:
need to implement an EU strategy to
- Page 274 and 275:
(ex Articles 117 and 118) Member St
- Page 276 and 277:
With a view to enhancing the qualit
- Page 278 and 279:
4.9.2. The European Social Fund The
- Page 280 and 281:
The co-financing by the ESF may var
- Page 282 and 283:
— Recommendations: the Council ma
- Page 284 and 285:
4.9.4. Social security cover in oth
- Page 286 and 287:
— Expansion of the fields of soci
- Page 288 and 289:
health and safety. One of the corne
- Page 290 and 291:
the involvement of social partners
- Page 292 and 293:
Objectives The Community supports a
- Page 294 and 295:
protection of self-employed women d
- Page 296 and 297:
4.9.8. Anti-discrimination and soci
- Page 298 and 299:
social exclusion as an objective of
- Page 300 and 301:
4.10. Environment policy 4.10.1. En
- Page 302 and 303:
as LIFE, the ‘Urban’ programme,
- Page 304 and 305:
2. Public participation in decision
- Page 306 and 307:
problems. However, market forces ca
- Page 308 and 309:
defines the objectives for integrat
- Page 310 and 311:
achieved by disposing of waste at a
- Page 312 and 313:
incineration facility should be con
- Page 314 and 315:
C. Conservation and protection of t
- Page 316 and 317:
In November 2006, Parliament adopte
- Page 318 and 319:
2012, a reduction of around 25 % fr
- Page 320 and 321:
does not include any legal requirem
- Page 322 and 323:
(see below). In addition, halting t
- Page 324 and 325:
consequences of climate change, whi
- Page 326 and 327:
Environment and LIFE-Third countrie
- Page 328 and 329:
European Union’s ever increasing
- Page 330 and 331:
(COM(2006) 388) for a regulation to
- Page 332 and 333:
the Green Paper calls for the invol
- Page 334 and 335:
Furthermore, the EP felt that the s
- Page 336 and 337:
the scientific committees are now p
- Page 338 and 339:
warning or identified by a visual s
- Page 340 and 341:
4.11.3. Public health The Treaty of
- Page 342 and 343:
involve all Member States as well a
- Page 344 and 345:
c. Police and judicial cooperation
- Page 346 and 347:
4.12.2. Asylum and immigration poli
- Page 348 and 349:
concerning Member States’ measure
- Page 350 and 351:
The EP actively supports the introd
- Page 352 and 353:
action plans: one of general scope
- Page 354 and 355:
Operational Cooperation at the Exte
- Page 356 and 357:
in criminal matters, underlines the
- Page 358 and 359:
4.12.5. Police and customs cooperat
- Page 360 and 361:
organisation, a list of organisatio
- Page 362 and 363:
electricity and gas for all consume
- Page 364 and 365:
future of energy in the EU and part
- Page 366 and 367:
entered into force on 1 July 1987,
- Page 368 and 369:
detailed proposal. Projects are sel
- Page 370 and 371:
4.15. Small and medium-sized enterp
- Page 372 and 373:
considerable impact on the complian
- Page 374 and 375:
are needed to help organise and dev
- Page 376 and 377:
4.17. Culture and education 4.17.1.
- Page 378 and 379:
EC of 15 November 2006). The progra
- Page 380 and 381:
4.17.2. Youth policy Youth policy i
- Page 382 and 383:
c. Youth and media Youth protection
- Page 384 and 385:
multicultural communication through
- Page 386 and 387:
Article 151 makes it possible to su
- Page 388 and 389:
the Lisbon strategy. Promoting cult
- Page 390 and 391:
markets. A series of important merg
- Page 392 and 393:
Minors should be protected from the
- Page 394 and 395:
situation can only be improved by i
- Page 396 and 397:
final). The main significance of th
- Page 398 and 399:
administration, to facilitate impor
- Page 400 and 401: Since the need for unanimity in Cou
- Page 402 and 403: anomalies. Finally, Directive 2006/
- Page 404 and 405: — a minimum standard rate of 15 %
- Page 406 and 407: Commission then had not made any pr
- Page 408 and 409: 4.18.4. Taxation of energy Various
- Page 410 and 411: discussions, which preceded the ado
- Page 412 and 413: way of harmonisation would probably
- Page 414 and 415: — During the transitional period
- Page 417 and 418: 5 Economic and monetary union 1 The
- Page 419 and 420: 5 Economic and monetary union 1 The
- Page 421 and 422: 5 Economic and monetary union 2 The
- Page 423 and 424: 5 Economic and monetary union 2 The
- Page 425 and 426: 5 Economic and monetary union 3 Eur
- Page 427 and 428: 5 Economic and monetary union 4 Coo
- Page 429 and 430: 5 Economic and monetary union 4 Coo
- Page 431 and 432: 5 Economic and monetary union 5 Fra
- Page 433 and 434: 5 Economic and monetary union 5 Fra
- Page 435: 6 1 How the European Union works 3
- Page 438 and 439: B. The Maastricht Treaty (1992) The
- Page 440 and 441: 6.1.2. Defending human rights and d
- Page 442 and 443: the EU-Africa strategic partnership
- Page 444 and 445: — to strengthen the security of t
- Page 446 and 447: confirmed the EU’s ability to con
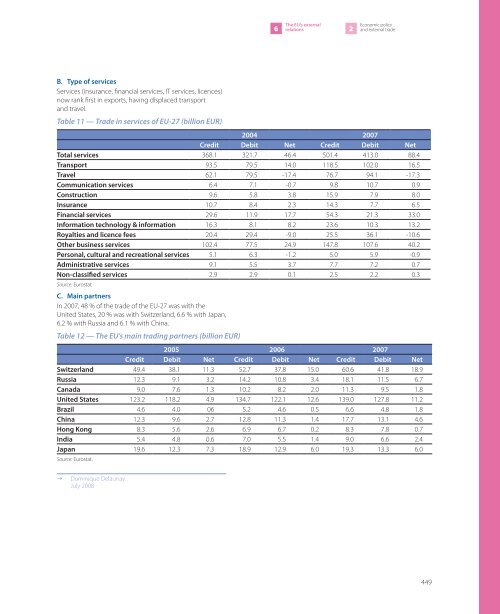
- Page 448 and 449: — 1.3 % to 11.2 % of exports; —
- Page 452 and 453: 6.2.2. The European Union and the W
- Page 454 and 455: 4. 2002-03 Following the Doha Confe
- Page 456 and 457: 6.3. Framework for relations with c
- Page 458 and 459: countries (the Czech Republic, Esto
- Page 460 and 461: 3. Other western Balkan countries T
- Page 462 and 463: . The 10 new Member States that joi
- Page 464 and 465: 2. Monitoring the extension of Comm
- Page 466 and 467: intended to be valid for three year
- Page 468 and 469: Council meetings reiterated that th
- Page 470 and 471: former Federal Republic of Yugoslav
- Page 472 and 473: 6.4.2. The Russian Federation A str
- Page 474 and 475: etween the economies and societies
- Page 476 and 477: Europe and central Asia in connecti
- Page 478 and 479: Background A number of developments
- Page 480 and 481: and dialogue on international issue
- Page 482 and 483: — the Euro-Mediterranean Civil Fo
- Page 484 and 485: individual State, i.e. not with the
- Page 486 and 487: parallel with progress on political
- Page 488 and 489: production and aircraft building (B
- Page 490 and 491: 2. Relations with the Rio Group and
- Page 492 and 493: On 8 November 2006 the first of the
- Page 494 and 495: and alternating between venues with
- Page 496 and 497: Commission adopted a communication
- Page 498 and 499: etween the EU and the countries of
- Page 500 and 501:
delivered through the UN and NGOs o
- Page 502 and 503:
(resolution of 23 October 2003). On
- Page 504 and 505:
c. A first-ever EU-ASEAN summit too
- Page 506 and 507:
3. Although not a participant of th
- Page 508 and 509:
6. Environment On the basis of the
- Page 510 and 511:
political framework has been redefi
- Page 512 and 513:
2007 GSP preferential imports (mill
- Page 514 and 515:
within 72 hours and up to EUR 10 mi
- Page 516 and 517:
As the institution for adopting the
- Page 518 and 519:
State is to accept the repatriation
- Page 521:
European Parliament Fact</s


