Weather - Saudi Aramco
Weather - Saudi Aramco
Weather - Saudi Aramco

You also want an ePaper? Increase the reach of your titles
YUMPU automatically turns print PDFs into web optimized ePapers that Google loves.
20 <strong>Saudi</strong> <strong>Aramco</strong> Dimensions<br />
SANDSTORM PHOTOS BY DOUGLAS J. HORN
For <strong>Saudi</strong> <strong>Aramco</strong>, Mother Nature is a critical<br />
project-management concern<br />
WRITTEN BY MARGOT RAWLINGS<br />
It’s the day after the first heavy<br />
winter rains, and the world feels<br />
cleansed and fresh. The color has<br />
returned, the leaves are<br />
green and the roof tiles<br />
are terracotta once more<br />
in the familiar, seasonal<br />
rhythms of weather.<br />
The desert flora will be erupting in its intermittent<br />
splendor and the fragile ecology will survive<br />
another cycle. It feels like a new beginning for us<br />
all. Right now, I worry that my children are dressed<br />
warmly enough for the cold winds on<br />
the school playground, and while I’m<br />
procrastinating about washing the<br />
A <strong>Saudi</strong> <strong>Aramco</strong> employee checks the<br />
<strong>Weather</strong>Now Web site on the company’s<br />
intranet system. The site provides<br />
Kingdom-wide weather reports and data.<br />
Summer 2009 21
In the pursuit of operational excellence, <strong>Saudi</strong> <strong>Aramco</strong><br />
has developed a meteorological system that continuously<br />
delivers accurate weather and air-quality information<br />
across the Kingdom in real-time.<br />
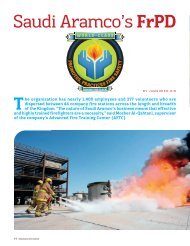
<strong>Weather</strong> can cause all kinds of problems,<br />
such as safety issues related to wind<br />
(photo at left), and electrical power<br />
transmission flaws caused by airborne<br />
dust and sand (below).<br />
22 <strong>Saudi</strong> <strong>Aramco</strong> Dimensions<br />
SANDSTORM PHOTOS BY DOUGLAS J. HORN
esultant mud crust off my car, I remind myself how shortlived<br />
this season will be — and how soon we will once<br />
more be immersed in the Peninsula’s relentless, searing heat.<br />
It doesn’t matter where you live on Earth, no one and<br />
nothing escapes the weather — we just adjust to its differing<br />
extremes. We all understand the effect of <strong>Saudi</strong> Arabia’s climate<br />
on us personally, but the weather plays a significant but<br />
less self-evident role in most of <strong>Saudi</strong> <strong>Aramco</strong>’s operations.<br />
For example, high ambient air temperatures cause energy<br />
loss during overhead power transmission. Pilots of both aircraft<br />
and ships watch the wind to ensure smooth navigation<br />
with optimal fuel use. Similarly, heavy-lift crane operations<br />
are instantly suspended if the winds exceed threshold safety<br />
values. During emergency drills, the wind direction must be<br />
known to safely evacuate personnel. Indeed, wind direction is<br />
constantly monitored throughout the company.<br />
<strong>Saudi</strong> <strong>Aramco</strong> has been monitoring the weather since the<br />
1930s. In those days, daily readings were taken manually and<br />
written up in notebooks. The first automation came with the<br />
introduction of a timer-based mechanical drum that tracked<br />
temperature swings throughout the day. It wasn’t until the<br />
early 1980s that data gathering became “semi-automated” in<br />
Summer 2009 23
esponse to the company’s need to monitor its emissions<br />
within the air-quality standards set by the Kingdom’s<br />
Presidency for Meteorology and Environment.<br />
At that time, the data was recorded in stand-alone data<br />
files, connected to an electronic data logger at each remote<br />
station. These files needed to be physically gathered from the<br />
field on floppy discs, driven back to Dhahran and manually<br />
consolidated into spreadsheets for analysis.<br />
The next advance was to use onsite modems and longdistance<br />
phone calls to retrieve the data at regular intervals.<br />
Although more convenient than site visits, this system was<br />
prone to technical problems. During this era of semi-automated<br />
consolidation of data for the annual environmental reports<br />
took several months. Responding to ad hoc data requests<br />
from facility planners, engineers and others was a significant<br />
challenge due to the collation, quality assurance and reformatting<br />
required.<br />
Modern-day assessment of the weather has come a long<br />
way from the days of drum recorders and floppy discs. In<br />
the pursuit of operational excellence, <strong>Saudi</strong> <strong>Aramco</strong> has<br />
developed a meteorological system that continuously delivers<br />
accurate weather and air-quality information across the<br />
Kingdom in real-time.<br />
In a search for full automation, the Environmental<br />
Protection Department (EPD) approached the e-Map Division<br />
of Information Technology in 2002. The goal was to replace<br />
the isolated “data pockets” with a single database and exploit<br />
the on-demand data reporting capabilities of the Internet.<br />
EPD sought to leverage the data to ease their annual reporting<br />
requirements, and also to allow easy access to other<br />
organizations. For e-Map Division and Information Technology<br />
(IT), the data was a vital part of several real-time emergencyresponse<br />
applications that were being developed. The stage<br />
for innovation was set.<br />
Peter O’Regan, an IT expert from e-Map Division, and<br />
Daniel Beard, an environmental specialist from EPD, led<br />
the project.<br />
As Beard explains, “Like all creative projects, this system<br />
has evolved gradually to capitalize on improvements in the<br />
<strong>Saudi</strong> <strong>Aramco</strong> specialists monitor<br />
the weather to insure safety<br />
and efficiency for company<br />
operations in the air and sea,<br />
and on land.<br />
24 <strong>Saudi</strong> <strong>Aramco</strong> Dimensions
Adesert by definition receives less than 10 inches of rain each<br />
year. Here in <strong>Saudi</strong> Arabia, we tend to average around one to<br />
two inches. Granted, some years we receive four inches, but in<br />
other years precipitation is negligible, and that situation hasn’t altered<br />
since records began.<br />
The prevailing wind direction is consistently northwest, and<br />
its form and force are largely influenced by global pressure<br />
systems such as the Himalayan monsoon system centered<br />
over the Asian subcontinent. For the most part, the location<br />
of that wind system is semi-permanent, but it does move<br />
around a little depending on what is happening with<br />
the weather system to the north and<br />
south of our location. A shift north<br />
may draw in warm humid<br />
warm air from the<br />
south and if<br />
the low-pressure system moves south,<br />
we see drier northerly winds. But this feature<br />
of our climate is there year after year and is<br />
closely aligned to global trends and known weather<br />
systems. One of the unavoidable features of the<br />
local climate is humidity. We all know what humidity<br />
is, right? Well, actually, probably not. Humidity is<br />
quite a difficult concept to grasp. We are all probably<br />
familiar with the term usually used by television weather<br />
presenters — “relative humidity” — so let’s start there.<br />
When we get up on a hot-and-sticky summer’s morning,<br />
and the temperature is 90° Fahrenheit (F) and the relative<br />
humidity is reported as 90 percent, we can feel the water<br />
vapor in the air. So why when the temperature rises to 100°F<br />
and the reported relative humidity drops to 70 percent do<br />
we not feel any less sticky? Well, because the rising temperature<br />
has increased the air’s ability to support water vapor.<br />
Therefore the rise in temperature has not reduced the<br />
water vapor in the air; it has just expanded the air’s ability to<br />
support more. So we still feel that oppressive mist around us.<br />
Oh, and we feel unpleasantly hot because we cool ourselves<br />
by sweating, and when the air’s water-vapor content is high<br />
this system doesn’t work as efficiently.<br />
Relative humidity is a measure of how much water is in<br />
the air versus how much water could be in the air at that<br />
DEW POINT<br />
HUMAN PERCEPTION<br />
RELATIVE<br />
HUMIDITY<br />
75˚F+ Extremely uncomfortable, 62%<br />
oppressive<br />
70˚-74˚F Very humid, quite 52%-60%<br />
uncomfortable<br />
65˚-69˚F Somewhat uncomfortable for 44%-52%<br />
most people at upper limit<br />
60˚-64˚F Ok for most, but everyone 37%-46%<br />
perceives humidity at upper<br />
limit<br />
55˚-59˚F Comfortable 31%-41%<br />
50˚-54˚F Very comfortable 31%-37%<br />
49˚F or lower Starting to feel a bit dry 30%<br />
to some<br />
HUMIDITY:<br />
‘Hot and sticky’ isn’t the half of it<br />
temperature. If no more water vapor<br />
could be supported then relative<br />
humidity will be 100 percent.<br />
See, it’s complicated. Be patient.<br />
Here’s a more accurate way to asses<br />
how nasty it might be outside on that<br />
August morning.<br />
The more accurate measure of<br />
humidity is the “dew point," which<br />
takes into account the air temperature.<br />
The dew point is the temperature the<br />
air needs to be cooled to at that point<br />
in time to achieve a relative humidity of<br />
100%. At this point, the air cannot hold<br />
any more water in gas form. If the air were to be cooled even<br />
more, water vapor would have to come out of the atmosphere<br />
in the liquid form, usually as fog or rain.<br />
The higher the dew point rises, the greater the amount of<br />
moisture in the air. This directly effects how "comfortable" it<br />
will feel outside. At a relative humidity of<br />
100% the dew point temperature always equals the temperature.<br />
The greater the difference between temperature and<br />
dew point, the lower the relative humidity.<br />
Unlike relative humidity, if dew point increases it is only<br />
because the amount of moisture in the air increases. If relative<br />
humidity changes it can be because of temperature<br />
changes or moisture changes, or both<br />
So how does dew point feel? On a 90°F day the<br />
following apply:<br />
Summer 2009 25
company’s IT infrastructure and data networking. We tried<br />
several technology approaches that worked fine initially but<br />
encountered problems as more stations were added or server<br />
configurations were changed. The system needed to be totally<br />
scalable, redundant and self-monitoring to eliminate data loss<br />
and ensure 24/7 availability. Working closely with experts<br />
from several corporate IT organizations, we have achieved<br />
this goal and created a very reliable and innovative system<br />
that serves many operational and reporting needs.”<br />
Having devised<br />
In a land where rainfall is exceedingly the system for reliably<br />
collecting and<br />
sparse, water is precious, as in this<br />
agricultural irrigation system in the<br />
Eastern Province city of Hofuf below. storing the data, the<br />
next step was to leverage the data and make it accessible to<br />
staff within EPD, the Air Quality and Meteorology Unit, and<br />
across the company. The Web was the logical tool for ondemand<br />
reporting. Although access to the air-quality data is<br />
restricted, the weather data is fully accessible online through<br />
<strong>Saudi</strong> <strong>Aramco</strong>’s <strong>Weather</strong>Now Web site. The first screen displays<br />
a choice of company sites either from a drop-down<br />
menu or by clicking on a point on a map. The current weather<br />
conditions at that site are displayed, and the screen refreshes<br />
automatically every minute. The site is visited by 500 and<br />
1,000 employees each day.<br />
For those looking for a little more detail, the site also<br />
allows the visitor to query and download the entire weather
In an emergency, every second counts<br />
and complex decisions are made under<br />
pressure. Decision makers need facts: what is damaged,<br />
and what is still at risk? Do we have people working or living<br />
downwind? What is the safest approach route for emergency<br />
services? Where are the safest sites for our field command or<br />
patient triage?<br />
During industrial emergencies such as gas leaks or fires,<br />
the wind direction and speed is closely monitored to avoid<br />
exposure to spreading fire or lethal gases such as H 2 S. The<br />
wind direction must be monitored in real-time to manage the<br />
ongoing situation.<br />
“Traditionally, when we were alerted to an emergency,<br />
someone would step out of the control room, look at a wind<br />
sock, make a judgment about wind direction and speed and<br />
report back. It led to inevitable inconsistencies and some<br />
The Web-based Corporate Emergency<br />
Responder Tool allows commanders to<br />
quickly assess emergency situations.<br />
errors. This<br />
approach posed<br />
significant risks for<br />
emergency services,”<br />
explains Abdulla N. Helal, North Ghawar Producing Department<br />
Manager.<br />
Seeking to improve this situation, NGPD partnered with<br />
the e-Map Division of IT’s Corporate Applications Department<br />
and the Corporate Emergency Responder Tool (CERT) was<br />
born. This highly secure, Web-based application provides<br />
decision makers with a “zoomable” satellite image overlaid<br />
with digital maps created by <strong>Saudi</strong> <strong>Aramco</strong>’s own Surveying<br />
Services Division. The digital map displays the roads, buildings,<br />
utilities, and the thousands of oil and gas wells of <strong>Saudi</strong><br />
<strong>Aramco</strong>’s reservoirs, as well as live data streaming from the<br />
weather stations and gas sensors is dynamically displayed<br />
over the base map giving it tactical value.<br />
The data from the weather stations is automatically interpreted<br />
and delivered directly to the control room computer<br />
screens. It’s presented both graphically and in written words,<br />
THE CORPORATE<br />
EMERGENCY<br />
RESPONDER TOOL<br />
so there is no room for misunderstanding.<br />
“CERT is a very innovative system<br />
that integrates many data sources and<br />
systems into one intuitive graphical<br />
interface. The searchable, dynamic<br />
maps help emergency commanders to<br />
quickly establish the facts of the situation<br />
and coordinate a tightly integrated<br />
response,” Helal explained.<br />
Along with live weather and gas<br />
sensor readings, CERT provides quick<br />
links to information such as well-flow<br />
information, including historical data,<br />
and rig locations and movements captured<br />
every night. All critical valve and<br />
pipeline information including Flowlines<br />
and Trunklines is also readily available.<br />
These data help to<br />
remotely pinpoint possible<br />
causes for an event<br />
and, therefore, help<br />
determine appropriate<br />
solutions.<br />
An integral part of<br />
CERT is a gas dispersion<br />
model created by <strong>Aramco</strong>’s Loss Prevention<br />
Department. In the case of a well blow-out,<br />
CERT generates “exposure zones” that graphically<br />
show how far the gas could travel in a<br />
worst-case scenario and what could be directly<br />
impacted. The map display helps to quickly<br />
position road-blocks and safely evacuate personnel<br />
from the danger areas. The CERT display<br />
is closely monitored on large plasma screens in<br />
multiple Emergency Control Centers amid the<br />
constant radio updates. The CERT map provides a common<br />
operating picture during a stressful time.<br />
“CERT is far more than a computer application. It shows<br />
what can be achieved when organizational boundaries are<br />
discarded, and we all focus purely on a shared cause — safety.<br />
We have made a unique and truly corporate tool that is used<br />
across all producing facilities and control centers. It was built<br />
entirely in-house using the combined talent of young programmers<br />
and the experience of operations staff. Best of all,<br />
CERT leverages existing IT hardware and software licenses,<br />
plus the hard work and high-quality data from many organizations.<br />
And at the core of it all are those towering weather<br />
stations,” says Peter O’Regan, e-Map Division’s Geographical<br />
Information Systems (GIS) expert and the architect of CERT.<br />
Summer 2009 27
history for most company locations. With a single mouse<br />
click, this data can be directly exported to Exel for graphing<br />
and trend analysis.<br />
“Information Technology continues to work closely with<br />
EPD and all Producing organizations to create a comprehensive<br />
real-time weather network. Instead of scattered, standalone<br />
weather stations within the Plants, we now have a rich,<br />
corporate database that feeds many critical applications —<br />
every minute, 24 hours a day. This was all achieved by tapping<br />
into existing in-house expertise and leveraging the existing<br />
technology infrastructure. It is an ideal outcome,” said<br />
Khalid A. Al-Arfaj, the Administrator of IT’s e-Map Division<br />
So whether <strong>Saudi</strong> <strong>Aramco</strong> employees or dependents are<br />
evaluating the safest location for a new facility; arranging a<br />
crane lift; or planning the best time to plant roses at home,<br />
visit http://weathernow. ■<br />
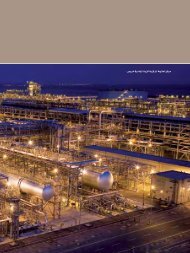
Below, a rain drainage system along the East-West Pipeline in<br />
1992. At right, an aerial view of the Manifa oil field project in<br />
the Arabian Gulf, where weather can impact work safety.<br />
Below right, a <strong>Saudi</strong> <strong>Aramco</strong> jet takes off in remote Shaybah,<br />
where the searing Empty Quarter heat can affect lift.<br />
28 <strong>Saudi</strong> <strong>Aramco</strong> Dimensions
<strong>Saudi</strong> <strong>Aramco</strong>’s immediate past president and CEO,<br />
Abdallah S. Jum'ah, once said, “Environmental<br />
accountability today stands as one of the most important<br />
measures by which a company is regarded. If an organization<br />
is not active in safeguarding the Earth's natural resources,<br />
its best efforts in all other business areas are diminished.<br />
Indeed, the very perception of corporate attitudes toward environmental<br />
protection carries significant weight in the public's<br />
trust of that company.”<br />
In 1981, the Kingdom entrusted the Presidency of<br />
Meteorology and Environment (PME) with control of pollution<br />
and protection of the environment in <strong>Saudi</strong> Arabia.<br />
Through the General Environmental Law and its Rules for<br />
Implementation, PME aims to, among other things, preserve,<br />
protect and develop the environment and safeguard it from<br />
pollution, as well as protect public health from activities and<br />
acts that harm the environment.<br />
In recent decades, the nation’s industrial expansion and<br />
population growth has increased pressure on the environment.<br />
As the nation’s largest industry, <strong>Saudi</strong> <strong>Aramco</strong> has always been<br />
very aware of its responsibility to maintain the highest environmental<br />
standards.<br />
The company’s Environmental Protection Department (EPD)<br />
is charged with the task of monitoring air quality, reporting on<br />
compliance and advising facility management on ways to “clean<br />
up” their operations. The original weather stations in the Air<br />
Quality and Meteorology Monitoring Network (AMMNET)<br />
were erected by EPD to assist in that task. Each station records<br />
parameters such as sulfur dioxide, inhalable particulates, ozone,<br />
nitrogen oxide, carbon monoxide and hydrogen sulfide.<br />
Facility emissions are monitored at their source using stack<br />
testing and continuous emission and process-control monitoring.<br />
Sophisticated numerical air-dispersion techniques supported by<br />
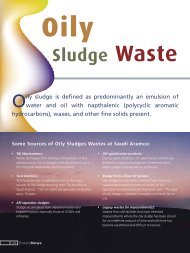
At left, an air-quality monitoring<br />
device. Below, <strong>Saudi</strong> <strong>Aramco</strong><br />
employees check company<br />
weather equipment and log the<br />
information in comprehensive<br />
reports.<br />
COMPLIANCE MONITORING,<br />
trend analysis and design data<br />
data from AMMNET enable EPD<br />
to estimate ground-level concentrations<br />
of pollutants at various<br />
distances from a potential emissions<br />
source even before a facility is built or<br />
modified. Such predictive modelling is<br />
used to determine the type of facility<br />
controls needed to comply with applicable<br />
air-quality standards.<br />
“From time to time, a facility may<br />
breach the air-quality standards, but its<br />
picked up immediately and reported.<br />
We work with plant management to find<br />
solutions to the problem, and as a result<br />
the company has developed many<br />
innovative technologies to clean up its<br />
operations,” explains Earl K. Fosdik,<br />
environmental projects manager.<br />
But not all emissions can be pinpointed<br />
to a single source, and solutions<br />
are not always clear-cut. For<br />
these substances, EPD monitors for<br />
shifting trends. One such substance is<br />
ozone. Although ozone in the upper<br />
atmosphere protects the planet from<br />
damaging ultraviolet rays, at ground<br />
level it is an unwanted pollutant that<br />
can affect human and plant health.<br />
AMMNET and EPD have also provided<br />
another service to the company<br />
— design data. The design of the Shaybah heating, ventilation<br />
and air conditioning system is an example. “The vendor originally<br />
expected that air temperatures onsite would regularly<br />
reach 60 degrees. Our monitoring at the time showed that<br />
50 degrees was a more accurate average. Consequently, the<br />
design was downscaled, and this saved the company millions of<br />
dollars,” explains Daniel Baird, supervisor of Industrial Relations<br />
Respiratory Care Unit.<br />
Air-quality compliance monitoring, trend analysis and design<br />
data were the initial uses for the AMMNET system. But it was<br />
inevitable that the rest of the company would realize the value<br />
of using the data collected from the weather towers, and<br />
demand unsurprisingly increased rapidly.<br />
Although the air-quality data remains confidential,<br />
the weather data is now freely<br />
available, reducing the cumbersome and<br />
time-consuming request process originally<br />
required through EPD. Dan Baird is pleased<br />
to see the data more widely used. “Promoting<br />
the data was always a double-edged sword<br />
because we simply didn’t have the resources<br />
to dedicate to a whole lot of requests. Now<br />
that we have <strong>Weather</strong>Now, anyone can get<br />
the weather data they need for their decision<br />
making, and we are freed up to concentrate<br />
on our core responsibilities.”<br />
Summer 2009 29