Presentations ( 1.2MB) - Tokyo Electron Limited (TEL)
Presentations ( 1.2MB) - Tokyo Electron Limited (TEL)
Presentations ( 1.2MB) - Tokyo Electron Limited (TEL)

You also want an ePaper? Increase the reach of your titles
YUMPU automatically turns print PDFs into web optimized ePapers that Google loves.
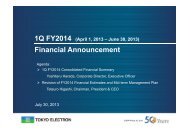
2Q FY2013 (April 1, 2012 – September 30, 2012)<br />
Financial Announcement<br />
Agenda:<br />
‣ 2Q FY2013 Consolidated Financial Summary<br />
Yoshiteru Harada, Corporate Director, Executive Officer<br />
‣ Revision of FY2013 Financial Estimates and Major Progress in this Fiscal Year<br />
Hiroshi Takenaka, President & CEO<br />
October 31, 2012<br />
CORP IR/October 31, 2012
2Q FY2013 Consolidated Financial<br />
Summary<br />
2Q FY2013: July 1, 2012 - September 30, 2012<br />
FY2013 : April 1, 2012 - March 31, 2013<br />
Yoshiteru Harada<br />
Corporate Director, Executive Officer<br />
October 31, 2012<br />
CORP IR/October 31, 2012
Results Highlights For the six months ended September 30, 2012<br />
Net Sales ¥266.6B<br />
- 13.1% on FY12/2H<br />
(-18.3% on FY12/1H)<br />
Operating income<br />
Operating margin<br />
¥12.2B<br />
4.6%<br />
- 48.3% on FY12/2H<br />
(-66.9% on FY12/1H)<br />
Net income ¥6.0B<br />
- 39.5% on FY12/2H<br />
(-77.2% on FY12/1H)<br />
Cash and cash equivalents: Cash and deposits + Short-term investments, etc (Securities in B/S).<br />
2<br />
Corp IR/October 31, 2012
Profit and Loss<br />
FY12 FY13 FY13<br />
1H 2H 1H<br />
1H Forecast<br />
(7/30)<br />
Net Sales 326.3 306.7 266.6 268.0<br />
SPE 248.3 229.4 214.6 216.0<br />
FPD/PVE 36.6 33.2 9.2 9.0<br />
EC/CN 41.0 43.8 42.4 43.0<br />
Others 0.2 0.2 0.2 -<br />
113.5<br />
97.9<br />
85.6<br />
Gross profit<br />
-<br />
(34.8%) (31.9%) (32.1%)<br />
SG&A 76.6 74.3 73.4 -<br />
Operating<br />
income<br />
36.8<br />
(11.3%)<br />
23.5<br />
(7.7%)<br />
12.2<br />
(4.6%)<br />
(Billions of Yen)<br />
9.5<br />
(3.5%)<br />
Net income 26.6 10.0 6.0 6.0<br />
EPS(yen) 148.85 56.20 33.99 33.49<br />
1. SPE:Semiconductor Production Equipment, FPD/PVE:Flat Panel Display and Photovoltaic Panel Production Equipment, EC/CN:Electric Components and Computer Networks<br />
2. Numbers shown in ( ): Profit ratios<br />
3. Profit ratios are calculated using full amounts, before rounding.<br />
3<br />
Corp IR/October 31, 2012
Net Sales & Operating Margin<br />
(Billions of Yen)<br />
250<br />
50%<br />
200<br />
150<br />
31.4%<br />
132.4<br />
40%<br />
30%<br />
100<br />
20%<br />
50<br />
0<br />
2.2%<br />
2.9<br />
10%<br />
0%<br />
-50<br />
FY11/2Q 3Q 4Q FY12/1Q 2Q 3Q 4Q FY13/1Q 2Q<br />
Net Sales 173.5 159.6 190.6 153.1 173.2 129.1 177.5 134.1 132.4<br />
Operating<br />
income<br />
Gross profit<br />
margin<br />
Operating<br />
margin<br />
Net Sales<br />
Operating income<br />
Gross profit margin<br />
Operating margin<br />
24.0 25.8 29.7 23.0 13.7 6.0 17.4 9.2 2.9<br />
34.3% 36.8% 35.3% 38.2% 31.8% 32.1% 31.8% 32.9% 31.4%<br />
13.8% 16.2% 15.6% 15.1% 7.9% 4.7% 9.8% 6.9% 2.2%<br />
-10%<br />
4<br />
Corp IR/October 31, 2012
Net Sales by Division<br />
(Billions of Yen)<br />
300<br />
SPE Division<br />
(Semiconductor Production<br />
Equipment)<br />
FPD/PVE Division<br />
(FPD/PV Production<br />
Equipment)<br />
(Billions of Yen)<br />
60<br />
(Billions of Yen)<br />
60<br />
EC/CN Division<br />
(<strong>Electron</strong>ic Components,<br />
Computer Networks)<br />
100%<br />
Composition<br />
200<br />
248.3<br />
229.4<br />
214.6<br />
40<br />
36.6<br />
33.2<br />
40<br />
41.0<br />
43.8<br />
42.4<br />
13 14 16<br />
11 11<br />
3<br />
EC/CN<br />
FPD/PVE<br />
100<br />
20<br />
20<br />
76 75<br />
81<br />
SPE<br />
9.2<br />
0<br />
1H<br />
FY12<br />
2H<br />
1H<br />
FY13<br />
0<br />
1H<br />
FY12<br />
2H<br />
1H<br />
FY13<br />
0<br />
1H<br />
FY12<br />
2H<br />
1H<br />
FY13<br />
0%<br />
1H<br />
FY12<br />
2H<br />
1H<br />
FY13<br />
5<br />
Corp IR/October 31, 2012
SPE Sales by Region<br />
Japan U.S. Europe<br />
Korea<br />
(Billions of Yen) (Billions of Yen) (Billions of Yen) (Billions of Yen)<br />
100<br />
100<br />
100<br />
100<br />
50<br />
50.3<br />
32.5<br />
20.2<br />
50<br />
53.5<br />
61.2<br />
55.7<br />
50<br />
30.9<br />
18.3<br />
23.4<br />
50<br />
37.8<br />
70.8<br />
38.6<br />
0<br />
1H<br />
FY12<br />
2H<br />
1H<br />
FY13<br />
0<br />
1H<br />
FY12<br />
2H<br />
1H<br />
FY13<br />
0<br />
1H<br />
FY12<br />
2H<br />
1H<br />
FY13<br />
0<br />
1H<br />
FY12<br />
2H<br />
1H<br />
FY13<br />
(Billions of Yen) (Billions of Yen) (Billions of Yen)<br />
100<br />
100<br />
100<br />
50<br />
0<br />
Taiwan China S.E. Asia, Others Region Composition<br />
44.1<br />
1H<br />
FY12<br />
30.8<br />
2H<br />
58.7<br />
1H<br />
FY13<br />
50<br />
0<br />
15.8<br />
1H<br />
FY12<br />
9.5 11.8<br />
2H<br />
1H<br />
FY13<br />
50<br />
0<br />
15.6<br />
1H<br />
FY12<br />
6.0 5.9<br />
2H<br />
1H<br />
FY13<br />
100%<br />
50%<br />
0%<br />
6 3 3<br />
4 6<br />
6<br />
13<br />
18<br />
27<br />
15 31<br />
13<br />
22<br />
20<br />
1H<br />
FY12<br />
8<br />
27<br />
14<br />
2H<br />
18<br />
11<br />
26<br />
9<br />
1H<br />
FY13<br />
Others<br />
China<br />
Taiwan<br />
Korea<br />
Europe<br />
U.S.<br />
Japan<br />
6<br />
Corp IR/October 31, 2012
Segment Information<br />
300<br />
250<br />
200<br />
SPE<br />
(Semiconductor Production Equipment)<br />
248.3<br />
20.2%<br />
229.4<br />
214.6<br />
30%<br />
25%<br />
20%<br />
60<br />
45<br />
30<br />
FPD/PVE<br />
(FPD/PV Production Equipment)<br />
(Billions of Yen) (Billions of Yen) (Billions of Yen)<br />
Sales<br />
Segment income<br />
Segment profit margin<br />
36.6<br />
Sales<br />
Segment income<br />
33.2<br />
Segment profit margin<br />
100%<br />
75%<br />
50%<br />
60<br />
50<br />
40<br />
EC/CN<br />
(<strong>Electron</strong>ic Components and Computer Networks)<br />
41.7<br />
Sales<br />
Segment income<br />
Segment profit margin<br />
44.5<br />
42.8<br />
30%<br />
25%<br />
20%<br />
150<br />
16.9%<br />
15%<br />
30<br />
15%<br />
100<br />
50<br />
0<br />
(50)<br />
50.2<br />
1H<br />
FY12<br />
2H<br />
38.7<br />
14.3%<br />
30.7<br />
1H<br />
FY13<br />
10%<br />
5%<br />
0%<br />
-5%<br />
15<br />
0<br />
(15)<br />
(30)<br />
8.0%<br />
2.9<br />
1H<br />
FY12<br />
9.2<br />
(0.6) (3.3)<br />
2H<br />
-2.0%<br />
1H<br />
FY13<br />
-36.5%<br />
25%<br />
0%<br />
-25%<br />
-50%<br />
20<br />
10<br />
0<br />
(10)<br />
3.0%<br />
2.4%<br />
1.6%<br />
1.2 1.0 0.6<br />
1H<br />
FY12<br />
2H<br />
1H<br />
FY13<br />
10%<br />
5%<br />
0%<br />
-5%<br />
1. R&D expenses such as fundamental research and element research are not included in above reportable segments.<br />
2. Segment income is based on income before income taxes.<br />
3. Profit ratios are calculated using full amounts, before rounding.<br />
7<br />
Corp IR/October 31, 2012
Orders, Order Backlog<br />
(Billions of Yen)<br />
250<br />
200<br />
150<br />
100<br />
118.7<br />
75.0<br />
50<br />
0<br />
FY11/2Q 3Q 4Q FY12/1Q 2Q 3Q 4Q FY13/1Q 2Q<br />
15.8<br />
SPE Orders 150.2 128.6 155.8 112.6 73.5 144.9 106.4 76.0 66.9<br />
FPD/PVE Orders 22.4 15.2 26.3 8.9 1.7 5.0 2.8 2.8 8.0<br />
SPE<br />
Order backlog<br />
215.5 228.8 228.9 220.7 166.7 220.1 188.6 157.7 118.7<br />
FPD/PVE<br />
Order backlog<br />
57.8 51.0 65.4 61.8 39.4 27.8 14.2 12.2 15.8<br />
8<br />
Corp IR/October 31, 2012
Orders by Region: SPE, FPD/PVE<br />
(Billions of Yen)<br />
200<br />
172.7<br />
182.1<br />
150<br />
143.8<br />
121.6<br />
150.0<br />
109.3<br />
100<br />
75.2<br />
78.8 75.0<br />
50<br />
0<br />
FY11/2Q 3Q 4Q FY12/1Q 2Q 3Q 4Q FY13/1Q 2Q<br />
Japan 17.3 22.2 43.9 25.0 16.3 14.9 11.7 10.0 16.3<br />
U.S. 46.6 24.5 25.4 31.1 24.8 29.7 36.8 24.0 18.4<br />
Europe 22.8 14.1 18.6 17.2 3.9 7.6 7.0 6.8 7.7<br />
Korea 24.9 21.0 30.7 21.9 17.9 51.1 25.1 9.7 7.3<br />
Taiwan 34.6 38.2 40.3 13.7 6.6 33.5 21.0 20.0 16.7<br />
China, S.E. Asia,<br />
Others<br />
26.3 23.5 22.9 12.5 5.4 12.9 7.4 8.1 8.3<br />
9<br />
Corp IR/October 31, 2012
Balance Sheet<br />
Assets<br />
(Billions of Yen)<br />
Liabilities & Net Assets<br />
(Billions of Yen)<br />
782.4 783.6<br />
276.6 247.6<br />
745.0<br />
286.2<br />
Cash & cash<br />
equivalents<br />
782.4 783.6<br />
5.1 4.4<br />
186.0 180.6<br />
745.0<br />
3.0<br />
146.3<br />
Debt<br />
Other liabilities<br />
131.2<br />
150.3<br />
94.9<br />
Trade notes,<br />
Accounts receivables<br />
159.1 149.4 132.9<br />
Inventories<br />
591.2 598.6 595.6<br />
Net assets<br />
42.8 59.6 37.0<br />
Other current assets<br />
122.8 126.8<br />
127.1<br />
Tangible fixed assets<br />
49.7 49.6 66.7<br />
Other fixed assets<br />
2011/9/30 2012/3/31 2012/9/30<br />
2011/9/30 2012/3/31 2012/9/30<br />
66.7 billion yen of other fixed assets as of 2012/9/30 includes 15.1 billion yen of goodwill on corporate acquisition, etc.<br />
Cash and cash equivalents: Cash and deposits + Short-term investments, etc. (Securities in B/S).<br />
10<br />
Corp IR/October 31, 2012
Inventory Turnover and AR Turnover<br />
(Billions of Yen)<br />
(Days)<br />
300<br />
150<br />
250<br />
200<br />
150<br />
100<br />
129<br />
91<br />
132<br />
121<br />
107 109<br />
112<br />
96<br />
104 104<br />
76<br />
82<br />
92<br />
74<br />
99<br />
67<br />
86<br />
71<br />
Net sales<br />
Accounts receivable turnover<br />
Inventory turnover<br />
92<br />
87<br />
86<br />
86 85<br />
72<br />
73<br />
60<br />
125<br />
100<br />
75<br />
50<br />
50<br />
25<br />
0<br />
2Q<br />
FY10<br />
3Q 4Q 1Q<br />
FY11<br />
2Q 3Q 4Q 1Q<br />
FY12<br />
2Q 3Q 4Q 1Q<br />
FY13<br />
2Q<br />
0<br />
*Turnover days = Inventory or AR at the end of each quarter / last 12 months sales x 365<br />
11<br />
Corp IR/October 31, 2012
Cash Flow<br />
(Billions of Yen)<br />
FY2012<br />
FY2013<br />
1H 2H 1H<br />
Cash flow from operating activities 26.7 3.0 73.9<br />
Cash flow from investing activities -72.4 64.1 -84.2<br />
Payment for corporate acquisition - - -15.8<br />
Payment for purchase of property,<br />
plant, equipment and others<br />
-16.9 -22.3 -12.6<br />
Term deposits over 3 months -55.4 86.4 -55.7<br />
Cash flow from financing activities -16.7 -10.5 -6.4<br />
Cash and cash equivalents<br />
at end of term<br />
101.1 158.7 141.6<br />
Cash and deposits at end of term<br />
(Short-term investments, etc. included)<br />
276.6 247.6 286.2<br />
12<br />
Corp IR/October 31, 2012
Supplement Data<br />
CORP IR/October 31, 2012
Profit and Loss<br />
FY2012<br />
FY2013<br />
(Billions of Yen)<br />
1Q 2Q 3Q 4Q 1Q 2Q<br />
Net Sales 153.1 173.2 129.1 177.5 134.1 132.4<br />
SPE 120.8 127.5 91.5 137.8 108.7 105.9<br />
FPD/PVE 12.5 24.1 16.6 16.5 4.7 4.4<br />
EC/CN 19.6 21.3 20.8 22.9 20.6 21.8<br />
Others 0.0 0.1 0.0 0.1 0.1 0.1<br />
Gross profit<br />
58.4 55.0 41.4 56.4 44.1 41.5<br />
(38.2%) (31.8%) (32.1%) (31.8%) (32.9%) (31.4%)<br />
SG&A 35.3 41.3 35.3 38.9 34.8 38.6<br />
Operating<br />
23.0 13.7 6.0 17.4 9.2 2.9<br />
income<br />
(15.1%) (7.9%) (4.7%) (9.8%) (6.9%) (2.2%)<br />
Income before<br />
income taxes<br />
23.4 15.8 6.7 14.6 11.2 4.3<br />
Net income 16.6 10.0 0.7 9.3 5.7 0.3<br />
EPS(yen) 92.91 55.95 4.21 51.98 31.93 2.07<br />
R&D expenses 18.1 22.9 18.7 21.6 17.9 19.4<br />
1. SPE:Semiconductor Production Equipment, FPD/PVE:Flat Panel Display and Photovoltaic Panel Production Equipment, EC/CN:Electric Components and Computer Networks<br />
2. Numbers shown in ( ): Profit ratios<br />
3. Profit ratios are calculated using full amounts, before rounding.<br />
14<br />
Corp IR/October 31, 2012
Net Sales by Division<br />
SPE Division<br />
(Semiconductor Production<br />
Equipment)<br />
FPD/PVE Division<br />
(FPD/PV Production<br />
Equipment)<br />
(Billions of Yen) (Billions of Yen) (Billions of Yen)<br />
200<br />
30<br />
30<br />
EC/CN Division<br />
(<strong>Electron</strong>ic Components,<br />
Computer Networks)<br />
100%<br />
Composition<br />
12<br />
16 13 15 17<br />
EC/CN<br />
150<br />
127.5<br />
137.8<br />
20<br />
24.1<br />
20<br />
21.3 20.8<br />
22.9<br />
20.6 21.8<br />
14<br />
13<br />
9 4 3<br />
FPD/PVE<br />
108.7<br />
105.9<br />
16.6 16.5<br />
100<br />
91.5<br />
10<br />
10<br />
74 71<br />
78 81 80<br />
SPE<br />
50<br />
4.7 4.4<br />
0<br />
2Q<br />
FY12<br />
3Q 4Q 1Q<br />
FY13<br />
2Q<br />
0<br />
2Q<br />
FY12<br />
3Q 4Q 1Q<br />
FY13<br />
2Q<br />
0<br />
2Q<br />
FY12<br />
3Q 4Q 1Q<br />
FY13<br />
2Q<br />
0%<br />
2Q<br />
FY12<br />
3Q 4Q 1Q<br />
FY13<br />
2Q<br />
15<br />
Corp IR/October 31, 2012
SPE Sales by Region<br />
Japan U.S. Europe<br />
Korea<br />
(Billions of Yen) (Billions of Yen) (Billions of Yen) (Billions of Yen)<br />
60<br />
60<br />
60<br />
60<br />
50.2<br />
30<br />
29.4<br />
16.6 15.8<br />
10.0 10.1<br />
30<br />
23.8<br />
28.6 32.6 26.6 29.1<br />
30<br />
16.9<br />
9.5 8.7<br />
10.4 12.9<br />
30<br />
20.9 20.6<br />
24.2<br />
14.4<br />
0<br />
2Q<br />
FY12<br />
3Q 4Q 1Q<br />
FY13<br />
2Q<br />
0<br />
2Q<br />
FY12<br />
3Q 4Q 1Q<br />
FY13<br />
2Q<br />
0<br />
2Q<br />
FY12<br />
3Q 4Q 1Q<br />
FY13<br />
2Q<br />
0<br />
2Q<br />
FY12<br />
3Q 4Q 1Q<br />
FY13<br />
2Q<br />
(Billions of Yen) (Billions of Yen) (Billions of Yen)<br />
60<br />
60<br />
60<br />
30<br />
0<br />
Taiwan China S.E. Asia, Others Region Composition<br />
19.4<br />
2Q<br />
FY12<br />
9.6<br />
21.1<br />
29.3 29.4<br />
3Q 4Q 1Q<br />
FY13<br />
2Q<br />
30<br />
0<br />
6.6<br />
2Q<br />
FY12<br />
3.9<br />
5.6 5.6 6.1<br />
3Q 4Q 1Q<br />
FY13<br />
2Q<br />
30<br />
0<br />
10.2<br />
2Q<br />
FY12<br />
2.5 3.5 2.3 3.5<br />
3Q 4Q 1Q<br />
FY13<br />
2Q<br />
100%<br />
50%<br />
0%<br />
8<br />
5<br />
15<br />
16<br />
13<br />
19 31<br />
24<br />
2Q<br />
FY12<br />
3<br />
4<br />
3<br />
4<br />
2<br />
5<br />
3<br />
6<br />
11 15<br />
27<br />
28<br />
23<br />
10<br />
18<br />
36<br />
6 10<br />
24<br />
22 14<br />
12<br />
25 27<br />
12 9 10<br />
3Q 4Q 1Q<br />
FY13<br />
2Q<br />
Others<br />
China<br />
Taiwan<br />
Korea<br />
Europe<br />
U.S.<br />
Japan<br />
16<br />
Corp IR/October 31, 2012
Segment Information<br />
180<br />
150<br />
120<br />
90<br />
127.5<br />
SPE<br />
(Semiconductor Production Equipment)<br />
91.5<br />
137.8<br />
108.7 105.9<br />
60%<br />
50%<br />
40%<br />
30%<br />
40<br />
30<br />
20<br />
24.1<br />
FPD/PVE<br />
(FPD/PV Production Equipment)<br />
(Billions of Yen) (Billions of Yen) (Billions of Yen)<br />
Sales<br />
Segment income<br />
Segment profit margin<br />
Sales<br />
Segment income<br />
16.6 16.5<br />
Segment profit margin<br />
100%<br />
75%<br />
50%<br />
30<br />
25<br />
20<br />
15<br />
EC/CN<br />
(<strong>Electron</strong>ic Components and Computer Networks)<br />
Sales<br />
Segment income<br />
21.7 21.1<br />
23.4<br />
Segment profit margin<br />
20.8 22.0<br />
60%<br />
50%<br />
40%<br />
30%<br />
60<br />
20%<br />
10<br />
4.7 4.4<br />
25%<br />
10<br />
20%<br />
17.2%<br />
14.9%<br />
18.2%<br />
15.5%13.2%<br />
-10%<br />
30<br />
0<br />
(30)<br />
21.9<br />
13.6<br />
25.1<br />
16.7 13.9<br />
2Q<br />
FY12<br />
3Q 4Q 1Q<br />
FY13<br />
2Q<br />
10%<br />
0%<br />
0<br />
-10<br />
-20<br />
8.6% 3.7%<br />
2.0 0.6 (1.2) (1.6) (1.6)<br />
0%<br />
2Q 3Q 4Q 1Q 2Q<br />
FY12<br />
FY13<br />
-7.7%<br />
-25%<br />
-35.3% -37.7%<br />
-50%<br />
5<br />
0<br />
(5)<br />
2.4% 1.9% 2.9% 2.2%<br />
0.5 0.3 0.6 1.0%<br />
0.2 0.4<br />
2Q<br />
FY12<br />
3Q 4Q 1Q<br />
FY13<br />
2Q<br />
10%<br />
0%<br />
-10%<br />
1. R&D expenses such as fundamental research and element research are not included in above reportable segments.<br />
2. Segment income is based on income before income taxes.<br />
3. Profit ratios are calculated using full amounts, before rounding.<br />
17<br />
Corp IR/October 31, 2012
Balance Sheet<br />
Assets<br />
Liabilities & Net Assets<br />
(Billions of Yen)<br />
(Billions of Yen)<br />
782.4 769.2 783.6<br />
767.0<br />
745.0<br />
782.4 769.2 783.6<br />
767.0<br />
5.1<br />
7.1<br />
4.4 4.5<br />
745.0<br />
3.0<br />
Debt<br />
276.6 249.4<br />
247.6<br />
252.6<br />
286.2<br />
Cash & cash<br />
equivalents<br />
186.0 178.8<br />
180.6 166.1 146.3<br />
Other liabilities<br />
131.2<br />
128.1 150.3 123.5<br />
94.9<br />
Trade notes,<br />
Accounts receivables<br />
159.1<br />
163.5 149.4 144.1<br />
132.9<br />
Inventories<br />
591.2 583.1 598.6 596.3 595.6<br />
Net assets<br />
42.8 55.5 59.6<br />
122.8 124.5 126.8<br />
49.1 37.0<br />
129.3 127.1<br />
Other current assets<br />
Tangible fixed assets<br />
49.7 47.9 49.6 68.1 66.7<br />
2Q<br />
FY12<br />
3Q 4Q 1Q<br />
FY13<br />
2Q<br />
Other fixed assets<br />
2Q<br />
FY12<br />
3Q 4Q 1Q<br />
FY13<br />
66.7 billion yen of other fixed assets as of 2QFY13 end includes 15.1 billion yen of goodwill on corporate acquisition, etc.<br />
Cash and cash equivalents: Cash and deposits + Short-term investments, etc. (Securities in B/S).<br />
2Q<br />
18<br />
Corp IR/October 31, 2012
Cash Flow<br />
(Billions of Yen)<br />
FY12<br />
FY13<br />
2Q 3Q 4Q 1Q 2Q<br />
Cash flow from operating activities 8.6 -4.9 7.9 35.8 38.0<br />
Cash flow from investing activities -13.7 53.3 10.8 -46.0 -38.1<br />
Payment for corporate acquisition - - - -15.8 -<br />
Payment for purchase of property,<br />
plant, equipment and others<br />
-12.2 -14.1 -8.1 -9.2 -3.4<br />
Term deposits over 3 months -1.4 67.4 19.0 -21.0 -34.7<br />
Cash flow from financing activities -2.5 -7.7 -2.8 -4.8 -1.5<br />
Cash and cash equivalents<br />
at end of term<br />
101.1 141.4 158.7 142.8 141.6<br />
Cash and deposits at end of term<br />
(Short-term investments, etc. included)<br />
276.6 249.4 247.6 252.6 286.2<br />
19<br />
Corp IR/October 31, 2012
Revision of FY2013 Financial Estimates<br />
and Major Progress in this Fiscal Year<br />
Hiroshi Takenaka, President & CEO<br />
October 31, 2012<br />
CORP IR/October 31, 2012
Business Environment<br />
CORP IR/October 31, 2012
Business Environment (As of October 2012)<br />
► SPE Capex<br />
PC and smartphone demand is lower than expected due to a slow<br />
macroeconomic environment. Demand from foundries is relatively firm, but<br />
the wafer fab equipment market is expected to decline by around 20% YoY<br />
in CY2012 and full recovery is not expected until spring CY2013 or beyond.<br />
► FPD Capex<br />
The supply/demand balance for large TV panels is improving, but demand<br />
for new equipment is not expected to recover until the second half of next<br />
year or later. Mid- and small-sized panels are likely to be the main source of<br />
equipment demand for the time being.<br />
► PV Capex<br />
Excess production capacity for crystalline PV panels is being adjusted,<br />
current capex is expected to remain sluggish.<br />
22<br />
Corp IR/October 31, 2012
Quarterly Orders<br />
(Billions of Yen)<br />
300<br />
250<br />
SPE Order<br />
FPD/PVE Order<br />
July-September/2012<br />
SPE 66.9(-12%)<br />
FPD/PVE 8.0(+186%)<br />
Total: 75.0(-5%)<br />
( ): change from April-June/2012<br />
% is calculated using full amounts<br />
200<br />
150<br />
100<br />
50<br />
0<br />
00/7-9<br />
10-12<br />
01/1-3<br />
4-6<br />
7-9<br />
10-12<br />
02/1-3<br />
4-6<br />
7-9<br />
10-12<br />
03/1-3<br />
4-6<br />
7-9<br />
10-12<br />
04/1-3<br />
4-6<br />
7-9<br />
10-12<br />
05/1-3<br />
4-6<br />
7-9<br />
10-12<br />
06/1-3<br />
4-6<br />
7-9<br />
10-12<br />
07/1-3<br />
4-6<br />
7-9<br />
10-12<br />
08/1-3<br />
4-6<br />
7-9<br />
10-12<br />
09/1-3<br />
4-6<br />
7-9<br />
10-12<br />
10/1-3<br />
4-6<br />
7-9<br />
10-12<br />
11/1-3<br />
4-6<br />
7-9<br />
10-12<br />
12/1-3<br />
4-6<br />
7-9<br />
23<br />
Corp IR/October 31, 2012
SPE Orders by Application: Equipment only<br />
100%<br />
80%<br />
60%<br />
40%<br />
20%<br />
22<br />
34 28 25 17 18 15 17 19<br />
16 22 24 23<br />
37<br />
7 4 6<br />
33<br />
31 27<br />
8 41<br />
11 4<br />
15<br />
16 21 33 27 58 46 37<br />
44<br />
52<br />
12<br />
15 58 47 45 46 39<br />
23<br />
8 6<br />
36<br />
0 22 49 35<br />
37 21<br />
3<br />
28 26 15<br />
22<br />
25<br />
26 42<br />
18<br />
9<br />
35 24<br />
12 12 10 19 16<br />
9 26 30 32 44<br />
55 55 11 15 18 32<br />
52<br />
8<br />
32 30 39 45<br />
51<br />
24<br />
39<br />
22 24 32 29<br />
22 26 24 27 39 27 16<br />
30 18 8<br />
23 23 8<br />
15 14<br />
6 11 14 7 9<br />
0%<br />
05/10-12<br />
06/1-3<br />
4-6<br />
7-9<br />
10-12<br />
07/1-3<br />
4-6<br />
7-9<br />
10-12<br />
08/1-3<br />
4-6<br />
7-9<br />
10-12<br />
09/1-3<br />
4-6<br />
7-9<br />
10-12<br />
10/1-3<br />
4-6<br />
7-9<br />
10-12<br />
11/1-3<br />
4-6<br />
7-9<br />
10-12<br />
12/1-3<br />
4-6<br />
7-9<br />
Logic & others (MPU, System LSI, Others)<br />
Logic foundry<br />
Flash<br />
DRAM<br />
24<br />
Corp IR/October 31, 2012
Revision of FY2013 Financial Estimates<br />
CORP IR/October 31, 2012
Revision of FY2013 Financial Estimates<br />
FY2012<br />
FY2013<br />
1H 2H Full year<br />
Actual<br />
New<br />
estimates<br />
New<br />
estimates<br />
Adjustments<br />
Adjustments<br />
YoY<br />
change<br />
Net sales 633.0 266.0 234.4 -27.6 501.0 -29.0 -21%<br />
SPE 477.8 214.6 178.3 -21.7 393.0 -23.0 -18%<br />
FPD/PVE 69.8 9.2 9.7 +0.7 19.0 +1.0 -73%<br />
EC/CN 84.8 42.4 46.0 -7.0 88.5 -7.5 +4%<br />
Others 0.4 0.2 0.2 0.5 +0.5 -<br />
Operating income<br />
Lower line:OP margin<br />
Income before<br />
income taxes<br />
60.4<br />
9.5%<br />
12.2<br />
4.6%<br />
0.3<br />
0.1%<br />
-10.2<br />
-3.9pts<br />
12.5<br />
2.5%<br />
(Billions of Yen)<br />
-7.5<br />
-1.3pts<br />
-47.9<br />
-7.0pts<br />
60.6 15.5 2.5 -10.5 18.0 -7.5 -42.6<br />
Net income 36.7 6.0 1.0 -7.0 7.0 -7.0 -29.7<br />
1. Adjustments: changes from the figures announced on July 30, 2012<br />
2. NEXX Systems (acquisition completed on May 1) and FSI International (acquisition completed on October 11) financials are<br />
reflected in above estimates .<br />
Lowered SPE sales forecast due to weak investment<br />
26<br />
Corp IR/October 31, 2012
Key Items of Financial Revision<br />
1. Fixed cost reduction: ¥16 billion from last FY<br />
» Cost cuts centered on subcontractor, payroll and development<br />
expenses (materials, etc.)<br />
2. Dividend forecast<br />
» Annual dividend of ¥51 including the commemorative dividend<br />
3. Two acquisitions completed<br />
Date acquisition<br />
announced<br />
Date acquisition<br />
completed<br />
Purchase<br />
price<br />
Goodwill<br />
(Years of amortization)<br />
NEXX Systems March 16, 2012 May 1, 2012 ¥15.8 billion ¥15.3 billion (10 years)*<br />
FSI International August 13, 2012 October 11, 2012 ¥19.9 billion TBD<br />
* Goodwill and years of amortization are provisional figures.<br />
27<br />
Corp IR/October 31, 2012
R&D Expenses, CAPEX, Depreciation<br />
(Billions of Yen)<br />
100<br />
75<br />
50<br />
R&D Expenses<br />
66.0<br />
60.9<br />
54.0<br />
70.5<br />
81.5<br />
74.0<br />
(Billions of Yen)<br />
80<br />
60<br />
40<br />
設 CAPEX 備 投 資<br />
減 価 償 却 費<br />
Depreciation<br />
• New Miyagi plant<br />
• New Miyagi plant<br />
• <strong>TEL</strong> Technology Center Tsukuba<br />
• Kunshan (China) plant<br />
• <strong>TEL</strong> Technology Center Korea<br />
39.1 39.5<br />
25<br />
20<br />
22.7<br />
21.4 23.0<br />
18.1 20.0<br />
14.9<br />
17.7<br />
24.1<br />
26.0<br />
22.0<br />
0<br />
FY08 FY09 FY10 FY11 FY12 FY13(E)<br />
Revised<br />
0<br />
FY08 FY09 FY10 FY11 FY12 FY13(E)<br />
Revised<br />
R&D Expenses: 79.0B to 74.0B yen (revised)<br />
CAPEX: 24.0B to 22.0B yen (revised)<br />
Depreciation: 28.0B to 26.0B yen (revised)<br />
28<br />
Corp IR/October 31, 2012
Major Progress in this fiscal year<br />
CORP IR/October 31, 2012
Progress in the SPE Business<br />
(areas of enhancement)<br />
► Etching systems<br />
‣ Dielectric etch<br />
Maintained high market share in logic BEOL and memory HARC process<br />
‣ Poly etch<br />
<strong>TEL</strong> successfully differentiated itself in the logic FEOL via RLSA etcher<br />
-Newly secured six POR* in US and European markets<br />
-Also introduced evaluation equipment to Asian customers<br />
Expect to secure several new processes next FY and beyond.<br />
FinFET<br />
Tactras RLSA Etch<br />
* POR (Process of Record): Approval to use equipment in customers’ semiconductor manufacturing processes.<br />
30<br />
Corp IR/October 31, 2012
Progress in the SPE Business<br />
(areas of enhancement)<br />
► Cleaning system<br />
‣ Single wafer cleaning<br />
-Confirmed process superiority in BEOL in customer evaluations<br />
-Expect to obtain POR for several volume production in the<br />
near future<br />
‣ Dry cleaning<br />
-Certas maintains high market share<br />
Expect to expand applicable processes going forward through<br />
the application of new materials<br />
-Completed development of new platform with greatly<br />
improved productivity. Preparations in place for 2013<br />
market introduction<br />
‣ Acquisition of FSI International (U.S.)<br />
-Enhanced product line-up with FSI SPM* technology and<br />
dry particle removal technology<br />
CELLESTA TM<br />
Certas <br />
ORION <br />
SPM (Sulfuric Acid & Hydrogen Peroxide Mixture ) treatment technology: A technique to remove impurities and<br />
photoresist by mixing sulfuric acid and hydrogen peroxide and further heating.<br />
31<br />
Corp IR/October 31, 2012
Acquired FSI International<br />
• Acquisition completed on October 11, 2012<br />
• Purchase price: ¥19.9 billion<br />
Aims of the FSI acquisition<br />
‣ Enhance single wafer cleaning: Acquire next generation technology needs<br />
‣ Complementary benefits: Application/customers<br />
‣ Expand product line-up<br />
Batch Single wafer Scrubber<br />
WET WET DRY WET<br />
EXPEDIUS CELLESTA ORION Certas ANTARES NS300<br />
High temp SPM<br />
Particle removal<br />
Product line-up enhanced by complementary FSI products<br />
32<br />
Corp IR/October 31, 2012
SPE Business – other highlights<br />
► Thermal processing system<br />
► 3DI<br />
• Customer evaluation progressed in high-performance ALD equipment<br />
(NT333). Obtained POR for use in next generation memory<br />
• Shipped TSV processing equipment to pilot lines of several customers<br />
(Wafer bonder/debonder, Deep Si etch system, Dielectric liner deposition)<br />
• Shipments of bonders for C-MOS sensors are strong<br />
► Technology for the volume production of new<br />
memory STT-MRAM (jointly developed with Tohoku University)<br />
• Started development of a range of production equipment for volume<br />
production from 2015<br />
33<br />
Corp IR/October 31, 2012
Progress made in the FPD/PV Business<br />
► FPD production equipment<br />
• Strengthened cost competitiveness<br />
-Optimized scale by redeploying personnel<br />
-Begun operation of Kunshan plant in China<br />
• Began sales of large ICP etchers for high resolution LCD/OLED backplanes<br />
‣ OLED production equipment<br />
Market trends: Volume production of large panels for OLED TVs delayed<br />
to 2014<br />
<strong>TEL</strong> status: Started customer evaluation of ink jet system, in addition to<br />
evaporation system<br />
► PV production equipment<br />
• Acquiring Oerlikon Solar: Have secured approval under all relevant<br />
countries’ anti-trust laws. In negotiations for final closing of the deal.<br />
34<br />
Corp IR/October 31, 2012
Summary<br />
1. PC and smartphone demand lower than expected, wafer fab<br />
equipment market expected to be down around 20% YoY in<br />
CY2012. Financial forecasts revised down as 2 nd half SPE sales<br />
now expected to decelerate.<br />
2. We will implement annual fixed cost reduction of 16 billion yen in<br />
response to this environment change.<br />
3. <strong>TEL</strong> aims to significantly enhance its technological competitiveness<br />
by actively implementing R&D investment and necessary<br />
acquisitions.<br />
35<br />
Corp IR/October 31, 2012
Disclaimer regarding forward-looking statement<br />
Forecast of <strong>TEL</strong>’s performance and future prospects and other sort of information published<br />
are made based on information available at the time of publication. Actual performance and<br />
results may differ significantly from the forecast described here due to changes in various<br />
external and internal factors, including the economic situation, semiconductor/FPD/PV market<br />
conditions, intensification of sales competition, safety and product quality management, and<br />
intellectual property-related risks.<br />
Processing of numbers<br />
For the amount listed, because fractions are rounded down, there may be the cases where the<br />
total for certain account titles does not correspond to the sum of the respective figures for<br />
account titles. Percentages are calculated using full amounts, before rounding.<br />
Exchange Risk<br />
In principle, export sales of <strong>Tokyo</strong> <strong>Electron</strong>’s mainstay semiconductor and FPD/PV cell<br />
production equipment are denominated in yen. While some settlements are denominated in<br />
dollars, exchange risk is hedged as forward exchange contracts are made individually at the<br />
time of booking. Accordingly, the effect of exchange rates on profits is negligible.<br />
FPD/PV: Flat panel display/Photovoltaic<br />
36<br />
Corp IR/October 31, 2012
Corp IR/October 31, 2012<br />
37