please do not cite or circulate without permission of the authors
please do not cite or circulate without permission of the authors
please do not cite or circulate without permission of the authors

You also want an ePaper? Increase the reach of your titles
YUMPU automatically turns print PDFs into web optimized ePapers that Google loves.
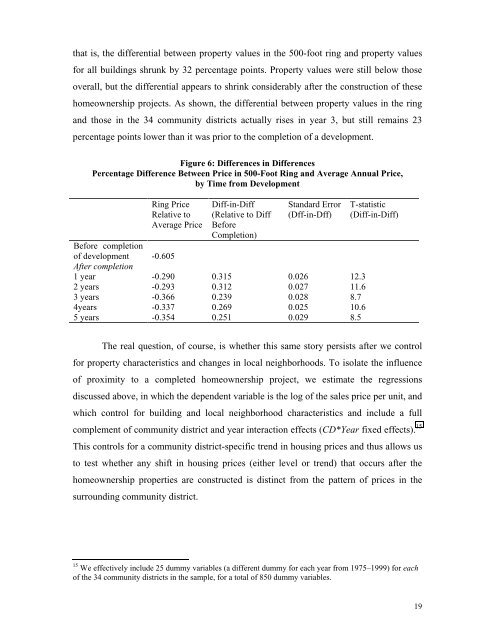
that is, <strong>the</strong> differential between property values in <strong>the</strong> 500-foot ring and property values<br />
f<strong>or</strong> all buildings shrunk by 32 percentage points. Property values were still below those<br />
overall, but <strong>the</strong> differential appears to shrink considerably after <strong>the</strong> construction <strong>of</strong> <strong>the</strong>se<br />
homeownership projects. As shown, <strong>the</strong> differential between property values in <strong>the</strong> ring<br />
and those in <strong>the</strong> 34 community districts actually rises in year 3, but still remains 23<br />
percentage points lower than it was pri<strong>or</strong> to <strong>the</strong> completion <strong>of</strong> a development.<br />
Figure 6: Differences in Differences<br />
Percentage Difference Between Price in 500-Foot Ring and Average Annual Price,<br />
by Time from Development<br />
Ring Price<br />
Relative to<br />
Average Price<br />
Diff-in-Diff<br />
(Relative to Diff<br />
Bef<strong>or</strong>e<br />
Completion)<br />
Standard Err<strong>or</strong><br />
(Dff-in-Dff)<br />
Bef<strong>or</strong>e completion<br />
<strong>of</strong> development -0.605<br />
After completion<br />
1 year -0.290 0.315 0.026 12.3<br />
2 years -0.293 0.312 0.027 11.6<br />
3 years -0.366 0.239 0.028 8.7<br />
4years -0.337 0.269 0.025 10.6<br />
5 years -0.354 0.251 0.029 8.5<br />
T-statistic<br />
(Diff-in-Diff)<br />
The real question, <strong>of</strong> course, is whe<strong>the</strong>r this same st<strong>or</strong>y persists after we control<br />
f<strong>or</strong> property characteristics and changes in local neighb<strong>or</strong>hoods. To isolate <strong>the</strong> influence<br />
<strong>of</strong> proximity to a completed homeownership project, we estimate <strong>the</strong> regressions<br />
discussed above, in which <strong>the</strong> dependent variable is <strong>the</strong> log <strong>of</strong> <strong>the</strong> sales price per unit, and<br />
which control f<strong>or</strong> building and local neighb<strong>or</strong>hood characteristics and include a full<br />
complement <strong>of</strong> community district and year interaction effects (CD*Year fixed effects). 15<br />
This controls f<strong>or</strong> a community district-specific trend in housing prices and thus allows us<br />
to test whe<strong>the</strong>r any shift in housing prices (ei<strong>the</strong>r level <strong>or</strong> trend) that occurs after <strong>the</strong><br />
homeownership properties are constructed is distinct from <strong>the</strong> pattern <strong>of</strong> prices in <strong>the</strong><br />
surrounding community district.<br />
15 We effectively include 25 dummy variables (a different dummy f<strong>or</strong> each year from 1975–1999) f<strong>or</strong> each<br />
<strong>of</strong> <strong>the</strong> 34 community districts in <strong>the</strong> sample, f<strong>or</strong> a total <strong>of</strong> 850 dummy variables.<br />
19