please do not cite or circulate without permission of the authors
please do not cite or circulate without permission of the authors
please do not cite or circulate without permission of the authors

You also want an ePaper? Increase the reach of your titles
YUMPU automatically turns print PDFs into web optimized ePapers that Google loves.
district both bef<strong>or</strong>e and after completion. However, <strong>the</strong>re <strong>do</strong>es appear to be a significant<br />
reduction in <strong>the</strong> gap around <strong>the</strong> time <strong>of</strong> completion. Finally, it is interesting to <strong>not</strong>e that,<br />
while <strong>the</strong> gap between prices in <strong>the</strong> ring and <strong>the</strong> community district falls immediately<br />
after completion in <strong>the</strong> 500-foot ring, it appears to take longer f<strong>or</strong> <strong>the</strong> effects to be felt in<br />
<strong>the</strong> m<strong>or</strong>e distant rings. The maj<strong>or</strong> decline in <strong>the</strong> 1,000-foot ring occurs between one and<br />
two years after <strong>the</strong> completion <strong>of</strong> <strong>the</strong> homeownership project. In <strong>the</strong> 2,000-foot ring, <strong>the</strong><br />
decline continues through year three. One plausible explanation is that <strong>the</strong><br />
homeownership projects have a m<strong>or</strong>e sudden impact on <strong>the</strong>ir immediate surroundings,<br />
but that, over time, <strong>the</strong>y may bring benefits to m<strong>or</strong>e distant areas as well. (This is also<br />
consistent with <strong>the</strong> fact—discussed below—that after 10 years <strong>the</strong> impact in <strong>the</strong> 500-foot<br />
ring appears to dissipate—while <strong>the</strong> effects are persistent in <strong>the</strong> 2,000-foot ring.)<br />
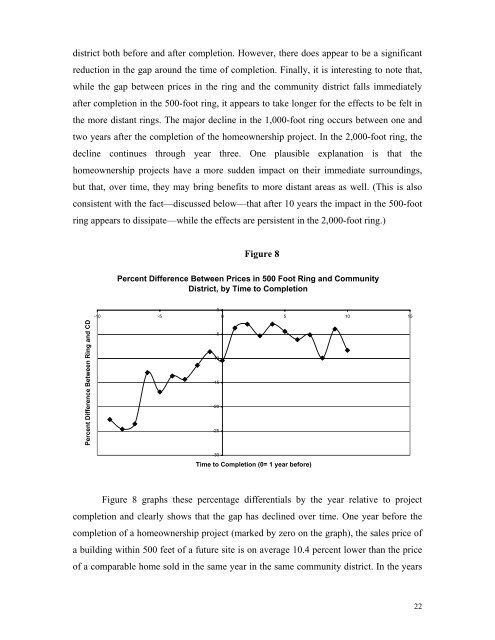
Figure 8<br />
Percent Difference Between Prices in 500 Foot Ring and Community<br />
District, by Time to Completion<br />
0<br />
-10 -5 0 5 10 15<br />
Percent Difference Between Ring and CD<br />
-5<br />
-10<br />
-15<br />
-20<br />
-25<br />
-30<br />
Time to Completion (0= 1 year bef<strong>or</strong>e)<br />
Figure 8 graphs <strong>the</strong>se percentage differentials by <strong>the</strong> year relative to project<br />
completion and clearly shows that <strong>the</strong> gap has declined over time. One year bef<strong>or</strong>e <strong>the</strong><br />
completion <strong>of</strong> a homeownership project (marked by zero on <strong>the</strong> graph), <strong>the</strong> sales price <strong>of</strong><br />
a building within 500 feet <strong>of</strong> a future site is on average 10.4 percent lower than <strong>the</strong> price<br />
<strong>of</strong> a comparable home sold in <strong>the</strong> same year in <strong>the</strong> same community district. In <strong>the</strong> years<br />
22