Full scale test on environmental impact of ... - Royal Haskoning
Full scale test on environmental impact of ... - Royal Haskoning
Full scale test on environmental impact of ... - Royal Haskoning

You also want an ePaper? Increase the reach of your titles
YUMPU automatically turns print PDFs into web optimized ePapers that Google loves.
<str<strong>on</strong>g>Full</str<strong>on</strong>g> <str<strong>on</strong>g>scale</str<strong>on</strong>g> <str<strong>on</strong>g>test</str<strong>on</strong>g> <strong>on</strong> envir<strong>on</strong>mental <strong>impact</strong> <strong>of</strong> diaphragm wall trench<br />
installati<strong>on</strong> in Amsterdam<br />
J.C.W.M. de Wit i) , H.J. Lengkeek ii)<br />
ABSTRACT<br />
This year the c<strong>on</strong>structi<strong>on</strong> <strong>of</strong> the deep underground stati<strong>on</strong>s for the new Amsterdam metro line will start. As a<br />
part <strong>of</strong> the stati<strong>on</strong>s’ design a full <str<strong>on</strong>g>scale</str<strong>on</strong>g> <str<strong>on</strong>g>test</str<strong>on</strong>g> <strong>on</strong> the installati<strong>on</strong> <strong>of</strong> diaphragm wall trenches has been carried out<br />
to investigate the <strong>impact</strong> <strong>on</strong> the envir<strong>on</strong>ment. This paper discusses <str<strong>on</strong>g>test</str<strong>on</strong>g> program, <str<strong>on</strong>g>test</str<strong>on</strong>g> results, the interpretati<strong>on</strong><br />
<strong>of</strong> the <str<strong>on</strong>g>test</str<strong>on</strong>g> results and the 3D FE modelling that was used for predicti<strong>on</strong> and validati<strong>on</strong> purposes.<br />
Keywords: deep excavati<strong>on</strong>s, underground stati<strong>on</strong>s, diaphragm walls, FE modelling, full <str<strong>on</strong>g>scale</str<strong>on</strong>g> <str<strong>on</strong>g>test</str<strong>on</strong>g><br />
1 INTRODUCTION<br />
The new North/South Line metro in Amsterdam will<br />
c<strong>on</strong>nect the northern and southern suburbs with the<br />
city centre (de Wit, 1998). The underground stati<strong>on</strong>s,<br />
20-25 m wide and 200-260 m l<strong>on</strong>g, will be c<strong>on</strong>structed<br />
at very busy locati<strong>on</strong>s and close to historical<br />
buildings. The excavati<strong>on</strong> will be carried out to a<br />
depth <strong>of</strong> over 30 m in s<strong>of</strong>t soil c<strong>on</strong>diti<strong>on</strong>s with high<br />
ground water levels.<br />
The excavati<strong>on</strong> <strong>of</strong> the building pit and the c<strong>on</strong>structi<strong>on</strong><br />
<strong>of</strong> the permanent body can be analysed with a<br />
2D FE-model, in which the full building sequence<br />
with time schedule is processed (figure 1). The excavati<strong>on</strong><br />
<strong>of</strong> the diaphragm wall trench however, is<br />
far more complicated because <strong>of</strong> the 3 dimensi<strong>on</strong>al<br />
behaviour. Therefore it was decided to carry out a<br />
research project <strong>on</strong> the diaphragm walls’ excavati<strong>on</strong>.<br />
The project c<strong>on</strong>sists <strong>of</strong> the following parts:<br />
− predicti<strong>on</strong> <strong>of</strong> the <strong>impact</strong> with a three dimensi<strong>on</strong>al<br />
finite element model (3D FE-model);<br />
− full-<str<strong>on</strong>g>scale</str<strong>on</strong>g> <str<strong>on</strong>g>test</str<strong>on</strong>g> program at the M<strong>on</strong>driaan Tower<br />
c<strong>on</strong>structi<strong>on</strong> site in Amsterdam near the Amstel<br />
river;<br />
− interpretati<strong>on</strong> <str<strong>on</strong>g>test</str<strong>on</strong>g> results;<br />
− validati<strong>on</strong> <strong>of</strong> the 3D FE-model based <strong>on</strong> the <str<strong>on</strong>g>test</str<strong>on</strong>g><br />
results that have become available.<br />
The first two parts <strong>of</strong> the <str<strong>on</strong>g>test</str<strong>on</strong>g> were described extensively<br />
in an earlier paper (de Wit et al, 1999) and<br />
will <strong>on</strong>ly be summarised here. The interpretati<strong>on</strong> <strong>of</strong><br />
the <str<strong>on</strong>g>test</str<strong>on</strong>g> results and the validati<strong>on</strong> <strong>of</strong> the 3D FEMmodel<br />
are discussed in this paper.<br />
Figure 1. Typical cross secti<strong>on</strong> <strong>of</strong> underground stati<strong>on</strong>.<br />
The underground stati<strong>on</strong>s will be c<strong>on</strong>structed in a<br />
building pit <strong>of</strong> 40 m l<strong>on</strong>g braced diaphragm walls.<br />
The historical envir<strong>on</strong>ment requires a careful approach<br />
<strong>of</strong> all c<strong>on</strong>structi<strong>on</strong> processes needed to build<br />
the underground stati<strong>on</strong>:<br />
− excavati<strong>on</strong> <strong>of</strong> the diaphragm wall trench;<br />
− excavati<strong>on</strong> <strong>of</strong> the building pit;<br />
− c<strong>on</strong>structi<strong>on</strong> <strong>of</strong> permanent body.<br />
2 DIAPHRAGM WALL INSTALLATION<br />
Diaphragm wall installati<strong>on</strong> is carried out incrementally<br />
by the c<strong>on</strong>structi<strong>on</strong> <strong>of</strong> individual panels to<br />
some planned sequence. The panels’ dimensi<strong>on</strong>s can<br />
vary c<strong>on</strong>siderably depending <strong>on</strong> the design and the<br />
local circumstances. The c<strong>on</strong>structi<strong>on</strong> <strong>of</strong> a diaphragm<br />
panel is carried out from surface level by<br />
means <strong>of</strong> a mechanical device such as a bucket grab<br />
(figure 2) or hydro fraise.<br />
A progressive excavati<strong>on</strong> <strong>of</strong> a trench in the<br />
ground is allowed in such a way that stabilising fluid<br />
i) grade engineer deep underground stati<strong>on</strong>s, Design Office North/South Line Amsterdam, ROYAL HASKONING Rotterdam,<br />
Divisi<strong>on</strong> Transport and Infrastructure, Civil engineering structures and geotechnics , The Netherlands<br />
ii) geotechnical engineer deep underground stati<strong>on</strong>s, Design Office North/South Line Amsterdam, Witteveen + Bos Deventer, The<br />
Netherlands<br />
J.C.W.M. de Wit, H.J. Lengkeek. <str<strong>on</strong>g>Full</str<strong>on</strong>g> <str<strong>on</strong>g>scale</str<strong>on</strong>g> <str<strong>on</strong>g>test</str<strong>on</strong>g> <strong>on</strong> envir<strong>on</strong>mental <strong>impact</strong> <strong>of</strong> diaphragm wall trench installati<strong>on</strong> in Amsterdam, . Proc. Int. Sym. <strong>on</strong> Geotechnical<br />
Aspects <strong>of</strong> Underground C<strong>on</strong>structi<strong>on</strong> in S<strong>of</strong>t Ground, Toulouse, 2002, France. -1-
(bent<strong>on</strong>ite) is introduced simultaneously as the<br />
trenching operati<strong>on</strong> proceeds. Once the excavati<strong>on</strong> is<br />
completed the reinforcement cage is inserted into the<br />
bent<strong>on</strong>ite-filled trench. Furthermore the trench will<br />
be filled with c<strong>on</strong>crete by way <strong>of</strong> tremie pipes,<br />
thereby displacing the bent<strong>on</strong>ite from the bottom up.<br />
During excavati<strong>on</strong> the stability <strong>of</strong> the trench is<br />
satisfied by means <strong>of</strong> a combinati<strong>on</strong> <strong>of</strong> support pressure<br />
<strong>of</strong> the bent<strong>on</strong>ite slurry and 3D stress distributi<strong>on</strong><br />
in the surrounding ground, referred to as arching.<br />
Table 1. Stratificati<strong>on</strong> and soil properties.<br />
Layer Z [m NAP] γ sat [kN/m 3 ] q c [MPa]<br />
Fill (sand) 2.0 20.0 10<br />
Holocene Clay -1.0 14.3 0.5<br />
Peat (“holland” peat) -3.5 10.3 0.5<br />
Clay -7.0 15.2 1.0<br />
Peat (“basis”peat) -11.0 11.7 1.5<br />
Pleistocene Sand<br />
-13.5 20.0 20<br />
(1 st sand layer)<br />
Clay (Eem clay) -17.0 18,5 2.0<br />
Sand -28.0 19,0 20<br />
Clay -42.0 18,5 2.0<br />
3.2 Diaphragm wall and <str<strong>on</strong>g>test</str<strong>on</strong>g> locati<strong>on</strong><br />
The <str<strong>on</strong>g>test</str<strong>on</strong>g> program was carried out at a c<strong>on</strong>structi<strong>on</strong><br />
site for the future 100 m high M<strong>on</strong>driaan Tower<br />
(figure 3). Underneath the <strong>of</strong>fice building a 2 storey<br />
underground parking is c<strong>on</strong>structed. Diaphragm<br />
walls(length 35 m) are applied as building pit wall<br />
and will act as structural wall to the underground<br />
parking in the final stage. Some <strong>of</strong> the panels, with a<br />
length <strong>of</strong> 55 m, will also serve as foundati<strong>on</strong> element.<br />
Figure 2. Excavati<strong>on</strong> with a bucket grab.<br />
3 FULL SCALE TEST<br />
The objects <strong>of</strong> the full-<str<strong>on</strong>g>scale</str<strong>on</strong>g> <str<strong>on</strong>g>test</str<strong>on</strong>g> program at the<br />
M<strong>on</strong>driaan Tower c<strong>on</strong>structi<strong>on</strong> site is to m<strong>on</strong>itor:<br />
− vertical and horiz<strong>on</strong>tal deformati<strong>on</strong>s <strong>of</strong> the<br />
ground adjacent to the excavated trench;<br />
− settlement <strong>of</strong> loaded piles;<br />
− <strong>impact</strong> <strong>on</strong> bearing capacity <strong>of</strong> piles,<br />
due to sequential installati<strong>on</strong> (excavati<strong>on</strong> and c<strong>on</strong>creting)<br />
<strong>of</strong> adjoining diaphragm wall panels.<br />
3.1 Stratificati<strong>on</strong> and geotechnical parameters<br />
The surface level is at NAP + 2.0 m (ordnance date).<br />
The stratificati<strong>on</strong> and geotechnical parameters are<br />
listed in Table 1.<br />
In general the ground c<strong>on</strong>diti<strong>on</strong>s are representative<br />
<strong>of</strong> a n<strong>on</strong>-uniform stratum with made ground,<br />
Holocene s<strong>of</strong>t clay and peat layers overlaying Pleistocene<br />
medium dense sand layers and overc<strong>on</strong>solidated<br />
clay layers. The ground c<strong>on</strong>diti<strong>on</strong>s at the <str<strong>on</strong>g>test</str<strong>on</strong>g><br />
site are comparable to those at the locati<strong>on</strong>s <strong>of</strong> the<br />
future stati<strong>on</strong>s <strong>of</strong> the North/South line. The groundwater<br />
level is NAP -0.4 m, the piezometric level <strong>of</strong><br />
the deeper aquifers is NAP -3.0 m.<br />
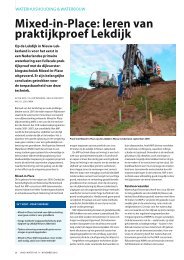
Figure 3. Impressi<strong>on</strong> <strong>of</strong> the M<strong>on</strong>driaan Tower.<br />
Figure 4 shows (approximately ¼ <strong>of</strong> the building<br />
pit) the diaphragm walls at the <str<strong>on</strong>g>test</str<strong>on</strong>g> locati<strong>on</strong> including<br />
the sequence <strong>of</strong> excavati<strong>on</strong>.<br />
The panel no’s 2 and 3 were excavated in <strong>on</strong>e<br />
course. The panel no’s 1, 4 and 5 were excavated in<br />
2 or 3 courses as a c<strong>on</strong>sequence <strong>of</strong> different widths<br />
or shapes.<br />
J.C.W.M. de Wit, H.J. Lengkeek. <str<strong>on</strong>g>Full</str<strong>on</strong>g> <str<strong>on</strong>g>scale</str<strong>on</strong>g> <str<strong>on</strong>g>test</str<strong>on</strong>g> <strong>on</strong> envir<strong>on</strong>mental <strong>impact</strong> <strong>of</strong> diaphragm wall trench installati<strong>on</strong> in Amsterdam, . Proc. Int. Sym. <strong>on</strong> Geotechnical<br />
Aspects <strong>of</strong> Underground C<strong>on</strong>structi<strong>on</strong> in S<strong>of</strong>t Ground, Toulouse, 2002, France. -2-
Figure 4. Layout <strong>of</strong> panel and instrumentati<strong>on</strong>.<br />
3.3 Instrumentati<strong>on</strong> and <str<strong>on</strong>g>test</str<strong>on</strong>g>s<br />
It was decided to focus more <strong>on</strong> m<strong>on</strong>itoring <strong>of</strong> deformati<strong>on</strong>s<br />
<strong>of</strong> the ground rather than <strong>on</strong> m<strong>on</strong>itoring<br />
<strong>of</strong> changes in stresses. Vertical ground deformati<strong>on</strong>s<br />
were m<strong>on</strong>itored by:<br />
− 48 precise levelling points at surface level were<br />
placed in a regular grid;<br />
− underneath 11 precise levelling points electr<strong>on</strong>ic<br />
extensometers were installed to m<strong>on</strong>itor vertical<br />
ground deformati<strong>on</strong>s <strong>on</strong> deeper levels (NAP –8m,<br />
-15, -31 and –51).<br />
These deformati<strong>on</strong>s and also the pile settlements<br />
(par.3.4) were m<strong>on</strong>itored c<strong>on</strong>tinuously with a total<br />
stati<strong>on</strong> (figure 5). During the period <strong>of</strong> excavati<strong>on</strong> <strong>of</strong><br />
the panels 1 to 5, which lasted about 3 weeks, each<br />
<strong>of</strong> these instruments was m<strong>on</strong>itored at least <strong>on</strong>ce in<br />
every 20 minutes.<br />
To m<strong>on</strong>itor horiz<strong>on</strong>tal deformati<strong>on</strong>s 14 tubes for<br />
inclinometers were installed, that were m<strong>on</strong>itored by<br />
hand <strong>on</strong> pre specified moments related to the excavati<strong>on</strong><br />
and c<strong>on</strong>creting <strong>of</strong> the panels.<br />
In two panels 3 piezometers were installed at different<br />
depths. This was realised by attaching piezometers<br />
to the reinforcement cages. The instruments<br />
allowed to m<strong>on</strong>itor the changes in pressure <strong>of</strong><br />
the bent<strong>on</strong>ite and c<strong>on</strong>crete in time. The wet c<strong>on</strong>crete<br />
pressure is hydrostatic <strong>on</strong>ly to a certain depth beneath<br />
the c<strong>on</strong>crete surface, the so-called “critical<br />
depth” ( Lings et al. 1994). The critical depth is<br />
mainly influenced by the type and temperature <strong>of</strong> the<br />
c<strong>on</strong>crete mix and by the pouring rate <strong>of</strong> the c<strong>on</strong>crete.<br />
In this way the lateral pressure <strong>of</strong> the wet c<strong>on</strong>crete,<br />
which appeared to be an important parameter in the<br />
FE-model, could be determined.<br />
To investigate if relief <strong>of</strong> original stresses within<br />
the stratum has occurred CPT’s (C<strong>on</strong>e Pressiometer<br />
Test) were carried out before and after the installati<strong>on</strong><br />
<strong>of</strong> diaphragm walls.<br />
Figure 5. Impressi<strong>on</strong> <strong>of</strong> <str<strong>on</strong>g>test</str<strong>on</strong>g> site, the total stati<strong>on</strong> in background.<br />
3.4 Test piles<br />
In the <str<strong>on</strong>g>test</str<strong>on</strong>g> field 3 steel piles with a diameter <strong>of</strong> 110<br />
mm, representative for typical historical timber piles<br />
in Amsterdam, were driven into the first sand layer.<br />
During excavati<strong>on</strong> the settlements <strong>of</strong> the piles were<br />
m<strong>on</strong>itored. The pile settlements are to be compared<br />
with the vertical ground deformati<strong>on</strong> m<strong>on</strong>itored at<br />
the nearest reference point at surface level and the<br />
nearest extensometer at pile toe level.<br />
On each pile, installed at a distance <strong>of</strong> about 0.7<br />
times the panel width to the trench, bearing capacity<br />
<str<strong>on</strong>g>test</str<strong>on</strong>g>s were carried out before and after the excavati<strong>on</strong><br />
<strong>of</strong> the diaphragm walls (figure 6).<br />
Figure 6. Pile <str<strong>on</strong>g>test</str<strong>on</strong>g>ing.<br />
4 TEST RESULTS<br />
The measurements were carried during the period <strong>of</strong><br />
21-09-1998 until 08-02-1999. The diaphragm walls<br />
installati<strong>on</strong> at the <str<strong>on</strong>g>test</str<strong>on</strong>g> field took place from 10-11-<br />
1998 until 03-12-1998. Both the diaphragm wall installati<strong>on</strong><br />
and <str<strong>on</strong>g>test</str<strong>on</strong>g> program were carried out satis-<br />
J.C.W.M. de Wit, H.J. Lengkeek. <str<strong>on</strong>g>Full</str<strong>on</strong>g> <str<strong>on</strong>g>scale</str<strong>on</strong>g> <str<strong>on</strong>g>test</str<strong>on</strong>g> <strong>on</strong> envir<strong>on</strong>mental <strong>impact</strong> <strong>of</strong> diaphragm wall trench installati<strong>on</strong> in Amsterdam, . Proc. Int. Sym. <strong>on</strong> Geotechnical<br />
Aspects <strong>of</strong> Underground C<strong>on</strong>structi<strong>on</strong> in S<strong>of</strong>t Ground, Toulouse, 2002, France. -3-
factory. Based <strong>on</strong> the raw data <strong>on</strong>ly it was c<strong>on</strong>cluded<br />
that:<br />
1. No significant envir<strong>on</strong>mental <strong>impact</strong> occurred:<br />
- minor vertical ground deformati<strong>on</strong>s <strong>on</strong> surface<br />
level and <strong>on</strong> deeper levels;<br />
- minor horiz<strong>on</strong>tal ground deformati<strong>on</strong>s during<br />
excavati<strong>on</strong> <strong>of</strong> the trench;<br />
- substantial horiz<strong>on</strong>tal ground deformati<strong>on</strong>s in<br />
s<strong>of</strong>t top layers, however <strong>impact</strong> <strong>on</strong> piles was<br />
not observed;<br />
- minor horiz<strong>on</strong>tal ground deformati<strong>on</strong>s in<br />
bearing sand layers and deep clay layers.<br />
2. Pile bearing capacity was not affected;<br />
3. An influence <strong>of</strong> the depth <strong>of</strong> a panel <strong>on</strong> the <str<strong>on</strong>g>test</str<strong>on</strong>g><br />
results was not m<strong>on</strong>itored, which was already<br />
noted at the predicti<strong>on</strong>s;<br />
4. The influence <strong>of</strong> the width <strong>of</strong> a panel was limited,<br />
which was not c<strong>on</strong>firmed by the predicti<strong>on</strong>s. Possibly<br />
the sequence <strong>of</strong> installati<strong>on</strong> played a role.<br />
This will be illustrated later;<br />
5. Envir<strong>on</strong>mental <strong>impact</strong> at panels with an irregular<br />
shape was limited but significant larger than at<br />
rectangular panels.<br />
0<br />
-10<br />
Vertical deformati<strong>on</strong> [mm]<br />
Horiz<strong>on</strong>tal deformati<strong>on</strong> [mm]<br />
0<br />
-10<br />
obvious and temporary errors and was performed<br />
by the m<strong>on</strong>itoring experts <strong>of</strong> Soldata.<br />
− The <str<strong>on</strong>g>test</str<strong>on</strong>g> interpretati<strong>on</strong> is primary focussed <strong>on</strong> the<br />
rectangular shaped panels since these are mostly<br />
applied in the stati<strong>on</strong>s’ design. This is achieved<br />
by using a limited data set in which the immediate<br />
<strong>impact</strong> <strong>of</strong> the irregular panel shapes was<br />
omitted for the benefit <strong>of</strong> the FE validati<strong>on</strong>s. This<br />
was possible since these panels were installed<br />
first.<br />
− Correcti<strong>on</strong> <strong>of</strong> the vertical deformati<strong>on</strong>s <strong>on</strong> deep<br />
levels with the effect <strong>of</strong> the horiz<strong>on</strong>tal deformed<br />
wire <strong>of</strong> the extensometer. This will be explained<br />
later.<br />
4.2 Surface settlements<br />
The targets <strong>on</strong> surface level show a minor settlement<br />
during excavati<strong>on</strong> <strong>of</strong> the trench, whereas the area<br />
that is influenced is limited. At a distance <strong>of</strong> 1.2 m to<br />
the trench (1 st grid line) settlements <strong>of</strong> max. 4 mm<br />
due to excavati<strong>on</strong> were m<strong>on</strong>itored. When the c<strong>on</strong>creting<br />
<strong>of</strong> the panel was almost completed an instant<br />
heave <strong>of</strong> max. 4 mm at the 1st grid line was observed<br />
at surface level (figure 8). This instant heave<br />
can be explained by undrained deformati<strong>on</strong> <strong>of</strong> the<br />
s<strong>of</strong>t clay layers in between the sand layers. The lateral<br />
c<strong>on</strong>crete pressure pushed the Holocene layers<br />
aside. Because <strong>of</strong> undrained behaviour the soils were<br />
not compressed but horiz<strong>on</strong>tally displaced. This is<br />
c<strong>on</strong>firmed by the inclinometer measurements.<br />
-20<br />
-20<br />
Vertical surface deformati<strong>on</strong> at several distances<br />
[m] during D-wall installati<strong>on</strong><br />
0 2 4 6 8 10<br />
4<br />
-30<br />
-40<br />
-40<br />
-20 -10 0 10 20<br />
Figure 7. Shaded plot <strong>of</strong> maximum measured vertical and horiz<strong>on</strong>tal<br />
deformati<strong>on</strong>s.<br />
4.1 Interpretati<strong>on</strong> <strong>of</strong> the <str<strong>on</strong>g>test</str<strong>on</strong>g> results<br />
After the <str<strong>on</strong>g>test</str<strong>on</strong>g> program the results were evaluated and<br />
interpreted. First <strong>of</strong> all this resulted in an increase <strong>of</strong><br />
understanding <strong>of</strong> the effects <strong>of</strong> diaphragm wall installati<strong>on</strong><br />
and sec<strong>on</strong>dly it made the <str<strong>on</strong>g>test</str<strong>on</strong>g> results accessible<br />
to back analyses to validate the FE model.<br />
For that purpose adjustments <strong>of</strong> the raw data set<br />
were carried out:<br />
− Data cleaning, which means that obvious spikes,<br />
temporary external influences or temporary bad<br />
functi<strong>on</strong>ing were corrected. This <strong>on</strong>ly c<strong>on</strong>cerns<br />
-30<br />
J.C.W.M. de Wit, H.J. Lengkeek. <str<strong>on</strong>g>Full</str<strong>on</strong>g> <str<strong>on</strong>g>scale</str<strong>on</strong>g> <str<strong>on</strong>g>test</str<strong>on</strong>g> <strong>on</strong> envir<strong>on</strong>mental <strong>impact</strong> <strong>of</strong> diaphragm wall trench installati<strong>on</strong> in Amsterdam, . Proc. Int. Sym. <strong>on</strong> Geotechnical<br />
Aspects <strong>of</strong> Underground C<strong>on</strong>structi<strong>on</strong> in S<strong>of</strong>t Ground, Toulouse, 2002, France. -4-<br />
Vertical deformati<strong>on</strong> [mm]<br />
2<br />
0<br />
-2<br />
-4<br />
-6<br />
-8<br />
-10<br />
initial during exc. after exc.<br />
after c<strong>on</strong>cr. final D-wall<br />
Figure 8. Settlements <strong>on</strong> surface level.<br />
5<br />
4.3 Horiz<strong>on</strong>tal ground deformati<strong>on</strong>s<br />
4<br />
3<br />
During excavati<strong>on</strong> the horiz<strong>on</strong>tal ground deformati<strong>on</strong>s<br />
were less than 10 mm. Due to c<strong>on</strong>creting minor<br />
2<br />
1
horiz<strong>on</strong>tal ground deformati<strong>on</strong>s were measured in<br />
the bearing sand and deep clay layers. Just before the<br />
completi<strong>on</strong> <strong>of</strong> the c<strong>on</strong>creting an instant large horiz<strong>on</strong>tal<br />
deformati<strong>on</strong> away form the trench was measured<br />
in the top s<strong>of</strong>t clay layers (figure 9). The maximum<br />
horiz<strong>on</strong>tal ground deformati<strong>on</strong> occurred at<br />
NAP-6 m to NAP-9 m. For a single panel this was<br />
approx. 100 mm away from the trench (at a distance<br />
<strong>of</strong> 1.2 m to the trench); for the combined effect <strong>of</strong><br />
several panels this was approx.150 mm.<br />
Horiz<strong>on</strong>tal displacements (inclinometer) in<br />
time [mm]<br />
-150 -100 -50 0 50<br />
0<br />
Reference date:<br />
01-12-1998 14:21<br />
26-11-1998 7:07<br />
-5<br />
30-11-1998 8:58<br />
26-11-1998 12:13 27-11-1998 7:02<br />
30-11-1998 8:58 01-12-1998 14:21<br />
-10<br />
-15<br />
-20<br />
-25<br />
-30<br />
-35<br />
Figure 9. Measured horiz<strong>on</strong>tal deformati<strong>on</strong>s in time at 1.2 m<br />
from trench.<br />
Figure 10 shows the measured maximum horiz<strong>on</strong>tal<br />
ground deformati<strong>on</strong>s perpendicular to the<br />
trench with an increasing distance to the trench. The<br />
deformati<strong>on</strong>s differ from the vertical deformati<strong>on</strong>s in<br />
magnitude and extent. Although the horiz<strong>on</strong>tal<br />
ground deformati<strong>on</strong>s decrease with the distance to<br />
the trench, still some 30 mm was m<strong>on</strong>itored at 8 m<br />
distance as a combined effect <strong>of</strong> several panels.<br />
Depth [m]<br />
Total horiz<strong>on</strong>tal (inclinometer) displacements<br />
[mm] at distances to D-wall<br />
-200 -150 -100 -50 0 50<br />
0<br />
-5<br />
-10<br />
-15<br />
-20<br />
-25<br />
-30<br />
1.25 m 2.45 m 4.0 m 5.6 m 7.2 m<br />
Figure 10. Measured total horiz<strong>on</strong>tal deformati<strong>on</strong>s wide panel<br />
at several distances from trench.<br />
4.4 Subsurface settlements<br />
On deeper levels (15 to 30 m below surface level)<br />
the extensometer results show maximum settlements<br />
that are within the same range as <strong>on</strong> surface level,<br />
however heave due to the c<strong>on</strong>creting effect was not<br />
observed. In general the vertical downward ground<br />
deformati<strong>on</strong>s due to excavati<strong>on</strong> do not exceed 2 mm.<br />
However, most extensometers, especially the <strong>on</strong>es<br />
close to the trench, indicated a instant settlement (to<br />
about 4 mm at the 1 st grid line) at the end <strong>of</strong> the c<strong>on</strong>creting<br />
phase. At first it was not clear what could<br />
have caused this movement. However an explanati<strong>on</strong><br />
could be found in relati<strong>on</strong> with the inclinometer<br />
results. As was explained before the c<strong>on</strong>creting <strong>of</strong><br />
the panel caused substantial horiz<strong>on</strong>tal ground deformati<strong>on</strong>s<br />
<strong>of</strong> over 10 cm in the s<strong>of</strong>t top layers. Assuming<br />
that the extensometer rod has developed a<br />
similar horiz<strong>on</strong>tal deformati<strong>on</strong>, this means that the<br />
rod has to extend, resulting in the registrati<strong>on</strong> <strong>of</strong> a<br />
settlement that in fact has not occurred. When correcting<br />
the raw data the settlements develop more<br />
equally which can be c<strong>on</strong>sidered as a c<strong>on</strong>firmati<strong>on</strong> <strong>of</strong><br />
the correcti<strong>on</strong>. In figure 11 the corrected and n<strong>on</strong><br />
corrected settlement lines perpendicular to the trench<br />
immediate after c<strong>on</strong>creting are presented. Finally it<br />
was decided to use both settlement lines bounding an<br />
area in which the actual deformati<strong>on</strong>s will occur.<br />
Depth [m]<br />
J.C.W.M. de Wit, H.J. Lengkeek. <str<strong>on</strong>g>Full</str<strong>on</strong>g> <str<strong>on</strong>g>scale</str<strong>on</strong>g> <str<strong>on</strong>g>test</str<strong>on</strong>g> <strong>on</strong> envir<strong>on</strong>mental <strong>impact</strong> <strong>of</strong> diaphragm wall trench installati<strong>on</strong> in Amsterdam, . Proc. Int. Sym. <strong>on</strong> Geotechnical<br />
Aspects <strong>of</strong> Underground C<strong>on</strong>structi<strong>on</strong> in S<strong>of</strong>t Ground, Toulouse, 2002, France. -5-
Vertica displacement [mm]<br />
4.0<br />
2.0<br />
0.0<br />
-2.0<br />
-4.0<br />
-6.0<br />
-8.0<br />
Total vertical displacements (extensometer)<br />
[mm] at NAP-15 m excl./incl. correcti<strong>on</strong> for<br />
horiz<strong>on</strong>tal displacement<br />
0.0 2.0 4.0 6.0 8.0 10.0<br />
excl.correcti<strong>on</strong> V11/08 03:12<br />
incl.correcti<strong>on</strong> V11/08 03:12<br />
D-wall<br />
fit excl.correcti<strong>on</strong><br />
fit incl.correcti<strong>on</strong><br />
Figure 11. Extensometer results (corrected and n<strong>on</strong> corrected).<br />
4.5 Pressure <str<strong>on</strong>g>test</str<strong>on</strong>g>s in trench<br />
From the FE predicti<strong>on</strong>s it was learned that the lateral<br />
wet c<strong>on</strong>crete pressure in trench surface has a<br />
significant effect <strong>on</strong> the horiz<strong>on</strong>tal deformati<strong>on</strong>s <strong>of</strong><br />
the s<strong>of</strong>t top ground layers. From literature (Lings et<br />
al. 1994) it is learned that up to a certain depth, the<br />
so called critical depth, the lateral pressure increases<br />
hydrostatic, based <strong>on</strong> the wet c<strong>on</strong>crete density. Underneath<br />
this level the increase <strong>of</strong> lateral is related to<br />
the bent<strong>on</strong>ite slurry density. This bilinear relati<strong>on</strong> is<br />
caused by the dissipati<strong>on</strong> <strong>of</strong> water out <strong>of</strong> the c<strong>on</strong>crete<br />
and the beginning <strong>of</strong> the hardening process. From<br />
literature critical depths <strong>of</strong> 5 to 15 m are known.<br />
Depth [m..NAP]<br />
0 200 400 600<br />
5.0<br />
0.0<br />
-5.0<br />
-10.0<br />
-15.0<br />
-20.0<br />
-25.0<br />
-30.0<br />
Piezometer measurement during D-wall<br />
installati<strong>on</strong> [kPa]<br />
4<br />
3<br />
1<br />
2<br />
11:00 12:30<br />
14:10 15:30<br />
bilinear c<strong>on</strong>crete fit bent<strong>on</strong>ite<br />
Figure 12. Piezometer measurements in the trench.<br />
In the <str<strong>on</strong>g>test</str<strong>on</strong>g> program, <strong>on</strong> three levels in the trench<br />
piezometers were installed (attached to reinforcement<br />
cage) allowing for m<strong>on</strong>itoring the development<br />
<strong>of</strong> the lateral pressure during c<strong>on</strong>creting and the beginning<br />
<strong>of</strong> the hardening process (figure 12). The<br />
<str<strong>on</strong>g>test</str<strong>on</strong>g> results allowed for a determinati<strong>on</strong> <strong>of</strong> the critical<br />
depth. However the critical depth appeared to be<br />
varying over the depth <strong>of</strong> the trench and depending<br />
<strong>on</strong> the pouring rate (in meters height per hour). The<br />
higher pouring rate in the deep part <strong>of</strong> the trench resulted<br />
in a larger critical depth.<br />
In table 2 the results are presented. For the pressure<br />
envelope still a bilinear diagram can be obtained.<br />
However the lower part <strong>of</strong> the diagram<br />
doesn’t relate to the bent<strong>on</strong>ite slurry density but to a<br />
higher density with a value between bent<strong>on</strong>ite and<br />
c<strong>on</strong>crete.<br />
Table 2. Results <strong>of</strong> piezometer measurements in the trench.<br />
Measurement: At the top At the base Unit<br />
Gradient bent<strong>on</strong>ite slurry 12.0 12.0 kN/m<br />
Gradient wet/hardened c<strong>on</strong>crete<br />
23.0 19.0 kN/m<br />
Critical depth 6 >15 m<br />
Pouring rate 7 >15 m/hr<br />
4.6 Test piles<br />
4.6.1 Pile settlements<br />
The settlements <strong>of</strong> the <str<strong>on</strong>g>test</str<strong>on</strong>g> piles provide informati<strong>on</strong><br />
whether there is a change <strong>of</strong> bearing capacity due to<br />
the installati<strong>on</strong> <strong>of</strong> diaphragm wall panels. Pile settlements<br />
larger than the vertical ground deformati<strong>on</strong>s<br />
at the same locati<strong>on</strong> could be an indicati<strong>on</strong> <strong>of</strong> loss <strong>of</strong><br />
pile bearing capacity.<br />
However, the pile settlements are in the same<br />
magnitude as the subsoil settlements. Test piles no.1<br />
and 3 (about 2.4 m from narrow panel) settled 3 mm<br />
to 6 mm; pile no.2 at (about 5.6 m from wide panel)<br />
hardly settled (less than 1 mm). Because the pile<br />
settlements and the vertical ground deformati<strong>on</strong>s at<br />
the same level corresp<strong>on</strong>d very well it is c<strong>on</strong>cluded<br />
that the bearing capacity is not reduced.<br />
It appeared from the raw data set that the irregular<br />
panels (Z and corner shape), which are close to the<br />
piles no. 1 and 3, had a significant influence <strong>on</strong> the<br />
settlements <strong>of</strong> these piles. For example, the total settlements<br />
<strong>of</strong> pile no.1 were primary caused by the installati<strong>on</strong><br />
<strong>of</strong> the irregular Z-shaped panel and not by<br />
the nearest rectangular panel. For pile no.3 no settlements<br />
were measured due to the installati<strong>on</strong> <strong>of</strong> the<br />
adjacent wide panel 4, which had a three day bent<strong>on</strong>ite<br />
slurry stage (weekend panel).<br />
J.C.W.M. de Wit, H.J. Lengkeek. <str<strong>on</strong>g>Full</str<strong>on</strong>g> <str<strong>on</strong>g>scale</str<strong>on</strong>g> <str<strong>on</strong>g>test</str<strong>on</strong>g> <strong>on</strong> envir<strong>on</strong>mental <strong>impact</strong> <strong>of</strong> diaphragm wall trench installati<strong>on</strong> in Amsterdam, . Proc. Int. Sym. <strong>on</strong> Geotechnical<br />
Aspects <strong>of</strong> Underground C<strong>on</strong>structi<strong>on</strong> in S<strong>of</strong>t Ground, Toulouse, 2002, France. -6-
4.6.2 Horiz<strong>on</strong>tal deformati<strong>on</strong>s<br />
Attenti<strong>on</strong> was paid to the effect <strong>of</strong> the large horiz<strong>on</strong>tal<br />
deformati<strong>on</strong>s in the top s<strong>of</strong>t soil layers as a result<br />
<strong>of</strong> c<strong>on</strong>creting the panel. It was investigated if<br />
these deformati<strong>on</strong>s could affect the piles. Therefore<br />
an upper bound approach was adopted in which the<br />
deformati<strong>on</strong>s were c<strong>on</strong>sidered as induced deformati<strong>on</strong>s<br />
to the piles. It then was learned that these deformati<strong>on</strong>s<br />
are not affective, if the stiffness <strong>of</strong> the<br />
piles is limited. A limited stiffness means that the<br />
pile can follow these deformati<strong>on</strong>s easily. This is<br />
surely the case with 100-120 mm diameter timber<br />
piles. C<strong>on</strong>crete piles are more sensible to this phenomen<strong>on</strong><br />
since their stiffness is usually substantial<br />
larger. However, c<strong>on</strong>crete piles are hardly applied<br />
al<strong>on</strong>g the metros´ alignment, but it was decided to<br />
investigate these locati<strong>on</strong>s in more detail.<br />
4.6.3 Bearing capacity <str<strong>on</strong>g>test</str<strong>on</strong>g>s<br />
To detect a possible loss <strong>of</strong> pile bearing capacity the<br />
piles were <str<strong>on</strong>g>test</str<strong>on</strong>g>ed before and after the installati<strong>on</strong> <strong>of</strong><br />
the diaphragm wall. In advance calculati<strong>on</strong>s were<br />
carried out, using CPT’s, to determine the bearing<br />
capacity based <strong>on</strong> the Dutch codes and also an upper<br />
bound value <strong>of</strong> the bearing capacity. In the Dutch<br />
Code calculati<strong>on</strong>s <strong>on</strong>ly the bearing sand layers are<br />
taken into account. The upper bound value included<br />
all layers. The pile <str<strong>on</strong>g>test</str<strong>on</strong>g>s that were carried out before<br />
the installati<strong>on</strong> <strong>of</strong> the diaphragm wall indicated a<br />
bearing capacity comparable to the Dutch Code<br />
bearing capacity. However, the pile <str<strong>on</strong>g>test</str<strong>on</strong>g>s that were<br />
carried out afterwards indicated a substantial increased<br />
bearing capacity approaching the calculated<br />
upper bound value<br />
Apparently the s<strong>of</strong>t layers paid a c<strong>on</strong>tributi<strong>on</strong> as<br />
well. Possibly caused by the increased effective<br />
stresses due to the wet c<strong>on</strong>crete pressure, which was<br />
indicated in the CPT’s that were carried out afte r-<br />
wards. The fact that the loading steps in the <str<strong>on</strong>g>test</str<strong>on</strong>g>s afterwards<br />
took significantly more time was an indicati<strong>on</strong><br />
that the s<strong>of</strong>t soil layers played a role and<br />
absorbed load. Eventually it was c<strong>on</strong>cluded that<br />
there was no loss <strong>of</strong> pile bearing capacity due to the<br />
installati<strong>on</strong> <strong>of</strong> diaphragm walls.<br />
Table 3. Data pile <str<strong>on</strong>g>test</str<strong>on</strong>g>s and working load.<br />
Pile <str<strong>on</strong>g>test</str<strong>on</strong>g>s Pile 1<br />
[kN]<br />
Pile 2<br />
[kN]<br />
Pile 3<br />
[kN]<br />
Predicti<strong>on</strong> by CPT 245-380 175 –300 175-300<br />
(min. max)<br />
Ultimate load capacity, 220 185 150<br />
<str<strong>on</strong>g>test</str<strong>on</strong>g> before<br />
Ultimate load capacity, 360 280 270<br />
<str<strong>on</strong>g>test</str<strong>on</strong>g> after<br />
Working load,<br />
during excavati<strong>on</strong><br />
150 120 100<br />
Depth [m..NAP]<br />
0<br />
-5<br />
-10<br />
-15<br />
-20<br />
-25<br />
20<br />
15<br />
<br />
qc before qc after Rf before Rf after<br />
Figure 13. CPT <str<strong>on</strong>g>test</str<strong>on</strong>g> results before and after diaphragm wall installati<strong>on</strong>.<br />
4.7 C<strong>on</strong>e pressiometer <str<strong>on</strong>g>test</str<strong>on</strong>g><br />
Assessment <strong>of</strong> the effect <strong>of</strong> diaphragm wall installati<strong>on</strong><br />
<strong>on</strong> changes in stresses and bearing capacity is<br />
made by means <strong>of</strong> c<strong>on</strong>e pressiometer <str<strong>on</strong>g>test</str<strong>on</strong>g>s (CPT),<br />
which were performed before and after the diaphragm<br />
wall installati<strong>on</strong> in vicinity <strong>of</strong> and further<br />
away from <strong>of</strong> the trench. A change <strong>of</strong> the c<strong>on</strong>e resistance<br />
is an indicati<strong>on</strong> for a change in the bearing<br />
capacity <strong>of</strong> the piles. Figure 13 shows that there is no<br />
change in c<strong>on</strong>e resistance in the bearing sand layers<br />
and that there is a slight increase <strong>of</strong> c<strong>on</strong>e resistance<br />
and fricti<strong>on</strong> resistance in the top s<strong>of</strong>t layers. This<br />
could even be an indicati<strong>on</strong> for an increase <strong>of</strong> the<br />
pile bearing capacity, which was c<strong>on</strong>firmed by the<br />
pile load <str<strong>on</strong>g>test</str<strong>on</strong>g>s (chapter 4.6.3).<br />
4.8 Influence panel width and panel shape<br />
As was stated before the panel width hardly influenced<br />
the <str<strong>on</strong>g>test</str<strong>on</strong>g> result, which was not expected. However<br />
this may be explained by the fact that in the <str<strong>on</strong>g>test</str<strong>on</strong>g><br />
field the wide panel was installed in between two already<br />
installed panels. The presence <strong>of</strong> those two<br />
adjacent panels has probably a stiffening effect resulting<br />
in a reduced <strong>impact</strong> by the wide panel. Comparing<br />
the horiz<strong>on</strong>tal deformati<strong>on</strong>s <strong>of</strong> two adjacent<br />
panels 3 (<strong>on</strong>ly adjacent panel 2 present) and 4 (adjacent<br />
panel 3 and 5 present) indicates that there is a<br />
significant influence caused by the presence <strong>of</strong> adjacent<br />
panels and the sequence <strong>of</strong> installati<strong>on</strong> (fig. 14).<br />
The FE analyses c<strong>on</strong>firms this effect (chapter 5).<br />
5<br />
0<br />
J.C.W.M. de Wit, H.J. Lengkeek. <str<strong>on</strong>g>Full</str<strong>on</strong>g> <str<strong>on</strong>g>scale</str<strong>on</strong>g> <str<strong>on</strong>g>test</str<strong>on</strong>g> <strong>on</strong> envir<strong>on</strong>mental <strong>impact</strong> <strong>of</strong> diaphragm wall trench installati<strong>on</strong> in Amsterdam, . Proc. Int. Sym. <strong>on</strong> Geotechnical<br />
Aspects <strong>of</strong> Underground C<strong>on</strong>structi<strong>on</strong> in S<strong>of</strong>t Ground, Toulouse, 2002, France. -7-
Maximum measured X-<br />
displacement, <str<strong>on</strong>g>scale</str<strong>on</strong>g>d 10 times<br />
[m]<br />
0.0<br />
0.0<br />
-1.0<br />
-2.0<br />
-3.0<br />
-4.0<br />
-5.0<br />
-6.0<br />
Maximum measured Y-displacement, <str<strong>on</strong>g>scale</str<strong>on</strong>g>d 10 times [m]<br />
-5.0<br />
-10.0<br />
-15.0<br />
small panel 3 large panel 3<br />
-20.0<br />
panel 5a panel 1c panel 2 panel 3 panel 4<br />
INC02 INC04 INC08 INC08<br />
INC09 INC14 fit panel 3 fit panel 4<br />
Figure 14. Top view <strong>of</strong> measured horiz<strong>on</strong>tal displacements.<br />
At the irregular panel shapes (corner or Z shaped)<br />
the maximum settlements that have been m<strong>on</strong>itored<br />
are about double the <strong>impact</strong> <strong>of</strong> a rectangular panel.<br />
This is true for surface settlements, settlements <strong>on</strong><br />
deeper levels and pile settlements. This can be explained<br />
by the fact that arching in the sub ground<br />
will not develop that easy. However the <strong>impact</strong> is<br />
still limited it was decided not to allow irregular<br />
panel shapes close to historical buildings in the underground<br />
stati<strong>on</strong>s’ design .<br />
5 NUMERICAL MODELLING OF DIAPHRAGM<br />
WALL INSTALLATION<br />
Numerical modelling <strong>of</strong> the diaphragm wall installati<strong>on</strong><br />
was performed by means <strong>of</strong> finite element<br />
analyses. The main goal was to develop a validated<br />
3D FE-model that can be used to predict the soil deformati<strong>on</strong>s<br />
and envir<strong>on</strong>mental <strong>impact</strong> during the installati<strong>on</strong><br />
<strong>of</strong> the diaphragm walls for the underground<br />
stati<strong>on</strong>s for North/South line.<br />
Using a 3D FE model predicti<strong>on</strong>s were performed<br />
before the <str<strong>on</strong>g>test</str<strong>on</strong>g> program was carried out. Afterwards<br />
the FE model was validated based <strong>on</strong> the <str<strong>on</strong>g>test</str<strong>on</strong>g> results<br />
that had become available. An axial symmetric<br />
model was used as a verificati<strong>on</strong> <strong>of</strong> the 3D analyses.<br />
The calibrati<strong>on</strong> was carried out by using the <strong>of</strong>ficial<br />
North/South Line geotechnical parameter set,<br />
changing the soil parameters within a certain range.<br />
5.1 FE - model<br />
For the 3D FE-analyses the 3D versi<strong>on</strong> <strong>of</strong> PLAXIS<br />
has been used. The mesh is build <strong>of</strong> 3D-wedgeelements<br />
with 15 nodes and 6 Gauss-points. For calculati<strong>on</strong>s<br />
<strong>of</strong> <strong>on</strong>e panel a mesh with approximately<br />
5,000 nodes has been used. Only a quarter <strong>of</strong> the<br />
panel is modelled, which means that there are two<br />
planes <strong>of</strong> symmetry (see figure 15).<br />
5.2 Simulati<strong>on</strong> <strong>of</strong> installati<strong>on</strong><br />
The installati<strong>on</strong> <strong>of</strong> the diaphragm wall is usually<br />
carried out in a relative short period <strong>of</strong> time. Therefore<br />
undrained behaviour <strong>of</strong> the clay and peat layers<br />
and drained behaviour <strong>of</strong> the sand layers is assumed.<br />
The installati<strong>on</strong> involves the excavati<strong>on</strong> under bet<strong>on</strong>ite<br />
slurry support, followed by pouring and subsequent<br />
hardening <strong>of</strong> c<strong>on</strong>crete. The c<strong>on</strong>structi<strong>on</strong> <strong>of</strong> the<br />
diaphragm wall is modelled using the following<br />
stages:<br />
1. Excavate a single trench by removing the soil<br />
elements and simultaneously, applying the bent<strong>on</strong>ite<br />
pressure <strong>on</strong> the faces <strong>of</strong> the trench.<br />
2. Fill the trench with c<strong>on</strong>crete by increasing the lateral<br />
pressure. The lateral pressure <strong>of</strong> wet c<strong>on</strong>crete<br />
can be described by the bilinear relati<strong>on</strong> :<br />
σ h = γ c * z<br />
σ h = γ c * h crit + γ b * (z – h crit )<br />
z < h crit<br />
z > h crit<br />
3. To model the hardening <strong>of</strong> the c<strong>on</strong>crete, the elements<br />
in the trench are switched <strong>on</strong>, and the stiffness<br />
and volumetric parameters are changed to<br />
those <strong>of</strong> c<strong>on</strong>crete.<br />
4. C<strong>on</strong>struct the adjacent panels, <strong>on</strong>e at the time,<br />
using the same procedure, simulating the installati<strong>on</strong><br />
<strong>of</strong> a wall.<br />
In case <strong>of</strong> a c<strong>on</strong>stant pouring rate, γ 1 =γ c<strong>on</strong>crete can be<br />
adopted above the critical depth and γ 2 =γ bent<strong>on</strong>ite below<br />
the critical depth. However, the <str<strong>on</strong>g>test</str<strong>on</strong>g> program<br />
showed a different bilinear load distributi<strong>on</strong> in stage<br />
2 with a imposed load below the critical depth that is<br />
related to a higher density than bent<strong>on</strong>ite slurry,<br />
which means γ c >γ 2 >γ b . However, the calculati<strong>on</strong> results<br />
appeared not to be too sensitive to the actual<br />
value <strong>of</strong> γ 2 if γ c >γ 2 >γ b γ c >γ 2 >γ b , since the soil layers<br />
below the critical depth are bearing sand layers and<br />
stiff clay layers.<br />
5.3 3D FE predicti<strong>on</strong>s<br />
A main objective <strong>of</strong> the predicti<strong>on</strong>s is to gain understanding<br />
<strong>of</strong> the mechanisms that occur during the installati<strong>on</strong><br />
<strong>of</strong> a diaphragm wall panel. That is also the<br />
reas<strong>on</strong> why a relatively simple FE model was<br />
adopted, where:<br />
− limited number <strong>of</strong> ground layers is used;<br />
− the relatively simple Mohr Coulomb based soil<br />
model is applied;<br />
− the soil properties are taken as the mean values as<br />
determined at the soil investigati<strong>on</strong> program <strong>of</strong><br />
the North/South Line.<br />
However this resulted in a somehow simplified<br />
model, it appeared to be <strong>on</strong>e where the mechanisms<br />
that occur during installati<strong>on</strong> <strong>of</strong> diaphragm walls<br />
could be detected in a better way and it allowed for<br />
J.C.W.M. de Wit, H.J. Lengkeek. <str<strong>on</strong>g>Full</str<strong>on</strong>g> <str<strong>on</strong>g>scale</str<strong>on</strong>g> <str<strong>on</strong>g>test</str<strong>on</strong>g> <strong>on</strong> envir<strong>on</strong>mental <strong>impact</strong> <strong>of</strong> diaphragm wall trench installati<strong>on</strong> in Amsterdam, . Proc. Int. Sym. <strong>on</strong> Geotechnical<br />
Aspects <strong>of</strong> Underground C<strong>on</strong>structi<strong>on</strong> in S<strong>of</strong>t Ground, Toulouse, 2002, France. -8-
parametric studies. Summarising the next calculati<strong>on</strong>s<br />
have been carried out:<br />
1. calculati<strong>on</strong>s <strong>of</strong> a single panel in homogeneous<br />
ground as a comparis<strong>on</strong> to a model presented in a<br />
c<strong>on</strong>ference paper. The results were similar to the<br />
results that were presented in the paper.<br />
2. calculati<strong>on</strong>s <strong>of</strong> a single panel in the Amsterdam<br />
soil, which means a heterogeneous soil pr<strong>of</strong>ile<br />
3. calculati<strong>on</strong>s c<strong>on</strong>sidering succeeding panels.<br />
Figure 15 illustrates some typical results <strong>of</strong> the predicti<strong>on</strong>s.<br />
horiz<strong>on</strong>tal effective stress [kPa]<br />
300<br />
K0-situati<strong>on</strong><br />
fase I (bent<strong>on</strong>ite)<br />
200<br />
stage II (wet c<strong>on</strong>crete)<br />
100<br />
0<br />
0 1 2 3 4 5 6<br />
distance to centre <strong>of</strong> panel [m]<br />
figure 16. effective horiz<strong>on</strong>tal stresses in excavati<strong>on</strong> and c<strong>on</strong>creting<br />
stage close to trench in horiz<strong>on</strong>tal plane.<br />
0<br />
0<br />
Predicti<strong>on</strong> <strong>of</strong> horiz<strong>on</strong>tal deformati<strong>on</strong>s, stage 1<br />
[mm] (variati<strong>on</strong> <strong>of</strong> geometry)<br />
-10<br />
-20<br />
-30<br />
-40<br />
-10<br />
Figure 15. FE predicti<strong>on</strong>, shaded plot <strong>of</strong> total displacements.<br />
From the results <strong>of</strong> these FE predicti<strong>on</strong>s the next<br />
c<strong>on</strong>clusi<strong>on</strong>s could be drawn :<br />
1. 3D stress distributi<strong>on</strong> is clearly observed during<br />
both excavati<strong>on</strong> and c<strong>on</strong>creting (figure 16)<br />
2. during the excavati<strong>on</strong> <strong>of</strong> the trench small settlements<br />
and horiz<strong>on</strong>tal deformati<strong>on</strong>s in the directi<strong>on</strong><br />
<strong>of</strong> the trench occur.<br />
3. during c<strong>on</strong>creting heave and horiz<strong>on</strong>tal deformati<strong>on</strong>s<br />
away form the trench occur as a result <strong>of</strong> the<br />
hydrostatic wet c<strong>on</strong>crete pressures.<br />
4. there is a limited influence <strong>of</strong> the depth <strong>of</strong> the<br />
trench. This can be explained by the heterogeneous<br />
soil pr<strong>of</strong>ile where vertical arching between<br />
the stiff sand layers reduce the effect <strong>of</strong> the trench<br />
depth ( figure 17);<br />
5. there is a significant influence <strong>of</strong> the width <strong>of</strong> the<br />
trench; this was not observed during the <str<strong>on</strong>g>test</str<strong>on</strong>g> program<br />
and became subject <strong>of</strong> further research at<br />
the FE validati<strong>on</strong>s.<br />
Depth [m NAP]<br />
-20<br />
-30<br />
-40<br />
-50<br />
-60<br />
-70<br />
-80<br />
b=6,2 l=30 b=2,7 l=30 b=2,7 l=50<br />
Figure 17. Illustrati<strong>on</strong> vertical arching in heterogeneous<br />
ground.<br />
5.4 3D FE validati<strong>on</strong>s<br />
5.4.1 General<br />
It is important to menti<strong>on</strong> that the aim <strong>of</strong> the validati<strong>on</strong><br />
was not a perfect fit <strong>of</strong> the <str<strong>on</strong>g>test</str<strong>on</strong>g> results, but rather<br />
a safe upper bound approach that can be used in the<br />
stati<strong>on</strong>s’ design. Since the deformati<strong>on</strong>s that have<br />
been measured are very small inaccuracies in the<br />
system could play a role. Based <strong>on</strong> the results <strong>of</strong> the<br />
predicti<strong>on</strong>s, the <str<strong>on</strong>g>test</str<strong>on</strong>g> program and the interpretati<strong>on</strong>s<br />
the FE model was already corrected in advance (step<br />
1):<br />
− More ground layers were introduced.<br />
− Use <strong>of</strong> advanced n<strong>on</strong> linear soil models that is<br />
necessary to obtain a proper validati<strong>on</strong> (Gourvenec<br />
et al 1999). The c<strong>on</strong>stitutive model that was<br />
selected is the Hardening-Soil model. In the<br />
Hardening Soil model the limiting states <strong>of</strong> stress<br />
L<br />
B<br />
2,05m<br />
J.C.W.M. de Wit, H.J. Lengkeek. <str<strong>on</strong>g>Full</str<strong>on</strong>g> <str<strong>on</strong>g>scale</str<strong>on</strong>g> <str<strong>on</strong>g>test</str<strong>on</strong>g> <strong>on</strong> envir<strong>on</strong>mental <strong>impact</strong> <strong>of</strong> diaphragm wall trench installati<strong>on</strong> in Amsterdam, . Proc. Int. Sym. <strong>on</strong> Geotechnical<br />
Aspects <strong>of</strong> Underground C<strong>on</strong>structi<strong>on</strong> in S<strong>of</strong>t Ground, Toulouse, 2002, France. -9-
are described by means <strong>of</strong> the fricti<strong>on</strong> angle, φ,<br />
the cohesi<strong>on</strong>, c, and the dilatancy angle, ϕ. The<br />
soil stiffness is described much more accurately<br />
by using three different input stiffness’: the triaxial<br />
loading stiffness, E 50 , the triaxial unloading<br />
stiffness, E ur , and the oedometer loading stiffness,<br />
E oed . In c<strong>on</strong>trast to the Mohr-Coulomb model, the<br />
Hardening-Soil model also accounts for stressdependency<br />
<strong>of</strong> stiffness moduli. This means that<br />
all stiffness’ increase with pressure (figure 18).<br />
− Higher strength and stiffness for the especially the<br />
deeper soil layers, since the FE predicti<strong>on</strong>s did result<br />
in substantial larger deformati<strong>on</strong>s than were<br />
measured.<br />
The sec<strong>on</strong>d step was a more fine tuning calibrati<strong>on</strong><br />
which eventually resulted in the so called best fit <strong>of</strong><br />
the <str<strong>on</strong>g>test</str<strong>on</strong>g> results(BF). Besides that the soil parameter<br />
set which has been developed for the North/South<br />
Line was introduced in the validati<strong>on</strong> process (NZ).<br />
However to get results which are comparable to the<br />
<str<strong>on</strong>g>test</str<strong>on</strong>g> results, upper bound values from the<br />
North/South Line parameter set for strength and<br />
stiffness had to be applied for the first sand layers<br />
and deeper layers. The best fit parameter set c<strong>on</strong>tained<br />
even higher values for these properties. However<br />
the upper bound North/South Line approach results<br />
in a safe upper bound <strong>of</strong> the <str<strong>on</strong>g>test</str<strong>on</strong>g> results.<br />
Depth [m NAP]<br />
0<br />
-10<br />
-20<br />
-30<br />
-40<br />
Horiz<strong>on</strong>tal displacements, stage 2 [mm]<br />
0 20 40 60 80 100 120<br />
Test result Best Fit (BF) North/Southline par.set (NZ)<br />
Figure 19. Horiz<strong>on</strong>tal displacements after diaphragm wall installati<strong>on</strong><br />
at 1.2 m distance from trench: 3D FE analyses.<br />
Figure 20 shows the maximum vertical deformati<strong>on</strong>s<br />
<strong>of</strong> the 1 st sand layer at the level NAP-15 m.<br />
Again the FE results are comparable to the <str<strong>on</strong>g>test</str<strong>on</strong>g> results.<br />
These vertical displacement are especially<br />
relevant because the sand layer is in most cases the<br />
foundati<strong>on</strong> layer <strong>of</strong> the timber piles.<br />
2,05m<br />
hardening<br />
shear locus<br />
4.0<br />
Horiz<strong>on</strong>tal distance from panel [m]<br />
0 5 10 15 20<br />
cap with<br />
compressi<strong>on</strong><br />
hardening<br />
Figure Figure 18. PLAXIS 5: Hardening Plaxis Hardening soil model. Soil model<br />
Vertical displacements [mm]<br />
2.0<br />
0.0<br />
-2.0<br />
-4.0<br />
-6.0<br />
-8.0<br />
ca. -15m<br />
5.4.2 Calculati<strong>on</strong> results for a single panel<br />
Figure 19 shows the maximum horiz<strong>on</strong>tal displacements<br />
at the centre <strong>of</strong> the panel, at approximately 2<br />
m from the trench. The maximum displacement occurs<br />
in the Holocene top-layers. The calculati<strong>on</strong>s<br />
with NZ parameters and in particular the BF parameters<br />
are in good agreement with the <str<strong>on</strong>g>test</str<strong>on</strong>g>-results.<br />
Extensometer (no corr.)<br />
D-wall<br />
North/Southline par.set (NZ)<br />
Extensometer (correcti<strong>on</strong>)<br />
Best-Fit (BF)<br />
Predicti<strong>on</strong> (MC-model)<br />
Figure 20. Vertical displacements after diaphragm wall installati<strong>on</strong><br />
at NAP-15 m: 3D FE analyses.<br />
5.4.3 Influence <strong>of</strong> panel size and installati<strong>on</strong> sequence<br />
At the <str<strong>on</strong>g>test</str<strong>on</strong>g> site 5 panels were m<strong>on</strong>itored with different<br />
length, width and shape. Like the FE predicti<strong>on</strong>s<br />
also the validati<strong>on</strong>s showed an increase <strong>of</strong> <strong>impact</strong><br />
when the width <strong>of</strong> a panel increases. However, this<br />
was not found at the <str<strong>on</strong>g>test</str<strong>on</strong>g> program where also a wide<br />
J.C.W.M. de Wit, H.J. Lengkeek. <str<strong>on</strong>g>Full</str<strong>on</strong>g> <str<strong>on</strong>g>scale</str<strong>on</strong>g> <str<strong>on</strong>g>test</str<strong>on</strong>g> <strong>on</strong> envir<strong>on</strong>mental <strong>impact</strong> <strong>of</strong> diaphragm wall trench installati<strong>on</strong> in Amsterdam, . Proc. Int. Sym. <strong>on</strong> Geotechnical<br />
Aspects <strong>of</strong> Underground C<strong>on</strong>structi<strong>on</strong> in S<strong>of</strong>t Ground, Toulouse, 2002, France. -10-
panel was part <strong>of</strong> the <str<strong>on</strong>g>test</str<strong>on</strong>g> field. The reas<strong>on</strong> for this<br />
apparent discrepancy probably was the installati<strong>on</strong><br />
sequence <strong>of</strong> the panels. The adjacent narrow panels<br />
(width 2.7 m) were installed before the wide panel in<br />
a relatively undisturbed subsoil whereas the wide<br />
panel (length is 6.4 m) was installed in between two<br />
former installed panels. Those adjacent panels<br />
causes a reducti<strong>on</strong> <strong>of</strong> the displacements because <strong>of</strong>:<br />
− load transfer to the adjacent stiff c<strong>on</strong>crete panels;<br />
− hardening <strong>of</strong> the soil due to the installati<strong>on</strong> <strong>of</strong> the<br />
adjacent panels the soil is overc<strong>on</strong>solidated.<br />
To c<strong>on</strong>firm this explanati<strong>on</strong> the described situati<strong>on</strong><br />
is simulated with the 3D FE model. Figure 21 shows<br />
the horiz<strong>on</strong>tal displacements <strong>of</strong> single panels with a<br />
width <strong>of</strong> 3.2 m (narrow) and 6.4 m (wide). The horiz<strong>on</strong>tal<br />
displacement after stage 2 <strong>of</strong> the single wide<br />
panel is about two times the displacement <strong>of</strong> the narrow<br />
panel. In the same figure also the results are<br />
shown <strong>of</strong> a wide panel in between two former installed<br />
panels “b=6.2m enclosed (NZ)”. It can be<br />
c<strong>on</strong>cluded that the horiz<strong>on</strong>tal deformati<strong>on</strong>s are significantly<br />
smaller than for a single wide panel, which<br />
meets the explanati<strong>on</strong> made above.<br />
Depth [m NAP]<br />
0<br />
-10<br />
-20<br />
-30<br />
-40<br />
Calculated horiz<strong>on</strong>tal displacements 2 [mm]<br />
0 50 100 150 200<br />
b=3,2m (NZ) b=6,2m (NZ) b=6,2m enclosed (NZ)<br />
Figure 21. Horiz<strong>on</strong>tal displacements <strong>of</strong> single panel (narrow<br />
and wide) and enclosed wide panel: 3D FE analyses.<br />
5.5 Axial symmetric model<br />
In combinati<strong>on</strong> with the 3D FE model a 2D FE axial<br />
symmetric model was used to <str<strong>on</strong>g>test</str<strong>on</strong>g> the 3D model and<br />
to investigate all kinds <strong>of</strong> features like the behaviour<br />
<strong>of</strong> the (s<strong>of</strong>t) top layers. The 2D axial symmetric<br />
analyses c<strong>on</strong>firms the c<strong>on</strong>clusi<strong>on</strong>s <strong>of</strong> minor displacements<br />
during excavati<strong>on</strong> (stage 1). It also<br />
shows that the s<strong>of</strong>t clay layers were pushed aside<br />
when the c<strong>on</strong>crete load is applied (stage 2). However,<br />
the results <strong>of</strong> the 2D axial symmetric model<br />
can not be used for validati<strong>on</strong> purposes it appeared<br />
2,05m<br />
to be a very powerful tool, since it can be applied<br />
very easily and parametric studies can be carried out<br />
in a very short period <strong>of</strong> time. Despite <strong>of</strong> the differences<br />
<strong>of</strong> a circular and rectangular trench, the 2D<br />
axial symmetric model gives a reas<strong>on</strong>able impressi<strong>on</strong><br />
<strong>of</strong> mechanisms, the stress distributi<strong>on</strong> and the<br />
extent <strong>of</strong> deformati<strong>on</strong>s, which can be very useful developing<br />
the 3D model.<br />
6 FINAL CONCLUSIONS<br />
First <strong>of</strong> all it is important to c<strong>on</strong>clude that the full<br />
<str<strong>on</strong>g>scale</str<strong>on</strong>g> <str<strong>on</strong>g>test</str<strong>on</strong>g> did come up to its expectati<strong>on</strong>s. The goals<br />
that were defined in advanced were all more or less<br />
satisfied :<br />
− the installati<strong>on</strong> <strong>of</strong> a diaphragm wall has a minor<br />
envir<strong>on</strong>mental <strong>impact</strong> and no affect <strong>on</strong> the bearing<br />
capacity <strong>of</strong> the piles;<br />
− panels with a irregular shape, like corner panels<br />
or a Z shaped panel resulting in a substantial<br />
higher <strong>impact</strong>. It is recommended not to apply<br />
these panels when the distance to adjacent buildings<br />
is small<br />
− modelling the excavati<strong>on</strong> and c<strong>on</strong>creting <strong>of</strong> a diaphragm<br />
wall is reliable using the 3D Finite Element<br />
Method including advanced n<strong>on</strong> linear c<strong>on</strong>stitutive<br />
soil models.<br />
− The applicati<strong>on</strong> <strong>of</strong> the upper bound North/South<br />
Line set for soil properties results in a safe upper<br />
bound <strong>of</strong> the <str<strong>on</strong>g>test</str<strong>on</strong>g> results and can be used in the<br />
underground stati<strong>on</strong>s’ design.<br />
REFERENCES<br />
Gourvenec, S.M. & W. Powrie (1999). Three-dimensi<strong>on</strong>al finite-element<br />
analysis <strong>of</strong> diaphragm wall installati<strong>on</strong>. Geotechnique<br />
49, No. 6, 801-823.<br />
Lings, M.L. & C.W.W. Ng & D.F.T. Nash (1994). The lateral<br />
pressure <strong>of</strong> wet c<strong>on</strong>crete in diaphragm wall panels cast under<br />
bent<strong>on</strong>ite. Proc. Instn. Civ. Engrs Geotech. Engng 107,<br />
July, 163-172.<br />
Cowland, J.W. & Thorley, C.B.B. 1984, Ground and building<br />
settlement associated with adjacent slurry trench excavati<strong>on</strong>,<br />
Proceedings third c<strong>on</strong>ference <strong>on</strong> ground movements<br />
and structures, p. 723-728.<br />
Lings, M.L. & Ng, C.W.W. & Nash, D.F.T. (1994), The lateral<br />
pressure <strong>of</strong> wet c<strong>on</strong>crete in diaphragm wall panels cast under<br />
bent<strong>on</strong>ite, Proc. Instn. Civ. Engrs. Geotech. Engng, 163-<br />
172.<br />
Ng, C.W.W & Lings, M.L. & Simps<strong>on</strong>, B. & Nash, D.F.T.<br />
(1995). An approximate analysis <strong>of</strong> he three-dimensi<strong>on</strong>al effects<br />
<strong>of</strong> diaphragm wall installati<strong>on</strong>, Geotechnique 45, No 3,<br />
497-507.<br />
Ng, C.W.W. & Yan, R.W.M.(1998). Predicti<strong>on</strong> <strong>of</strong> Ground Deformati<strong>on</strong>s<br />
during a diaphragm wall panel c<strong>on</strong>struci<strong>on</strong>, 13 e<br />
Southeast Asian Geotechncal C<strong>on</strong>ference, Taiwan.<br />
Ng, C.W.W. & Yan, R.W.M. (1998b), Stress Transfer and Deformati<strong>on</strong><br />
Mechanisms around a Diaphragm wall panel,<br />
J.C.W.M. de Wit, H.J. Lengkeek. <str<strong>on</strong>g>Full</str<strong>on</strong>g> <str<strong>on</strong>g>scale</str<strong>on</strong>g> <str<strong>on</strong>g>test</str<strong>on</strong>g> <strong>on</strong> envir<strong>on</strong>mental <strong>impact</strong> <strong>of</strong> diaphragm wall trench installati<strong>on</strong> in Amsterdam, . Proc. Int. Sym. <strong>on</strong> Geotechnical<br />
Aspects <strong>of</strong> Underground C<strong>on</strong>structi<strong>on</strong> in S<strong>of</strong>t Ground, Toulouse, 2002, France. -11-
Journal <strong>of</strong> geotechnical and geoenvir<strong>on</strong>mental engineering.<br />
Vol. 124, No. 7, July 1998.<br />
Wit, de J.C.W.M. (1998). Design <strong>of</strong> underground stati<strong>on</strong>s <strong>on</strong><br />
the North/South line. Proc. <strong>of</strong> the World Tunnel C<strong>on</strong>gres,<br />
Sao Paulo.<br />
Wit, de J.C.W.M. & J.C.S Roelands & M. de Kant (1999). <str<strong>on</strong>g>Full</str<strong>on</strong>g><br />
<str<strong>on</strong>g>scale</str<strong>on</strong>g> <str<strong>on</strong>g>test</str<strong>on</strong>g> <strong>on</strong> envir<strong>on</strong>mental <strong>impact</strong> <strong>of</strong> diphragm wall trench<br />
excavati<strong>on</strong> in Amsterdam. Proc. Int. Sym. <strong>on</strong> Geotechnical<br />
Aspects <strong>of</strong> Underground C<strong>on</strong>structi<strong>on</strong> in S<strong>of</strong>t Ground, Tokyo,<br />
Japan, 723-730.<br />
Wit, de J.C.W.M. & Lengkeek (2002), H.J.<str<strong>on</strong>g>Full</str<strong>on</strong>g> <str<strong>on</strong>g>scale</str<strong>on</strong>g> <str<strong>on</strong>g>test</str<strong>on</strong>g> <strong>on</strong><br />
envir<strong>on</strong>mental <strong>impact</strong> <strong>of</strong> diphragm wall trench excavati<strong>on</strong> in<br />
Amsterdam – the final results. Proc. Int. Sym. <strong>on</strong> Geotechnical<br />
Aspects <strong>of</strong> Underground C<strong>on</strong>structi<strong>on</strong> in S<strong>of</strong>t Ground,<br />
Toulouse, France.<br />
J.C.W.M. de Wit, H.J. Lengkeek. <str<strong>on</strong>g>Full</str<strong>on</strong>g> <str<strong>on</strong>g>scale</str<strong>on</strong>g> <str<strong>on</strong>g>test</str<strong>on</strong>g> <strong>on</strong> envir<strong>on</strong>mental <strong>impact</strong> <strong>of</strong> diaphragm wall trench installati<strong>on</strong> in Amsterdam, . Proc. Int. Sym. <strong>on</strong> Geotechnical<br />
Aspects <strong>of</strong> Underground C<strong>on</strong>structi<strong>on</strong> in S<strong>of</strong>t Ground, Toulouse, 2002, France. -12-