Job Vacancy Survey for Spring 2006 - CDLE Home
Job Vacancy Survey for Spring 2006 - CDLE Home
Job Vacancy Survey for Spring 2006 - CDLE Home

You also want an ePaper? Increase the reach of your titles
YUMPU automatically turns print PDFs into web optimized ePapers that Google loves.
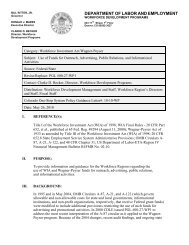
Colorado <strong>Job</strong> <strong>Vacancy</strong> <strong>Survey</strong><br />
Denver Metro Region<br />
<strong>Spring</strong> <strong>2006</strong><br />
Boulder<br />
Broomfield<br />
Adams<br />
<strong>Survey</strong> Conducted<br />
April 14 – June 27, <strong>2006</strong><br />
Jefferson<br />
Denver<br />
Douglas<br />
Arapahoe<br />
Funding Provided in Part by<br />
The Colorado Work<strong>for</strong>ce Development Council<br />
This report is a product of the Colorado<br />
Department of Labor and Employment’s Labor<br />
Market In<strong>for</strong>mation Section and was prepared<br />
by members of the Work<strong>for</strong>ce Research and<br />
Analysis unit.<br />
Analyst <strong>for</strong> this report: Allyson Reedy<br />
Work<strong>for</strong>ce Research & Analysis<br />
Labor Market In<strong>for</strong>mation<br />
Colorado Department of Labor & Employment<br />
633 17th Street, Suite 600<br />
Denver, CO 80202-3660<br />
State of Colorado<br />
Bill Owens, Governor<br />
Colorado Department of Labor & Employment<br />
Rick Grice, Executive Director<br />
(303) 318-8890 Email: lmi@state.co.us<br />
www.cowork<strong>for</strong>ce.com/lmi/wra/home.htm<br />
This survey is conducted semi-annually. Comments, suggestions, and questions regarding content and <strong>for</strong>mat<br />
are welcome and may be addressed to the Work<strong>for</strong>ce Research & Analysis unit, Labor Market In<strong>for</strong>mation,<br />
Colorado Department of Labor and Employment. Material presented here is in the public domain and, with<br />
appropriate credit, may be reproduced without permission. Please reference: Colorado Department of Labor and<br />
Employment, Labor Market In<strong>for</strong>mation, Work<strong>for</strong>ce Research and Analysis.
Denver Metro Region JVS —<strong>Spring</strong> <strong>2006</strong><br />
2<br />
The Denver Metro Region <strong>Survey</strong><br />
The <strong>Spring</strong> <strong>2006</strong> Denver Metro <strong>Job</strong> <strong>Vacancy</strong> <strong>Survey</strong> (JVS) was conducted<br />
from April 14th through June 27th, <strong>2006</strong>. The goal of the survey is to provide<br />
current in<strong>for</strong>mation on the demand <strong>for</strong> workers. This in<strong>for</strong>mation can serve as<br />
input into the decision making process <strong>for</strong> employers, job seekers, economic<br />
developers, educators, and work<strong>for</strong>ce centers in the region.<br />
Over the survey period, all large and government employers as well as a random<br />
sample of private employers with five or more employees were contacted.<br />
Employers were asked if they were actively hiring, and the number of positions<br />
they were seeking to fill.<br />
<strong>Job</strong> <strong>Vacancy</strong> <strong>Survey</strong> Regions<br />
The Denver Metro <strong>Job</strong> <strong>Vacancy</strong> <strong>Survey</strong> is conducted<br />
twice a year to provide frequent and timely analysis of the<br />
demand <strong>for</strong> labor. Previous surveys collected occupational<br />
and wage in<strong>for</strong>mation. The new JVS will not be reporting at<br />
this level of detail but will still give the estimate of total job<br />
vacancies in the region to the same degree of accuracy as<br />
be<strong>for</strong>e, only quicker.<br />
A total of 5,985 employers, representing 37% of the<br />
region’s total employment responded to the survey. Of these,<br />
313 are Government agencies, 323 are large employers and<br />
5,349 are small to mid-size entities. The survey has a response<br />
rate of 92%. The margin of sampling error <strong>for</strong> the overall<br />
vacancy estimate is plus or minus .06%, or approximately 26<br />
vacancies.<br />
Findings of the <strong>Survey</strong>:<br />
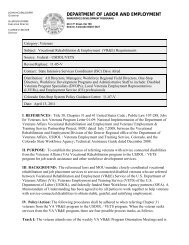
An estimated 39,717 jobs were available <strong>for</strong> hire during the survey period, up from the<br />
23,300 vacancies found last spring.<br />
Retail Trade has the highest number of estimated vacancies (5,791), followed by<br />
Accommodation & Food Services (4,618) and Heath Care & Social Assistance (3,598).<br />
Small to mid-size companies provide the most vacancies with 25,296. However, since more<br />
small to mid-size firms are surveyed, there are actually fewer vacancies per employer than<br />
with large or Government employers. There are on average 24 vacancies per large private<br />
firm and 8 vacancies per Government entity, compared to an average of about 5 vacancies per<br />
small to mid-size employer.<br />
Twenty-six percent of surveyed employers reported at least one job vacancy.
Denver Metro Region JVS —<strong>Spring</strong> <strong>2006</strong><br />
3<br />
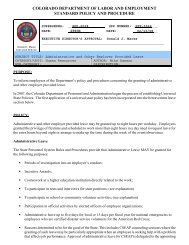
<strong>Job</strong> Vacancies<br />
Vacancies<br />
Employment<br />
Unemployment<br />
Unemployment Rate<br />
Fall<br />
2000<br />
35,000<br />
1,352,898<br />
33,999<br />
2.5%<br />
<strong>Spring</strong><br />
2001<br />
24,100<br />
1,343,789<br />
40,080<br />
2.9%<br />
Fall<br />
2001<br />
26,400<br />
1,328,929<br />
80,794<br />
5.7%<br />
<strong>Spring</strong><br />
2002<br />
24,200<br />
1,304,427<br />
78,032<br />
5.6%<br />
Fall<br />
2002<br />
11,200<br />
1,310,779<br />
82,295<br />
5.9%<br />
<strong>Spring</strong><br />
2003<br />
14,500<br />
1,322,440<br />
87,339<br />
6.2%<br />
Fall<br />
2003<br />
16,300<br />
1,340,678<br />
86,095<br />
6.0%<br />
<strong>Spring</strong><br />
2004<br />
16,600<br />
1,341,318<br />
75,790<br />
5.3%<br />
Fall<br />
2004<br />
17,200<br />
1,368,016<br />
77,381<br />
5.4%<br />
<strong>Spring</strong><br />
2005<br />
23,300<br />
1,368,003<br />
72,973<br />
5.1%<br />
Fall<br />
2005<br />
30,121<br />
1,384,196<br />
67,539<br />
4.7%<br />
<strong>Spring</strong><br />
<strong>2006</strong><br />
39,717<br />
1,415,189<br />
63,882<br />
4.3%<br />
Source: <strong>CDLE</strong>, Local Area Unemployment Statistics, Released June <strong>2006</strong>
Denver Metro Region JVS —<strong>Spring</strong> <strong>2006</strong><br />
4<br />
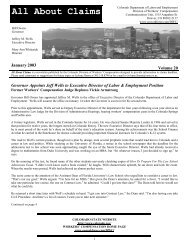
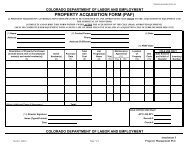
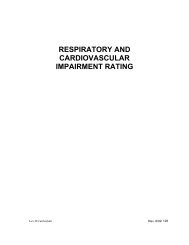
Denver Metro Employers and Employees, 2nd Quarter 2005<br />
Source: <strong>CDLE</strong>, Quarterly Census of<br />
Employment and Wages [QCEW]
Denver Metro Region JVS —<strong>Spring</strong> <strong>2006</strong><br />
5<br />
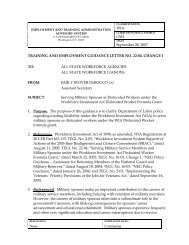
Estimated Vacancies by NAICS Sectors *<br />
The North American Industry Classification System (NAICS) classifies organizations into<br />
different industries based upon how the organization produces goods and services.<br />
With the exception of Health Care & Social Assistance and Agriculture, Forestry, Fishing &<br />
Hunting, all JVS sectors have more estimated vacancies this survey than at the same time last<br />
year. The top three sectors —Retail Trade, Accommodation & Food Services and Health Care &<br />
Social Assistance—make up almost 40% of Denver Metro’s total vacancies. Mining, Transportation<br />
& Warehousing and Real Estate & Rental & Leasing experienced the highest percentage<br />
growth in job openings this spring compared to last.<br />
*Excludes firms with fewer than 5 employees
Denver Metro Region JVS —<strong>Spring</strong> <strong>2006</strong><br />
6<br />
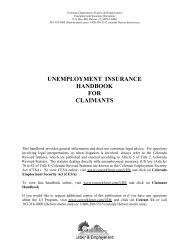
Estimated Vacancies by Employer Size<br />
30,000<br />
25,296<br />
20,000<br />
Vacancies<br />
10,000<br />
7,793<br />
-<br />
2,428<br />
4,200<br />
Government Large Small to Mid-Size Micro<br />
Employer Sizes:<br />
Large = Firms with 250 or more employees<br />
Small to Mid-Size = Firms with 5 to 249 employees<br />
Micro = Firms with fewer than 5 employees
Denver Metro Region JVS —<strong>Spring</strong> <strong>2006</strong><br />
7<br />
Vacancies by County *<br />
*Excludes firms with fewer than 5 employees
Denver Metro Region JVS —<strong>Spring</strong> <strong>2006</strong><br />
8<br />
Denver Metro Region Occupational Employment Statistics (OES) Wages (Nov. 2004 wages based on data released Nov. 2005)<br />
SOC<br />
Code<br />
SOC Occupational Title<br />
Entry-<br />
Level<br />
Average Wages<br />
Overall<br />
Experienced<br />
Percentile Distribution<br />
10th 25th 50th 75th 90th<br />
11-1011 Chief Executives † $82.35 † $49.63 $65.66 † † †<br />
11-1021 General and Operations Managers $25.75 $51.85 $64.89 $22.76 $31.15 $45.54 $68.36 †<br />
11-2011 Advertising and Promotions Managers $20.05 $35.57 $43.34 $17.96 $22.52 $30.27 $48.00 $58.67<br />
11-2021 Marketing Managers $26.47 $45.34 $54.78 $24.23 $30.17 $40.26 $56.35 †<br />
11-2022 Sales Managers $28.50 $51.23 $62.59 $24.77 $33.55 $47.07 $64.19 †<br />
11-2031 Public Relations Managers $24.97 $43.03 $52.06 $21.08 $29.67 $43.12 $54.33 $65.14<br />
11-3011 Administrative Services Managers $21.23 $34.06 $40.47 $19.10 $24.83 $31.94 $41.16 $53.35<br />
11-3021 Computer and In<strong>for</strong>mation Systems Managers $36.38 $52.17 $60.07 $35.08 $41.04 $50.32 $61.46 †<br />
11-3031 Financial Managers $29.82 $47.80 $56.79 $28.48 $32.93 $42.62 $55.99 †<br />
11-3041 Compensation and Benefits Managers $22.21 $35.55 $42.22 $20.31 $24.53 $31.42 $41.52 $56.63<br />
11-3042 Training and Development Managers $23.89 $37.82 $44.79 $21.25 $27.28 $35.51 $44.07 $54.54<br />
11-3049 Human Resources Managers, All Other $30.98 $44.91 $51.88 $28.17 $35.42 $42.76 $53.26 $65.32<br />
11-3051 Industrial Production Managers $24.53 $39.64 $47.20 $21.52 $28.30 $34.56 $48.20 $65.12<br />
11-3061 Purchasing Managers $26.68 $40.87 $47.96 $23.64 $30.49 $38.99 $50.13 $60.90<br />
11-3071 Transportation, Storage, and Distribution Managers $22.95 $34.76 $40.67 $21.53 $25.74 $32.57 $41.58 $52.08<br />
11-9021 Construction Managers $26.52 $39.42 $45.87 $24.06 $29.35 $36.42 $45.10 $57.14<br />
Education Administrators, Preschool and Child Care<br />
11-9031<br />
Center/Program<br />
$10.71 $16.65 $19.62 $9.97 $11.31 $14.69 $20.92 $26.84<br />
Education Administrators, Elementary and Secondary<br />
* 11-9032<br />
School<br />
$60,643 $78,251 $87,054 $58,716 $67,428 $79,430 $90,274 $102,744<br />
11-9033 Education Administrators, Postsecondary $21.22 $36.12 $43.57 $18.42 $24.29 $30.94 $42.70 $59.67<br />
11-9039 Education Administrators, All Other $19.01 $30.38 $36.06 $16.01 $22.54 $29.81 $39.25 $44.70<br />
11-9041 Engineering Managers $38.60 $53.69 $61.23 $36.97 $42.46 $50.80 $62.43 †<br />
11-9051 Food Service Managers $18.22 $28.95 $34.32 $17.39 $19.66 $26.06 $38.39 $45.95<br />
11-9061 Funeral Directors $16.80 $19.15 $20.32 $15.43 $17.35 $18.96 $20.65 $23.38<br />
11-9081 Lodging Managers $14.91 $32.10 $40.70 $14.36 $16.47 $25.24 $49.89 $65.06<br />
* annual wage data<br />
† insufficient wage data
Denver Metro Region JVS —<strong>Spring</strong> <strong>2006</strong><br />
9<br />
Denver Metro Region Occupational Employment Statistics (OES) Wages (Nov. 2004 wages based on data released Nov. 2005) – 2<br />
SOC<br />
Code<br />
SOC Occupational Title<br />
Entry-<br />
Level<br />
Average Wages<br />
Overall<br />
Experienced<br />
Percentile Distribution<br />
10th 25th 50th 75th 90th<br />
11-9111 Medical and Health Services Managers $24.35 $37.50 $44.07 $21.52 $28.61 $35.90 $44.56 $55.23<br />
11-9121 Natural Sciences Managers $33.39 $48.74 $56.42 $30.41 $37.77 $47.42 $56.10 $68.60<br />
11-9131 Postmasters and Mail Superintendents $21.63 $29.65 $33.66 $19.85 $23.75 $28.90 $36.81 $41.35<br />
Property, Real Estate, and Community Association<br />
11-9141<br />
Managers<br />
$12.62 $24.93 $31.09 $12.07 $13.47 $19.65 $32.45 $45.27<br />
11-9151 Social and Community Service Managers $16.72 $25.39 $29.72 $15.47 $18.08 $23.43 $29.50 $39.29<br />
11-9199 Managers, All Other $29.32 $45.94 $54.25 $25.44 $34.73 $45.57 $54.12 $66.84<br />
Agents and Business Managers of Artists, Per<strong>for</strong>mers, and<br />
13-1011<br />
Athletes<br />
$16.08 $28.19 $34.25 $14.84 $19.67 $26.24 $31.59 $48.71<br />
13-1021 Purchasing Agents and Buyers, Farm Products $16.58 $24.03 $27.75 $14.76 $18.98 $23.35 $27.78 $37.56<br />
13-1022 Wholesale and Retail Buyers, Except Farm Products $13.57 $20.93 $24.61 $12.30 $15.02 $17.97 $24.36 $33.38<br />
Purchasing Agents, Except Wholesale, Retail, and Farm<br />
13-1023<br />
Products<br />
$18.02 $25.87 $29.80 $16.95 $20.27 $24.76 $30.77 $37.94<br />
13-1031 Claims Adjusters, Examiners, and Investigators $18.23 $26.19 $30.17 $17.49 $19.38 $23.26 $30.55 $38.80<br />
Compliance Officers, Except Agriculture, Construction,<br />
13-1041<br />
Health and Safety, and Transportati<br />
$20.14 $27.69 $31.46 $18.29 $22.22 $26.99 $32.61 $38.85<br />
13-1051 Cost Estimators $18.77 $27.27 $31.52 $18.17 $20.92 $26.02 $32.58 $40.13<br />
13-1071 Employment, Recruitment, and Placement Specialists $14.88 $24.61 $29.47 $14.03 $16.64 $21.23 $29.22 $38.46<br />
13-1072 Compensation, Benefits, and <strong>Job</strong> Analysis Specialists $17.20 $26.33 $30.89 $15.74 $19.31 $24.95 $31.94 $38.37<br />
13-1073 Training and Development Specialists $15.19 $24.38 $28.97 $14.28 $18.03 $24.17 $30.56 $36.09<br />
Human Resources, Training, and Labor Relations<br />
13-1079<br />
Specialists, All Other<br />
$16.16 $26.57 $31.77 $14.58 $19.31 $25.14 $32.36 $40.93<br />
13-1081 Logisticians $22.24 $32.15 $37.10 $20.57 $24.75 $30.72 $38.81 $46.32<br />
13-1111 Management Analysts $19.85 $35.68 $43.60 $18.05 $22.80 $31.52 $42.68 $63.25<br />
13-1121 Meeting and Convention Planners $15.13 $21.97 $25.40 $14.18 $16.98 $20.66 $26.48 $32.54<br />
13-1199 Business Operations Specialists, All Other $19.01 $30.99 $36.99 $17.29 $21.58 $28.94 $37.75 $48.68<br />
13-2011 Accountants and Auditors $18.06 $29.04 $34.52 $16.43 $20.68 $25.86 $33.76 $43.12<br />
* annual wage data<br />
† insufficient wage data
Denver Metro Region JVS —<strong>Spring</strong> <strong>2006</strong><br />
10<br />
Denver Metro Region Occupational Employment Statistics (OES) Wages (Nov. 2004 wages based on data released Nov. 2005) – 3<br />
SOC<br />
Code<br />
SOC Occupational Title<br />
Entry-<br />
Level<br />
Average Wages<br />
Overall<br />
Experienced<br />
Percentile Distribution<br />
10th 25th 50th 75th 90th<br />
13-2021 Appraisers and Assessors of Real Estate $18.43 $28.39 $33.37 $17.86 $19.96 $25.92 $34.81 $42.05<br />
13-2031 Budget Analysts $22.02 $30.03 $34.04 $20.34 $23.79 $29.14 $35.99 $41.55<br />
13-2041 Credit Analysts $18.23 $29.50 $35.13 $17.31 $20.64 $26.90 $34.77 $44.02<br />
13-2051 Financial Analysts $18.40 $32.25 $39.17 $17.10 $20.41 $27.52 $38.30 $51.18<br />
13-2052 Personal Financial Advisors $16.24 $30.09 $37.02 $14.81 $19.22 $26.66 $35.83 $50.26<br />
13-2053 Insurance Underwriters $16.61 $30.08 $36.81 $15.03 $19.05 $27.03 $35.94 $43.00<br />
13-2061 Financial Examiners $19.70 $36.24 $44.51 $17.60 $22.02 $33.33 $42.99 $57.12<br />
13-2071 Loan Counselors $14.88 $22.02 $25.59 $13.48 $16.61 $20.86 $25.41 $32.29<br />
13-2072 Loan Officers $15.74 $29.35 $36.16 $14.48 $18.27 $25.51 $32.99 $46.28<br />
13-2081 Tax Examiners, Collectors, and Revenue Agents $18.13 $27.92 $32.82 $16.30 $20.27 $25.80 $36.01 $42.60<br />
13-2082 Tax Preparers $9.10 $16.51 $20.22 $8.41 $10.07 $17.62 $22.00 $26.29<br />
13-2099 Financial Specialists, All Other $18.62 $29.75 $35.31 $16.21 $21.38 $27.64 $33.48 $41.92<br />
15-1011 Computer and In<strong>for</strong>mation Scientists, Research $27.51 $42.10 $49.39 $23.20 $33.03 $42.89 $51.82 $59.40<br />
15-1021 Computer Programmers $21.86 $34.10 $40.21 $19.82 $25.24 $32.57 $42.00 $52.13<br />
15-1031 Computer Software Engineers, Applications $28.61 $39.35 $44.72 $26.71 $32.37 $39.31 $45.23 $53.57<br />
15-1032 Computer Software Engineers, Systems Software $28.90 $40.62 $46.47 $27.61 $32.51 $39.95 $48.61 $56.03<br />
15-1041 Computer Support Specialists $15.86 $25.12 $29.74 $14.46 $18.03 $24.05 $30.38 $39.30<br />
15-1051 Computer Systems Analysts $25.37 $35.91 $41.18 $22.46 $28.72 $35.30 $42.52 $51.29<br />
15-1061 Database Administrators $21.05 $31.89 $37.31 $18.93 $24.02 $30.64 $40.31 $46.55<br />
15-1071 Network and Computer Systems Administrators $21.68 $32.70 $38.22 $19.65 $24.20 $31.22 $39.84 $47.47<br />
15-1081 Network Systems and Data Communications Analysts $22.28 $32.32 $37.34 $20.31 $24.86 $31.70 $39.80 $45.64<br />
15-1099 Computer Specialists, All Other $22.37 $33.27 $38.73 $20.49 $25.36 $32.07 $40.14 $47.77<br />
15-2011 Actuaries $25.37 $43.18 $52.08 $22.32 $29.56 $39.83 $51.73 $68.11<br />
15-2031 Operations Research Analysts $21.80 $30.93 $35.50 $19.75 $23.83 $28.60 $37.44 $45.79<br />
15-2041 Statisticians $21.82 $31.59 $36.47 $20.19 $23.73 $29.18 $35.37 $43.25<br />
* annual wage data<br />
† insufficient wage data
Denver Metro Region JVS —<strong>Spring</strong> <strong>2006</strong><br />
11<br />
Denver Metro Region Occupational Employment Statistics (OES) Wages (Nov. 2004 wages based on data released Nov. 2005) – 4<br />
SOC<br />
Code<br />
SOC Occupational Title<br />
Entry-<br />
Level<br />
Average Wages<br />
Overall<br />
Experienced<br />
Percentile Distribution<br />
10th 25th 50th 75th 90th<br />
17-1011 Architects, Except Landscape and Naval $18.87 $30.32 $36.05 $18.25 $20.66 $26.23 $36.93 $44.88<br />
17-1012 Landscape Architects $19.54 $28.28 $32.65 $18.46 $21.70 $27.18 $34.22 $40.71<br />
17-1021 Cartographers and Photogrammetrists $19.61 $28.28 $32.61 $18.14 $21.76 $28.11 $33.74 $40.53<br />
17-1022 <strong>Survey</strong>ors $15.28 $22.31 $25.83 $14.64 $16.18 $21.05 $26.95 $34.07<br />
17-2031 Biomedical Engineers $29.03 $35.76 $39.12 $27.56 $30.05 $34.08 $41.16 $49.46<br />
17-2041 Chemical Engineers $27.11 $38.68 $44.46 $24.39 $30.81 $38.56 $46.62 $54.42<br />
17-2051 Civil Engineers $22.96 $32.08 $36.64 $21.39 $24.83 $30.26 $37.69 $46.29<br />
17-2061 Computer Hardware Engineers $32.10 $48.22 $56.28 $29.86 $37.10 $48.39 $57.91 $67.95<br />
17-2071 Electrical Engineers $27.44 $38.07 $43.39 $25.08 $29.96 $37.17 $44.44 $53.21<br />
17-2072 Electronics Engineers, Except Computer $28.19 $39.41 $45.02 $25.99 $30.97 $37.58 $45.97 $57.62<br />
17-2081 Environmental Engineers $24.27 $35.69 $41.40 $22.32 $26.81 $36.48 $42.51 $49.69<br />
Health and Safety Engineers, Except Mining Safety<br />
17-2111<br />
Engineers and Inspectors<br />
$26.46 $36.57 $41.62 $24.01 $29.52 $36.51 $42.44 $51.14<br />
17-2112 Industrial Engineers $25.50 $35.81 $40.96 $23.32 $28.41 $34.68 $42.59 $51.56<br />
17-2131 Materials Engineers $25.49 $38.00 $44.26 $23.13 $28.55 $36.24 $46.30 $55.93<br />
17-2141 Mechanical Engineers $23.94 $34.58 $39.91 $22.92 $26.71 $33.56 $41.23 $48.29<br />
Mining and Geological Engineers, Including Mining Safety<br />
17-2151<br />
Engineers<br />
$24.60 $41.37 $49.75 $22.43 $27.19 $40.85 $50.89 $56.83<br />
17-2171 Petroleum Engineers $35.99 $49.04 $55.56 $34.98 $39.79 $47.48 $56.00 $68.25<br />
17-2199 Engineers, All Other $26.02 $40.42 $47.62 $23.45 $30.86 $39.53 $50.02 $59.29<br />
17-3011 Architectural and Civil Drafters $16.56 $22.85 $26.00 $15.31 $18.07 $22.79 $26.77 $31.62<br />
17-3012 Electrical and Electronics Drafters $16.74 $25.05 $29.21 $15.17 $18.63 $24.19 $30.28 $37.50<br />
17-3013 Mechanical Drafters $15.03 $21.40 $24.59 $14.35 $15.96 $18.91 $24.35 $35.44<br />
17-3019 Drafters, All Other $19.57 $27.39 $31.30 $18.31 $21.92 $27.34 $32.94 $39.04<br />
17-3022 Civil Engineering Technicians $13.59 $19.66 $22.69 $12.47 $15.05 $19.75 $23.74 $27.26<br />
17-3023 Electrical and Electronic Engineering Technicians $17.01 $24.20 $27.80 $15.15 $19.55 $24.08 $28.48 $33.95<br />
* annual wage data<br />
† insufficient wage data
Denver Metro Region JVS —<strong>Spring</strong> <strong>2006</strong><br />
12<br />
Denver Metro Region Occupational Employment Statistics (OES) Wages (Nov. 2004 wages based on data released Nov. 2005) – 5<br />
SOC<br />
Code<br />
SOC Occupational Title<br />
Entry-<br />
Level<br />
Average Wages<br />
Overall<br />
Experienced<br />
Percentile Distribution<br />
10th 25th 50th 75th 90th<br />
17-3024 Electro-Mechanical Technicians $17.08 $22.19 $24.74 $15.70 $18.47 $22.23 $26.08 $28.83<br />
17-3025 Environmental Engineering Technicians $17.83 $24.15 $27.31 $16.47 $19.30 $22.47 $28.50 $35.41<br />
17-3026 Industrial Engineering Technicians $16.44 $26.14 $30.99 $14.70 $18.49 $23.25 $32.66 $42.97<br />
17-3027 Mechanical Engineering Technicians $14.79 $22.96 $27.05 $12.26 $17.68 $23.86 $27.17 $31.84<br />
17-3029 Engineering Technicians, Except Drafters, All Other $20.04 $25.56 $28.31 $18.53 $22.17 $25.53 $29.52 $33.54<br />
17-3031 <strong>Survey</strong>ing and Mapping Technicians $14.95 $20.55 $23.35 $14.03 $16.67 $20.24 $23.74 $28.28<br />
19-1012 Food Scientists and Technologists $19.81 $31.60 $37.49 $17.51 $22.43 $30.20 $39.58 $47.86<br />
19-1013 Soil and Plant Scientists $16.20 $27.68 $33.41 $15.07 $17.74 $27.55 $36.40 $41.95<br />
19-1021 Biochemists and Biophysicists $21.99 $34.63 $40.95 $18.68 $26.58 $35.64 $42.40 $49.11<br />
19-1022 Microbiologists $18.89 $32.63 $39.51 $17.81 $20.86 $28.56 $41.10 $52.49<br />
19-1029 Biological Scientists, All Other $23.93 $34.74 $40.14 $21.24 $27.83 $36.43 $41.90 $47.99<br />
19-1031 Conservation Scientists $19.99 $30.43 $35.66 $18.11 $22.10 $30.17 $38.20 $42.15<br />
19-1032 Foresters $22.16 $33.97 $39.87 $20.52 $24.44 $33.63 $40.70 $47.64<br />
19-1042 Medical Scientists, Except Epidemiologists $19.96 $33.88 $40.84 $16.66 $23.50 $30.83 $40.66 $53.06<br />
19-2012 Physicists $22.24 $40.01 $48.90 $19.46 $25.83 $39.74 $52.19 $63.20<br />
19-2031 Chemists $20.07 $34.01 $40.98 $17.28 $23.43 $33.57 $43.29 $53.01<br />
19-2032 Materials Scientists $24.14 $40.32 $48.41 $20.74 $27.89 $43.15 $52.55 $59.84<br />
19-2041 Environmental Scientists and Specialists, Including Health $19.29 $32.12 $38.53 $16.73 $22.23 $31.31 $40.51 $49.51<br />
19-2042 Geoscientists, Except Hydrologists and Geographers $26.42 $43.03 $51.33 $22.97 $31.86 $42.58 $53.34 $64.17<br />
19-2043 Hydrologists $25.15 $36.65 $42.40 $22.78 $28.15 $35.10 $44.28 $54.55<br />
19-2099 Physical Scientists, All Other $21.36 $32.74 $38.43 $19.32 $24.12 $31.87 $40.37 $48.56<br />
19-3011 Economists $26.64 $41.40 $48.77 $22.66 $31.96 $38.27 $44.32 $61.72<br />
19-3021 Market Research Analysts $19.11 $33.19 $40.24 $17.55 $21.75 $32.52 $42.28 $51.62<br />
19-3022 <strong>Survey</strong> Researchers $9.56 $17.68 $21.75 $8.05 $11.57 $18.51 $21.50 $26.95<br />
19-3031 Clinical, Counseling, and School Psychologists $19.26 $31.54 $37.68 $17.02 $22.30 $29.76 $35.06 $45.00<br />
* annual wage data<br />
† insufficient wage data
Denver Metro Region JVS —<strong>Spring</strong> <strong>2006</strong><br />
13<br />
Denver Metro Region Occupational Employment Statistics (OES) Wages (Nov. 2004 wages based on data released Nov. 2005) – 6<br />
SOC<br />
Code<br />
SOC Occupational Title<br />
Entry-<br />
Level<br />
Average Wages<br />
Overall<br />
Experienced<br />
Percentile Distribution<br />
10th 25th 50th 75th 90th<br />
19-3039 Psychologists, All Other $13.12 $28.53 $36.24 $11.25 $13.86 $31.50 $38.65 $43.58<br />
19-3051 Urban and Regional Planners $21.46 $29.18 $33.04 $19.09 $23.77 $28.98 $34.61 $40.83<br />
19-3091 Anthropologists and Archeologists $14.86 $27.37 $33.63 $12.81 $17.17 $26.25 $36.82 $43.78<br />
19-3099 Social Scientists and Related Workers, All Other $20.37 $30.77 $35.96 $17.98 $23.17 $29.55 $38.07 $45.95<br />
19-4011 Agricultural and Food Science Technicians $12.96 $18.00 $20.52 $12.05 $14.14 $16.60 $20.18 $27.47<br />
19-4021 Biological Technicians $12.84 $18.88 $21.90 $12.12 $13.72 $17.38 $22.19 $28.74<br />
19-4031 Chemical Technicians $14.03 $20.02 $23.01 $12.68 $15.94 $19.27 $23.69 $28.49<br />
19-4041 Geological and Petroleum Technicians $19.74 $25.32 $28.12 $19.12 $21.62 $24.99 $29.59 $33.55<br />
Environmental Science and Protection Technicians,<br />
19-4091<br />
Including Health<br />
$14.20 $22.97 $27.36 $12.80 $16.02 $22.79 $28.48 $35.25<br />
19-4092 Forensic Science Technicians $17.24 $22.69 $25.42 $15.72 $18.91 $22.93 $26.38 $29.84<br />
19-4093 Forest and Conservation Technicians $14.01 $18.56 $20.84 $13.04 $14.76 $17.35 $20.85 $25.97<br />
19-4099 Life, Physical, and Social Science Technicians, All Other $12.14 $20.54 $24.75 $11.15 $13.74 $19.66 $25.52 $31.62<br />
21-1011 Substance Abuse and Behavioral Disorder Counselors $11.87 $16.24 $18.43 $11.26 $12.35 $14.18 $17.35 $28.37<br />
21-1012 Educational, Vocational, and School Counselors $14.96 $23.68 $28.04 $13.69 $16.80 $23.14 $30.46 $34.31<br />
21-1014 Mental Health Counselors $12.22 $17.89 $20.72 $11.70 $13.06 $15.87 $20.37 $25.71<br />
21-1015 Rehabilitation Counselors $11.09 $15.72 $18.04 $10.09 $11.83 $13.72 $17.43 $25.49<br />
21-1019 Counselors, All Other $11.58 $19.90 $24.06 $10.51 $12.99 $19.42 $27.43 $31.94<br />
21-1021 Child, Family, and School Social Workers $14.92 $21.67 $25.04 $14.31 $16.62 $20.87 $26.24 $31.85<br />
21-1022 Medical and Public Health Social Workers $13.36 $20.40 $23.92 $12.22 $14.79 $19.95 $25.20 $30.91<br />
21-1023 Mental Health and Substance Abuse Social Workers $10.49 $17.19 $20.55 $9.57 $11.52 $15.05 $20.85 $27.17<br />
21-1029 Social Workers, All Other $11.63 $17.17 $19.94 $11.06 $13.15 $16.05 $20.61 $25.56<br />
21-1091 Health Educators $12.50 $20.72 $24.83 $10.54 $14.60 $19.00 $26.41 $33.96<br />
21-1092 Probation Officers and Correctional Treatment Specialists $18.22 $25.24 $28.74 $17.08 $20.26 $25.57 $30.56 $33.53<br />
21-1093 Social and Human Service Assistants $9.75 $13.83 $15.87 $8.45 $11.35 $13.48 $16.40 $19.76<br />
* annual wage data<br />
† insufficient wage data
Denver Metro Region JVS —<strong>Spring</strong> <strong>2006</strong><br />
14<br />
Denver Metro Region Occupational Employment Statistics (OES) Wages (Nov. 2004 wages based on data released Nov. 2005) – 7<br />
SOC<br />
Code<br />
SOC Occupational Title<br />
Entry-<br />
Level<br />
Average Wages<br />
Overall<br />
Experienced<br />
Percentile Distribution<br />
10th 25th 50th 75th 90th<br />
21-1099 Community and Social Service Specialists, All Other $10.93 $17.27 $20.44 $9.69 $12.61 $16.28 $22.37 $26.17<br />
21-2011 Clergy $14.74 $20.50 $23.38 $13.09 $16.85 $19.66 $22.26 $28.08<br />
21-2021 Directors, Religious Activities and Education $11.60 $20.01 $24.21 $8.49 $14.82 $20.29 $25.49 $30.21<br />
23-1011 Lawyers $24.04 $45.22 $55.81 $21.91 $27.46 $39.35 $56.67 †<br />
Administrative Law Judges, Adjudicators, and Hearing<br />
23-1021<br />
Officers<br />
$29.30 $44.97 $52.81 $27.28 $32.78 $39.75 $48.34 †<br />
23-1022 Arbitrators, Mediators, and Conciliators $19.23 $39.31 $49.35 $16.42 $21.89 $35.71 $58.10 $67.69<br />
23-1023 Judges, Magistrate Judges, and Magistrates $35.14 $45.50 $50.67 $34.34 $38.98 $45.34 $52.79 $58.99<br />
23-2011 Paralegals and Legal Assistants $17.72 $22.07 $24.25 $16.48 $18.49 $20.93 $25.18 $29.94<br />
23-2092 Law Clerks $12.72 $19.09 $22.28 $11.89 $13.46 $17.98 $20.96 $28.58<br />
23-2099 Legal Support Workers, All Other $15.53 $20.98 $23.70 $14.67 $16.53 $19.63 $24.29 $30.25<br />
* 25-1011 Business Teachers, Postsecondary $30,911 $68,831 $87,791 $25,676 $37,285 $55,565 $97,347 $122,317<br />
* 25-1021 Computer Science Teachers, Postsecondary $30,947 $54,419 $66,155 $26,614 $35,973 $50,683 $67,880 $93,034<br />
* 25-1022 Mathematical Science Teachers, Postsecondary $30,282 $56,785 $70,036 $25,982 $35,623 $52,727 $72,947 $91,195<br />
* 25-1042 Biological Science Teachers, Postsecondary $37,727 $67,091 $81,773 $30,266 $45,078 $59,163 $85,413 $112,802<br />
Atmospheric, Earth, Marine, and Space Sciences Teachers,<br />
* 25-1051<br />
Postsecondary<br />
$46,232 $74,045 $87,952 $40,014 $56,000 $70,404 $90,558 $114,449<br />
* 25-1052 Chemistry Teachers, Postsecondary $44,622 $73,241 $87,551 $40,859 $52,219 $68,070 $90,070 $111,063<br />
* 25-1054 Physics Teachers, Postsecondary $52,728 $77,875 $90,449 $47,387 $61,138 $76,818 $94,068 $112,283<br />
* 25-1061 Anthropology and Archeology Teachers, Postsecondary $42,507 $58,472 $66,454 $33,266 $48,843 $56,091 $68,699 $85,513<br />
* 25-1063 Economics Teachers, Postsecondary $45,850 $74,917 $89,450 $41,385 $53,882 $74,004 $91,523 $111,182<br />
* 25-1065 Political Science Teachers, Postsecondary $43,713 $66,349 $77,667 $39,369 $48,740 $58,502 $81,545 $103,749<br />
* 25-1066 Psychology Teachers, Postsecondary $31,948 $57,785 $70,703 $28,584 $35,880 $52,242 $69,829 $97,272<br />
* 25-1067 Sociology Teachers, Postsecondary $39,445 $60,676 $71,291 $34,567 $45,551 $55,164 $69,434 $100,930<br />
* 25-1081 Education Teachers, Postsecondary $30,595 $53,541 $65,013 $27,435 $34,570 $51,308 $68,159 $85,962<br />
* 25-1121 Art, Drama, and Music Teachers, Postsecondary $37,107 $53,134 $61,147 $34,352 $42,040 $51,069 $61,273 $78,950<br />
* annual wage data<br />
† insufficient wage data
Denver Metro Region JVS —<strong>Spring</strong> <strong>2006</strong><br />
15<br />
Denver Metro Region Occupational Employment Statistics (OES) Wages (Nov. 2004 wages based on data released Nov. 2005) – 8<br />
SOC<br />
Code<br />
SOC Occupational Title<br />
Entry-<br />
Level<br />
Average Wages<br />
Overall<br />
Experienced<br />
Percentile Distribution<br />
10th 25th 50th 75th 90th<br />
* 25-1123 English Language and Literature Teachers, Postsecondary $31,465 $50,096 $59,412 $27,335 $35,966 $45,372 $61,617 $74,784<br />
* 25-1124 Foreign Language and Literature Teachers, Postsecondary $34,489 $53,006 $62,265 $31,408 $38,293 $51,301 $63,986 $77,494<br />
* 25-1125 History Teachers, Postsecondary $36,433 $60,208 $72,095 $28,792 $44,962 $55,837 $74,541 $96,135<br />
* 25-1126 Philosophy and Religion Teachers, Postsecondary $26,306 $50,788 $63,029 $22,567 $30,748 $47,752 $65,479 $88,643<br />
25-1194 Vocational Education Teachers, Postsecondary $12.62 $20.59 $24.58 $11.97 $13.76 $17.01 $25.37 $37.64<br />
* 25-1199 Postsecondary Teachers, All Other $25,323 $40,581 $48,210 $24,116 $25,761 $28,504 $46,354 $75,388<br />
25-2011 Preschool Teachers, Except Special Education $9.74 $12.09 $13.26 $9.23 $9.84 $10.85 $13.11 $17.10<br />
* 25-2012 Kindergarten Teachers, Except Special Education $30,391 $43,980 $50,774 $29,389 $33,812 $42,864 $54,053 $64,024<br />
* 25-2021 Elementary School Teachers, Except Special Education $31,491 $45,842 $53,018 $30,271 $34,680 $44,783 $56,543 $66,988<br />
Middle School Teachers, Except Special and Vocational<br />
* 25-2022<br />
Education<br />
$32,898 $46,295 $52,994 $31,131 $35,370 $45,168 $56,277 $66,563<br />
* 25-2023 Vocational Education Teachers, Middle School $36,274 $48,984 $55,339 $32,846 $40,441 $49,878 $57,227 $65,981<br />
Secondary School Teachers, Except Special and Vocational<br />
* 25-2031 $34,568 $48,551 $55,543 $31,935 $37,238 $48,189 $59,615 $68,714<br />
Education<br />
* 25-2032 Vocational Education Teachers, Secondary School $39,755 $52,551 $58,949 $37,318 $44,150 $52,517 $60,675 $70,089<br />
Special Education Teachers, Preschool, Kindergarten, and<br />
* 25-2041<br />
Elementary School<br />
$36,384 $50,360 $57,347 $33,301 $40,265 $50,593 $61,672 $69,303<br />
* 25-2042 Special Education Teachers, Middle School $34,623 $48,109 $54,852 $31,807 $37,297 $48,037 $58,267 $67,637<br />
* 25-2043 Special Education Teachers, Secondary School $33,321 $48,917 $56,716 $30,714 $36,325 $49,718 $61,584 $69,203<br />
Adult Literacy, Remedial Education, and GED Teachers and<br />
25-3011<br />
Instructors<br />
$11.09 $14.37 $16.01 $10.26 $11.70 $13.77 $16.19 $19.40<br />
25-3021 Self-Enrichment Education Teachers $9.90 $15.99 $19.04 $9.11 $11.27 $15.31 $19.63 $22.91<br />
25-3099 Teachers and Instructors, All Other $13.65 $20.59 $24.06 $12.37 $15.17 $19.50 $26.06 $31.57<br />
25-4012 Curators $17.85 $25.11 $28.74 $17.41 $19.90 $24.19 $29.14 $36.47<br />
25-4013 Museum Technicians and Conservators $13.11 $17.94 $20.36 $12.19 $14.14 $16.81 $20.65 $25.30<br />
25-4021 Librarians $19.94 $26.81 $30.25 $18.43 $21.97 $26.70 $32.07 $35.64<br />
25-4031 Library Technicians $11.34 $15.14 $17.05 $10.49 $12.16 $14.43 $18.17 $21.11<br />
* annual wage data<br />
† insufficient wage data
Denver Metro Region JVS —<strong>Spring</strong> <strong>2006</strong><br />
16<br />
Denver Metro Region Occupational Employment Statistics (OES) Wages (Nov. 2004 wages based on data released Nov. 2005) – 9<br />
SOC<br />
Code<br />
SOC Occupational Title<br />
Entry-<br />
Level<br />
Average Wages<br />
Overall<br />
Experienced<br />
Percentile Distribution<br />
10th 25th 50th 75th 90th<br />
25-9031 Instructional Coordinators $19.69 $27.82 $31.89 $16.32 $23.50 $29.60 $33.19 $35.70<br />
* 25-9041 Teacher Assistants $18,425 $23,505 $26,046 $17,041 $19,723 $23,354 $26,854 $29,928<br />
25-9099 Education, Training, and Library Workers, All Other $15.19 $22.94 $26.81 $14.24 $17.48 $21.30 $28.32 $35.03<br />
27-1011 Art Directors $22.21 $33.83 $39.65 $20.20 $24.61 $30.97 $39.39 $51.91<br />
27-1013 Fine Artists, Including Painters, Sculptors, and Illustrators $9.25 $15.05 $17.95 $8.01 $10.84 $12.72 $17.79 $27.63<br />
27-1014 Multi-Media Artists and Animators $17.52 $25.90 $30.09 $16.13 $19.69 $25.22 $32.23 $38.49<br />
27-1021 Commercial and Industrial Designers $17.44 $24.52 $28.06 $15.79 $19.22 $22.80 $27.82 $38.00<br />
27-1023 Floral Designers $7.65 $11.62 $13.60 $6.16 $9.31 $11.83 $14.53 $16.48<br />
27-1024 Graphic Designers $13.45 $19.64 $22.73 $12.16 $14.67 $17.76 $23.07 $29.73<br />
27-1025 Interior Designers $14.94 $26.16 $31.76 $14.14 $17.21 $20.36 $25.12 $44.77<br />
27-1026 Merchandise Displayers and Window Trimmers $8.86 $10.94 $11.98 $8.23 $9.12 $10.18 $11.86 $14.44<br />
27-1027 Set and Exhibit Designers $15.10 $20.33 $22.94 $14.47 $15.63 $17.50 $24.26 $33.08<br />
27-1029 Designers, All Other $14.84 $24.66 $29.57 $11.92 $18.79 $24.58 $31.33 $35.97<br />
27-2012 Producers and Directors $15.90 $30.29 $37.49 $12.72 $19.94 $25.78 $35.46 $54.13<br />
* 27-2021 Athletes and Sports Competitors † $172,029 † $47,221 † † † †<br />
* 27-2022 Coaches and Scouts $18,196 $37,321 $46,884 $14,812 $21,881 $31,057 $41,234 $59,237<br />
* 27-2023 Umpires, Referees, and Other Sports Officials $12,497 $20,200 $24,051 $11,992 $13,635 $18,267 $21,880 $33,738<br />
27-2041 Music Directors and Composers $12.07 $20.57 $24.82 $8.20 $15.27 $18.98 $24.23 $31.02<br />
27-3011 Radio and Television Announcers $9.36 $22.06 $28.42 $8.24 $10.87 $16.05 $26.50 $45.20<br />
27-3012 Public Address System and Other Announcers $7.21 $13.12 $16.08 $6.61 $8.27 $12.38 $16.20 $23.59<br />
27-3022 Reporters and Correspondents $11.22 $29.85 $39.17 $10.36 $13.08 $23.80 $34.60 †<br />
27-3031 Public Relations Specialists $14.95 $25.72 $31.10 $14.05 $16.53 $23.28 $31.59 $41.10<br />
27-3041 Editors $17.00 $23.82 $27.23 $15.52 $18.91 $23.35 $26.89 $33.87<br />
27-3042 Technical Writers $22.28 $30.32 $34.35 $20.47 $24.09 $28.80 $37.38 $42.97<br />
27-3043 Writers and Authors $13.77 $23.03 $27.66 $12.73 $16.15 $22.56 $27.98 $34.52<br />
* annual wage data<br />
† insufficient wage data
Denver Metro Region JVS —<strong>Spring</strong> <strong>2006</strong><br />
17<br />
Denver Metro Region Occupational Employment Statistics (OES) Wages (Nov. 2004 wages based on data released Nov. 2005)–10<br />
SOC<br />
Code<br />
SOC Occupational Title<br />
Entry-<br />
Level<br />
Average Wages<br />
Overall<br />
Experienced<br />
Percentile Distribution<br />
10th 25th 50th 75th 90th<br />
27-3091 Interpreters and Translators $18.67 $29.82 $35.40 $17.04 $21.01 $29.07 $34.59 $50.50<br />
27-3099 Media and Communication Workers, All Other $14.77 $25.93 $31.51 $11.89 $18.22 $26.07 $33.11 $40.63<br />
27-4011 Audio and Video Equipment Technicians $12.18 $18.71 $21.98 $11.13 $13.92 $17.07 $23.26 $28.87<br />
27-4012 Broadcast Technicians $11.10 $18.11 $21.62 $8.57 $14.36 $17.29 $23.14 $27.57<br />
27-4014 Sound Engineering Technicians $12.53 $19.41 $22.86 $10.47 $14.45 $18.80 $23.10 $30.74<br />
27-4021 Photographers $10.65 $22.23 $28.01 $8.12 $14.08 $20.34 $26.83 $36.10<br />
27-4031 Camera Operators, Television, Video, and Motion Picture $11.59 $18.92 $22.59 $10.04 $14.27 $19.11 $24.80 $27.19<br />
27-4032 Film and Video Editors $15.98 $33.33 $42.01 $13.34 $19.13 $29.57 $50.65 $55.20<br />
27-4099 Media and Communication Equipment Workers, All Other $12.74 $18.54 $21.45 $12.27 $13.55 $16.09 $20.25 $31.23<br />
29-1011 Chiropractors $19.85 $31.32 $37.05 $18.74 $20.02 $22.15 $38.56 $56.93<br />
29-1021 Dentists, General $35.48 $74.23 $93.60 $32.92 $40.10 † † †<br />
29-1031 Dietitians and Nutritionists $12.31 $18.90 $22.20 $11.36 $13.48 $18.65 $23.50 $27.18<br />
29-1041 Optometrists $28.72 $49.89 $60.47 $22.13 $37.53 $49.23 $62.41 †<br />
29-1051 Pharmacists $36.95 $42.59 $45.41 $36.26 $38.68 $42.57 $47.61 $53.24<br />
29-1063 Internists, General $60.00 $81.40 $92.10 $58.98 $65.55 † † †<br />
29-1064 Obstetricians and Gynecologists $58.59 $79.40 $89.81 $54.33 $63.52 † † †<br />
29-1067 Surgeons † $92.58 † † † † † †<br />
29-1069 Physicians and Surgeons, All Other $42.85 $76.98 $94.05 $38.83 $53.36 † † †<br />
29-1071 Physician Assistants $22.25 $31.29 $35.81 $18.75 $27.71 $32.60 $37.65 $42.35<br />
29-1111 Registered Nurses $22.14 $28.03 $30.97 $20.23 $23.93 $28.12 $32.38 $35.40<br />
29-1121 Audiologists $20.80 $26.44 $29.25 $18.62 $22.72 $26.25 $31.22 $34.81<br />
29-1122 Occupational Therapists $18.29 $23.70 $26.40 $17.57 $19.78 $23.00 $27.41 $32.35<br />
29-1123 Physical Therapists $20.62 $26.20 $28.99 $19.28 $22.09 $26.00 $30.47 $33.86<br />
29-1124 Radiation Therapists $25.41 $31.74 $34.91 $23.88 $28.28 $32.22 $36.73 $41.50<br />
29-1125 Recreational Therapists $12.63 $18.48 $21.40 $11.59 $14.07 $18.79 $22.54 $26.08<br />
* annual wage data<br />
† insufficient wage data
Denver Metro Region JVS —<strong>Spring</strong> <strong>2006</strong><br />
18<br />
Denver Metro Region Occupational Employment Statistics (OES) Wages (Nov. 2004 wages based on data released Nov. 2005)–11<br />
SOC<br />
Code<br />
SOC Occupational Title<br />
Entry-<br />
Level<br />
Average Wages<br />
Overall<br />
Experienced<br />
Percentile Distribution<br />
10th 25th 50th 75th 90th<br />
29-1126 Respiratory Therapists $18.68 $21.93 $23.55 $17.84 $19.31 $21.69 $24.90 $27.03<br />
29-1127 Speech-Language Pathologists $20.21 $26.88 $30.21 $18.76 $22.10 $26.81 $32.05 $35.47<br />
29-1129 Therapists, All Other $14.35 $19.04 $21.39 $13.65 $14.65 $16.25 $20.42 $31.89<br />
29-1131 Veterinarians $19.56 $30.15 $35.45 $15.97 $22.36 $25.54 $33.51 $46.65<br />
29-1199 Health Diagnosing and Treating Practitioners, All Other $22.03 $58.69 $77.03 $19.82 $25.23 $40.67 † †<br />
29-2011 Medical and Clinical Laboratory Technologists $17.14 $22.98 $25.90 $15.85 $19.47 $23.53 $26.58 $30.06<br />
29-2012 Medical and Clinical Laboratory Technicians $11.94 $16.37 $18.58 $11.22 $13.07 $15.75 $19.34 $23.00<br />
29-2021 Dental Hygienists $28.50 $36.25 $40.12 $26.03 $32.07 $38.44 $42.12 $44.33<br />
29-2031 Cardiovascular Technologists and Technicians $13.28 $20.86 $24.65 $12.10 $14.57 $19.86 $26.89 $32.22<br />
29-2032 Diagnostic Medical Sonographers $13.72 $26.09 $32.28 $12.57 $15.17 $27.22 $34.89 $41.50<br />
29-2033 Nuclear Medicine Technologists $23.09 $27.81 $30.16 $21.78 $24.46 $28.24 $31.90 $34.20<br />
29-2034 Radiologic Technologists and Technicians $17.89 $23.13 $25.75 $16.64 $19.42 $22.78 $26.64 $31.25<br />
29-2041 Emergency Medical Technicians and Paramedics $11.20 $16.96 $19.84 $10.27 $12.72 $16.50 $20.76 $24.74<br />
29-2051 Dietetic Technicians $6.88 $10.79 $12.74 $6.42 $7.73 $10.78 $13.23 $15.70<br />
29-2052 Pharmacy Technicians $11.22 $14.26 $15.78 $10.48 $12.06 $14.31 $16.31 $17.89<br />
29-2053 Psychiatric Technicians $12.24 $14.75 $16.01 $11.72 $12.85 $14.55 $16.48 $18.78<br />
29-2054 Respiratory Therapy Technicians $12.10 $16.57 $18.80 $11.33 $13.24 $16.65 $19.75 $21.86<br />
29-2055 Surgical Technologists $12.20 $17.26 $19.80 $11.68 $13.79 $17.62 $20.38 $23.34<br />
29-2056 Veterinary Technologists and Technicians $9.70 $11.90 $13.01 $9.23 $10.06 $11.46 $13.54 $15.72<br />
29-2061 Licensed Practical and Licensed Vocational Nurses $14.97 $19.07 $21.12 $14.02 $16.57 $19.24 $21.49 $24.86<br />
29-2071 Medical Records and Health In<strong>for</strong>mation Technicians $11.50 $15.90 $18.10 $10.68 $12.34 $14.87 $19.04 $22.30<br />
29-2081 Opticians, Dispensing $13.07 $17.08 $19.09 $11.99 $14.29 $16.38 $19.20 $21.87<br />
29-2099 Health Technologists and Technicians, All Other $12.21 $17.25 $19.78 $11.66 $13.23 $16.43 $20.36 $23.85<br />
29-9011 Occupational Health and Safety Specialists $22.31 $31.48 $36.06 $20.75 $25.53 $31.48 $37.55 $43.55<br />
29-9012 Occupational Health and Safety Technicians $17.34 $25.37 $29.38 $16.03 $19.25 $24.64 $29.13 $38.72<br />
* annual wage data<br />
† insufficient wage data
Denver Metro Region JVS —<strong>Spring</strong> <strong>2006</strong><br />
19<br />
Denver Metro Region Occupational Employment Statistics (OES) Wages (Nov. 2004 wages based on data released Nov. 2005)–12<br />
SOC<br />
Code<br />
SOC Occupational Title<br />
Entry-<br />
Level<br />
Average Wages<br />
Overall<br />
Experienced<br />
Percentile Distribution<br />
10th 25th 50th 75th 90th<br />
* 29-9091 Athletic Trainers $30,275 $52,939 $64,272 $26,324 $35,406 $45,497 $58,481 $95,839<br />
29-9099 Healthcare Practitioners and Technical Workers, All Other $12.85 $21.97 $26.53 $11.22 $15.22 $19.96 $28.28 $35.34<br />
31-1011 <strong>Home</strong> Health Aides $7.50 $10.01 $11.26 $6.43 $8.66 $9.92 $11.17 $13.50<br />
31-1012 Nursing Aides, Orderlies, and Attendants $9.79 $12.31 $13.57 $9.29 $10.56 $12.20 $13.93 $16.12<br />
31-2011 Occupational Therapist Assistants $13.98 $17.51 $19.28 $12.97 $14.91 $17.40 $20.02 $21.64<br />
31-2021 Physical Therapist Assistants $14.46 $16.83 $18.01 $13.73 $14.70 $16.29 $18.92 $21.02<br />
31-2022 Physical Therapist Aides $8.29 $11.73 $13.45 $6.64 $9.75 $11.92 $13.62 $16.21<br />
31-9011 Massage Therapists $10.42 $19.38 $23.86 $9.26 $12.13 $19.08 $26.33 $31.96<br />
31-9091 Dental Assistants $14.13 $18.32 $20.41 $12.97 $15.80 $18.83 $20.87 $22.41<br />
31-9092 Medical Assistants $11.34 $14.38 $15.90 $10.54 $12.09 $14.30 $16.43 $18.78<br />
31-9093 Medical Equipment Preparers $9.58 $12.68 $14.23 $9.19 $10.36 $12.28 $14.44 $16.96<br />
31-9094 Medical Transcriptionists $13.54 $17.47 $19.43 $12.47 $14.66 $16.70 $20.51 $24.87<br />
31-9095 Pharmacy Aides $9.83 $12.73 $14.18 $9.36 $10.29 $12.63 $15.33 $16.68<br />
31-9099 Healthcare Support Workers, All Other $11.07 $14.08 $15.58 $10.24 $11.66 $13.44 $16.09 $19.04<br />
33-1012 First-Line Supervisors/Managers of Police and Detectives $30.57 $37.48 $40.94 $29.35 $32.21 $37.27 $42.61 $48.13<br />
First-Line Supervisors/Managers of Fire Fighting and<br />
33-1021<br />
Prevention Workers<br />
$28.37 $32.92 $35.20 $26.14 $29.78 $32.74 $35.75 $41.95<br />
First-Line Supervisors/Managers, Protective Service<br />
33-1099<br />
Workers, All Other<br />
$15.39 $24.23 $28.65 $14.74 $16.19 $21.00 $31.21 $39.02<br />
33-2011 Fire Fighters $16.86 $23.76 $27.20 $15.31 $18.66 $24.21 $28.89 $32.93<br />
33-2021 Fire Inspectors and Investigators $26.99 $29.97 $31.46 $24.33 $29.15 $31.29 $33.44 $34.75<br />
33-3011 Bailiffs $11.78 $17.15 $19.84 $11.17 $12.90 $16.74 $20.64 $24.50<br />
33-3012 Correctional Officers and Jailers $14.57 $19.65 $22.19 $13.93 $15.85 $19.58 $23.71 $26.26<br />
33-3021 Detectives and Criminal Investigators $26.66 $31.40 $33.77 $23.76 $28.96 $31.93 $34.86 $39.59<br />
33-3051 Police and Sheriff's Patrol Officers $20.95 $26.29 $28.95 $19.41 $22.33 $26.35 $30.86 $33.92<br />
33-9011 Animal Control Workers $14.59 $17.19 $18.50 $13.98 $15.19 $17.07 $19.71 $21.40<br />
* annual wage data<br />
† insufficient wage data
Denver Metro Region JVS —<strong>Spring</strong> <strong>2006</strong><br />
20<br />
Denver Metro Region Occupational Employment Statistics (OES) Wages (Nov. 2004 wages based on data released Nov. 2005)–13<br />
SOC<br />
Code<br />
SOC Occupational Title<br />
Entry-<br />
Level<br />
Average Wages<br />
Overall<br />
Experienced<br />
Percentile Distribution<br />
10th 25th 50th 75th 90th<br />
33-9021 Private Detectives and Investigators $10.93 $18.99 $23.01 $10.23 $12.16 $17.75 $24.74 $32.31<br />
33-9032 Security Guards $8.26 $12.39 $14.45 $7.25 $9.38 $11.39 $14.51 $18.94<br />
33-9091 Crossing Guards $7.75 $12.21 $14.44 $6.55 $8.94 $10.90 $15.96 $17.46<br />
Lifeguards, Ski Patrol, and Other Recreational Protective<br />
33-9092<br />
Service Workers<br />
$7.46 $9.19 $10.05 $7.19 $7.92 $9.12 $10.29 $11.10<br />
33-9099 Protective Service Workers, All Other $11.36 $15.89 $18.15 $10.88 $12.38 $14.70 $16.83 $22.69<br />
35-1011 Chefs and Head Cooks $11.29 $18.73 $22.45 $10.21 $12.66 $18.70 $21.89 $27.15<br />
First-Line Supervisors/Managers of Food Preparation and<br />
35-1012<br />
Serving Workers<br />
$9.91 $14.53 $16.83 $9.21 $10.80 $13.55 $17.63 $21.10<br />
35-2011 Cooks, Fast Food $6.97 $8.44 $9.18 $6.57 $7.35 $8.47 $9.77 $10.54<br />
35-2012 Cooks, Institution and Cafeteria $7.15 $10.91 $12.79 $6.42 $8.13 $10.77 $13.27 $16.06<br />
35-2014 Cooks, Restaurant $8.37 $10.53 $11.61 $7.63 $8.96 $10.20 $12.10 $13.96<br />
35-2015 Cooks, Short Order $8.48 $10.29 $11.20 $7.30 $9.38 $10.48 $11.46 $12.99<br />
35-2019 Cooks, All Other $14.63 $15.45 $15.85 $13.76 $14.39 $15.45 $16.51 $17.29<br />
35-2021 Food Preparation Workers $7.27 $9.79 $11.04 $7.02 $7.91 $9.49 $11.68 $13.33<br />
35-3011 Bartenders $5.94 $8.08 $9.15 $5.63 $6.14 $7.07 $9.41 $12.40<br />
Combined Food Preparation and Serving Workers,<br />
35-3021<br />
Including Fast Food<br />
$6.84 $8.21 $8.90 $6.31 $7.21 $7.98 $8.98 $10.60<br />
Counter Attendants, Cafeteria, Food Concession, and<br />
35-3022<br />
Coffee Shop<br />
$6.61 $8.28 $9.12 $6.08 $7.06 $7.96 $9.26 $10.81<br />
35-3031 Waiters and Waitresses $5.92 $8.45 $9.72 $5.62 $6.15 $7.50 $10.79 $12.79<br />
35-3041 Food Servers, Nonrestaurant $7.24 $9.73 $10.97 $6.99 $7.89 $9.58 $11.59 $13.24<br />
Dining Room and Cafeteria Attendants and Bartender<br />
35-9011<br />
Helpers<br />
$5.90 $7.35 $8.08 $5.59 $6.10 $6.98 $8.22 $10.14<br />
35-9021 Dishwashers $6.89 $8.07 $8.66 $6.39 $7.22 $8.03 $9.07 $10.26<br />
35-9031<br />
Hosts and Hostesses, Restaurant, Lounge, and Coffee<br />
Shop<br />
* annual wage data<br />
† insufficient wage data<br />
$6.27 $8.23 $9.21 $5.87 $6.80 $7.95 $9.48 $10.83
Denver Metro Region JVS —<strong>Spring</strong> <strong>2006</strong><br />
21<br />
Denver Metro Region Occupational Employment Statistics (OES) Wages (Nov. 2004 wages based on data released Nov. 2005)–14<br />
SOC<br />
Code<br />
SOC Occupational Title<br />
Entry-<br />
Level<br />
Average Wages<br />
Overall<br />
Experienced<br />
Percentile Distribution<br />
10th 25th 50th 75th 90th<br />
35-9099 Food Preparation and Serving Related Workers, All Other $7.89 $9.56 $10.39 $7.43 $8.56 $9.64 $10.62 $11.83<br />
First-Line Supervisors/Managers of Housekeeping and<br />
37-1011<br />
Janitorial Workers<br />
$10.40 $14.66 $16.80 $9.62 $11.09 $13.58 $17.20 $21.29<br />
First-Line Supervisors/Managers of Landscaping, Lawn<br />
37-1012<br />
Service, and Groundskeeping Workers<br />
$15.52 $21.89 $25.07 $13.44 $18.20 $22.22 $25.82 $29.00<br />
Janitors and Cleaners, Except Maids and Housekeeping<br />
37-2011<br />
Cleaners<br />
$7.52 $10.05 $11.32 $7.26 $8.03 $9.43 $11.44 $14.11<br />
37-2012 Maids and Housekeeping Cleaners $7.39 $9.05 $9.89 $7.06 $7.62 $8.54 $10.31 $12.07<br />
37-2021 Pest Control Workers $8.89 $16.89 $20.88 $8.00 $9.86 $14.75 $23.84 $26.83<br />
37-3011 Landscaping and Groundskeeping Workers $8.56 $11.58 $13.08 $7.84 $9.13 $10.45 $13.82 $16.98<br />
37-3012 Pesticide Handlers, Sprayers, and Applicators, Vegetation $10.42 $13.51 $15.06 $9.58 $11.06 $12.79 $15.84 $19.29<br />
37-3013 Tree Trimmers and Pruners $12.07 $15.60 $17.37 $11.63 $13.00 $15.49 $18.38 $20.66<br />
First-Line Supervisors/Managers of Personal Service<br />
39-1021<br />
Workers<br />
$11.41 $17.66 $20.78 $10.80 $12.81 $16.03 $22.70 $26.77<br />
39-2011 Animal Trainers $7.73 $10.49 $11.87 $7.44 $8.25 $9.81 $11.89 $15.38<br />
39-2021 Nonfarm Animal Caretakers $7.39 $10.68 $12.33 $7.13 $7.92 $9.65 $12.30 $17.85<br />
39-3021 Motion Picture Projectionists $7.41 $10.38 $11.86 $7.12 $7.71 $8.65 $10.66 $13.53<br />
39-3031 Ushers, Lobby Attendants, and Ticket Takers $5.96 $7.23 $7.87 $5.75 $6.45 $7.31 $8.10 $8.58<br />
39-3091 Amusement and Recreation Attendants $6.68 $8.70 $9.71 $6.15 $7.18 $8.41 $10.15 $11.79<br />
39-3093 Locker Room, Coatroom, and Dressing Room Attendants $6.65 $9.22 $10.50 $6.18 $7.20 $9.13 $10.75 $12.92<br />
39-3099 Entertainment Attendants and Related Workers, All Other $8.79 $10.38 $11.17 $8.06 $9.12 $10.28 $11.75 $13.07<br />
39-5011 Barbers $10.13 $10.63 $10.88 $9.34 $9.79 $10.55 $11.29 $12.66<br />
39-5012 Hairdressers, Hairstylists, and Cosmetologists $9.16 $13.68 $15.94 $8.80 $9.70 $11.64 $16.46 $22.25<br />
39-5092 Manicurists and Pedicurists $7.58 $10.29 $11.64 $7.25 $7.88 $9.14 $11.12 $15.17<br />
39-5094 Skin Care Specialists $7.40 $13.81 $17.01 $6.98 $8.24 $11.44 $14.19 $27.87<br />
39-6011 Baggage Porters and Bellhops $6.25 $12.81 $16.08 $5.88 $6.79 $11.80 $19.12 $20.78<br />
39-6021 Tour Guides and Escorts $7.66 $9.50 $10.41 $7.26 $7.80 $8.71 $10.80 $13.25<br />
* annual wage data<br />
† insufficient wage data
Denver Metro Region JVS —<strong>Spring</strong> <strong>2006</strong><br />
22<br />
Denver Metro Region Occupational Employment Statistics (OES) Wages (Nov. 2004 wages based on data released Nov. 2005)–15<br />
SOC<br />
Code<br />
SOC Occupational Title<br />
Entry-<br />
Level<br />
Average Wages<br />
Overall<br />
Experienced<br />
Percentile Distribution<br />
10th 25th 50th 75th 90th<br />
Transportation Attendants, Except Flight Attendants and<br />
39-6032<br />
Baggage Porters<br />
$9.26 $10.49 $11.11 $8.78 $9.36 $10.29 $11.55 $13.05<br />
39-9011 Child Care Workers $7.18 $9.60 $10.81 $6.85 $7.72 $9.10 $10.91 $13.09<br />
39-9021 Personal and <strong>Home</strong> Care Aides $7.53 $9.20 $10.04 $7.21 $7.88 $9.10 $10.36 $11.41<br />
39-9031 Fitness Trainers and Aerobics Instructors $9.27 $16.88 $20.69 $8.11 $10.51 $16.29 $21.45 $26.56<br />
39-9032 Recreation Workers $9.06 $13.33 $15.47 $8.38 $9.87 $12.03 $15.65 $21.48<br />
39-9041 Residential Advisors $5.96 $10.42 $12.66 $5.73 $6.37 $10.28 $13.99 $16.56<br />
39-9099 Personal Care and Service Workers, All Other $6.74 $10.31 $12.10 $6.13 $7.71 $10.77 $12.59 $13.62<br />
41-1011 First-Line Supervisors/Managers of Retail Sales Workers $12.56 $19.49 $22.95 $11.72 $13.71 $17.44 $21.93 $27.61<br />
First-Line Supervisors/Managers of Non-Retail Sales<br />
41-1012<br />
Workers<br />
$22.31 $36.98 $44.31 $20.14 $25.74 $34.76 $45.32 $56.17<br />
41-2011 Cashiers $7.31 $10.00 $11.35 $7.05 $7.85 $9.30 $11.24 $15.21<br />
41-2021 Counter and Rental Clerks $6.93 $10.74 $12.64 $6.44 $7.80 $9.96 $12.59 $16.30<br />
41-2022 Parts Salespersons $11.01 $16.68 $19.52 $10.11 $12.13 $15.63 $20.15 $25.60<br />
41-2031 Retail Salespersons $7.24 $11.92 $14.26 $6.98 $7.96 $9.89 $13.76 $19.40<br />
41-3011 Advertising Sales Agents $13.61 $26.38 $32.77 $12.92 $15.53 $21.49 $35.34 $44.25<br />
41-3021 Insurance Sales Agents $12.53 $29.03 $37.27 $10.16 $15.31 $22.67 $39.83 $51.29<br />
Securities, Commodities, and Financial Services Sales<br />
41-3031<br />
Agents<br />
$17.86 $43.79 $56.76 $17.26 $20.15 $35.21 $59.94 †<br />
41-3041 Travel Agents $9.12 $13.87 $16.24 $8.12 $10.65 $14.02 $16.31 $19.28<br />
41-3099 Sales Representatives, Services, All Other $15.92 $27.34 $33.04 $14.32 $18.43 $24.27 $33.58 $42.86<br />
Sales Representatives, Wholesale and Manufacturing,<br />
41-4011<br />
Technical and Scientific Products<br />
$15.64 $34.65 $44.15 $14.06 $18.48 $28.55 $46.43 $64.00<br />
Sales Representatives, Wholesale and Manufacturing,<br />
41-4012<br />
Except Technical and Scientific Produc<br />
$14.80 $27.11 $33.27 $13.01 $17.85 $23.89 $32.16 $44.88<br />
41-9011 Demonstrators and Product Promoters $7.72 $12.07 $14.24 $7.40 $8.09 $10.28 $12.93 $23.06<br />
41-9021 Real Estate Brokers $12.65 $33.80 $44.37 $9.92 $15.77 $28.69 $48.50 $65.81<br />
* annual wage data<br />
† insufficient wage data
Denver Metro Region JVS —<strong>Spring</strong> <strong>2006</strong><br />
23<br />
Denver Metro Region Occupational Employment Statistics (OES) Wages (Nov. 2004 wages based on data released Nov. 2005)–16<br />
SOC<br />
Code<br />
SOC Occupational Title<br />
Entry-<br />
Level<br />
Average Wages<br />
Overall<br />
Experienced<br />
Percentile Distribution<br />
10th 25th 50th 75th 90th<br />
41-9022 Real Estate Sales Agents $10.91 $24.05 $30.62 $10.14 $12.26 $17.40 $31.34 $48.88<br />
41-9031 Sales Engineers $26.82 $40.42 $47.22 $24.45 $29.59 $34.45 $43.89 $67.40<br />
41-9041 Telemarketers $8.16 $12.42 $14.55 $7.44 $8.89 $10.28 $13.33 $20.65<br />
41-9099 Sales and Related Workers, All Other $8.90 $19.75 $25.18 $7.10 $11.15 $17.02 $25.08 $32.00<br />
First-Line Supervisors/Managers of Office and<br />
43-1011<br />
Administrative Support Workers<br />
$16.50 $23.82 $27.48 $15.00 $18.43 $22.78 $27.95 $34.16<br />
43-2011 Switchboard Operators, Including Answering Service $9.03 $11.74 $13.09 $8.68 $9.74 $11.42 $13.41 $15.95<br />
43-3011 Bill and Account Collectors $10.95 $14.83 $16.78 $9.93 $12.03 $14.43 $17.06 $20.70<br />
43-3021 Billing and Posting Clerks and Machine Operators $11.47 $14.79 $16.45 $11.16 $12.48 $14.60 $16.82 $19.69<br />
43-3031 Bookkeeping, Accounting, and Auditing Clerks $11.47 $16.13 $18.46 $10.84 $13.17 $15.95 $19.19 $22.05<br />
43-3051 Payroll and Timekeeping Clerks $13.63 $17.46 $19.37 $12.59 $14.91 $17.21 $20.27 $23.36<br />
43-3061 Procurement Clerks $12.61 $17.04 $19.25 $11.78 $14.33 $17.14 $20.23 $22.36<br />
43-3071 Tellers $10.19 $12.18 $13.18 $9.65 $10.71 $12.03 $13.52 $15.48<br />
43-4011 Brokerage Clerks $12.55 $16.45 $18.40 $12.04 $13.37 $16.11 $18.99 $21.37<br />
43-4021 Correspondence Clerks $11.28 $16.54 $19.17 $10.35 $12.39 $17.81 $20.81 $22.35<br />
43-4031 Court, Municipal, and License Clerks $13.52 $17.15 $18.97 $12.42 $14.43 $16.97 $19.84 $22.14<br />
43-4041 Credit Authorizers, Checkers, and Clerks $12.04 $15.04 $16.54 $11.65 $12.58 $14.00 $16.91 $21.05<br />
43-4051 Customer Service Representatives $10.41 $14.68 $16.81 $9.50 $11.48 $13.74 $17.12 $21.32<br />
43-4061 Eligibility Interviewers, Government Programs $14.37 $17.05 $18.39 $13.18 $14.97 $16.91 $19.46 $21.45<br />
43-4071 File Clerks $8.64 $11.90 $13.53 $7.84 $9.55 $11.54 $13.71 $16.87<br />
43-4081 Hotel, Motel, and Resort Desk Clerks $8.39 $9.86 $10.59 $7.65 $8.93 $9.84 $10.74 $12.25<br />
43-4111 Interviewers, Except Eligibility and Loan $9.83 $13.56 $15.43 $8.71 $11.07 $13.11 $16.09 $18.86<br />
43-4121 Library Assistants, Clerical $8.23 $11.55 $13.21 $7.60 $8.97 $11.28 $13.64 $16.55<br />
43-4131 Loan Interviewers and Clerks $12.81 $17.01 $19.11 $11.94 $14.23 $16.81 $20.11 $22.52<br />
43-4141 New Accounts Clerks $11.73 $13.97 $15.09 $11.18 $12.22 $13.78 $15.89 $17.29<br />
* annual wage data<br />
† insufficient wage data
Denver Metro Region JVS —<strong>Spring</strong> <strong>2006</strong><br />
24<br />
Denver Metro Region Occupational Employment Statistics (OES) Wages (Nov. 2004 wages based on data released Nov. 2005)–17<br />
SOC<br />
Code<br />
SOC Occupational Title<br />
Entry-<br />
Level<br />
Average Wages<br />
Overall<br />
Experienced<br />
Percentile Distribution<br />
10th 25th 50th 75th 90th<br />
43-4151 Order Clerks $9.89 $14.51 $16.82 $8.79 $11.14 $13.97 $17.59 $21.17<br />
Human Resources Assistants, Except Payroll and<br />
43-4161<br />
Timekeeping<br />
$14.10 $17.61 $19.37 $13.10 $14.97 $17.28 $20.26 $22.75<br />
43-4171 Receptionists and In<strong>for</strong>mation Clerks $9.13 $12.75 $14.56 $8.46 $10.37 $12.62 $15.13 $17.22<br />
Reservation and Transportation Ticket Agents and Travel<br />
43-4181<br />
Clerks<br />
$10.82 $15.77 $18.25 $9.94 $11.59 $14.10 $20.24 $23.56<br />
43-4199 In<strong>for</strong>mation and Record Clerks, All Other $13.23 $21.04 $24.95 $12.03 $14.61 $18.31 $25.25 $35.00<br />
43-5011 Cargo and Freight Agents $9.70 $15.31 $18.11 $9.23 $10.16 $14.17 $18.14 $23.88<br />
43-5021 Couriers and Messengers $7.12 $11.55 $13.77 $6.19 $8.36 $11.65 $14.49 $16.62<br />
43-5031 Police, Fire, and Ambulance Dispatchers $14.06 $17.79 $19.65 $13.31 $15.18 $17.70 $20.52 $22.65<br />
43-5032 Dispatchers, Except Police, Fire, and Ambulance $11.83 $17.50 $20.34 $11.07 $13.29 $17.27 $21.49 $25.21<br />
43-5041 Meter Readers, Utilities $10.11 $14.98 $17.42 $9.45 $11.24 $14.99 $18.67 $21.31<br />
43-5051 Postal Service Clerks $19.20 $22.58 $24.27 $18.18 $20.95 $23.26 $25.25 $26.45<br />
43-5052 Postal Service Mail Carriers $18.09 $21.58 $23.33 $17.34 $19.10 $21.99 $24.62 $26.20<br />
Postal Service Mail Sorters, Processors, and Processing<br />
43-5053<br />
Machine Operators<br />
$14.34 $19.31 $21.80 $12.00 $17.24 $19.91 $23.15 $25.61<br />
43-5061 Production, Planning, and Expediting Clerks $14.36 $19.61 $22.23 $13.22 $16.47 $19.53 $22.35 $26.53<br />
43-5071 Shipping, Receiving, and Traffic Clerks $9.38 $13.61 $15.73 $8.60 $10.46 $13.37 $16.23 $19.28<br />
43-5081 Stock Clerks and Order Fillers $8.56 $12.12 $13.91 $7.85 $9.24 $11.54 $14.80 $17.09<br />
Weighers, Measurers, Checkers, and Samplers,<br />
43-5111<br />
Recordkeeping<br />
$7.85 $12.94 $15.49 $7.23 $8.78 $12.30 $16.06 $19.75<br />
43-6011 Executive Secretaries and Administrative Assistants $15.18 $20.00 $22.41 $14.41 $16.59 $19.56 $22.82 $26.81<br />
43-6013 Medical Secretaries $12.31 $17.46 $20.03 $11.64 $13.32 $15.89 $22.59 $26.80<br />
43-6014 Secretaries, Except Legal, Medical, and Executive $10.76 $14.87 $16.93 $9.65 $12.08 $14.75 $17.47 $20.72<br />
43-9011 Computer Operators $12.74 $18.49 $21.36 $11.45 $14.29 $17.28 $22.73 $27.14<br />
43-9021 Data Entry Keyers $10.24 $13.37 $14.93 $9.54 $11.07 $12.84 $15.63 $18.57<br />
43-9022 Word Processors and Typists $13.45 $16.80 $18.48 $12.29 $14.45 $16.35 $18.77 $22.83<br />
* annual wage data<br />
† insufficient wage data
Denver Metro Region JVS —<strong>Spring</strong> <strong>2006</strong><br />
25<br />
Denver Metro Region Occupational Employment Statistics (OES) Wages (Nov. 2004 wages based on data released Nov. 2005)–18<br />
SOC<br />
Code<br />
SOC Occupational Title<br />
Entry-<br />
Level<br />
Average Wages<br />
Overall<br />
Experienced<br />
Percentile Distribution<br />
10th 25th 50th 75th 90th<br />
43-9041 Insurance Claims and Policy Processing Clerks $13.00 $16.00 $17.51 $12.15 $13.79 $15.84 $18.12 $20.67<br />
Mail Clerks and Mail Machine Operators, Except Postal<br />
43-9051<br />
Service<br />
$9.63 $13.25 $15.05 $9.00 $11.07 $12.99 $15.79 $18.61<br />
43-9061 Office Clerks, General $9.36 $13.53 $15.61 $8.69 $10.73 $13.10 $16.21 $19.45<br />
43-9071 Office Machine Operators, Except Computer $9.46 $13.16 $15.01 $9.06 $10.19 $12.52 $15.96 $19.22<br />
43-9111 Statistical Assistants $14.32 $19.57 $22.19 $13.61 $15.66 $19.51 $23.71 $26.35<br />
43-9199 Office and Administrative Support Workers, All Other $11.22 $15.33 $17.39 $10.59 $12.84 $15.41 $17.91 $20.72<br />
First-Line Supervisors/Managers of Farming, Fishing, and<br />
45-1011<br />
Forestry Workers<br />
$11.29 $20.09 $24.48 $9.83 $13.42 $16.29 $27.71 $35.01<br />
45-2011 Agricultural Inspectors $16.13 $20.83 $23.18 $14.75 $17.46 $21.59 $24.51 $26.27<br />
Farmworkers and Laborers, Crop, Nursery, and<br />
45-2092<br />
Greenhouse<br />
$6.46 $11.22 $13.60 $6.01 $6.98 $8.65 $16.91 $20.35<br />
45-2093 Farmworkers, Farm and Ranch Animals $7.58 $8.73 $9.31 $7.16 $7.62 $8.38 $9.91 $10.94<br />
First-Line Supervisors/Managers of Construction Trades<br />
47-1011<br />
and Extraction Workers<br />
$19.46 $27.30 $31.22 $17.87 $21.74 $26.11 $32.03 $38.27<br />
47-2021 Brickmasons and Blockmasons $17.52 $23.12 $25.92 $16.21 $19.45 $23.52 $27.03 $30.90<br />
47-2031 Carpenters $12.12 $18.58 $21.82 $10.54 $14.63 $17.69 $21.84 $27.66<br />
47-2041 Carpet Installers $13.60 $17.87 $20.00 $12.38 $14.44 $16.15 $19.75 $26.98<br />
47-2044 Tile and Marble Setters $11.26 $19.94 $24.28 $9.51 $13.88 $20.95 $25.14 $27.57<br />
47-2051 Cement Masons and Concrete Finishers $11.41 $15.92 $18.17 $10.74 $12.73 $15.36 $18.39 $23.35<br />
47-2061 Construction Laborers $9.02 $12.98 $14.96 $8.61 $10.16 $12.57 $15.53 $18.09<br />
47-2071 Paving, Surfacing, and Tamping Equipment Operators $14.09 $17.22 $18.78 $13.41 $14.81 $16.66 $19.81 $22.11<br />
Operating Engineers and Other Construction Equipment<br />
47-2073<br />
Operators<br />
$14.60 $19.33 $21.70 $14.21 $16.02 $18.89 $21.94 $26.33<br />
47-2081 Drywall and Ceiling Tile Installers $9.90 $15.06 $17.64 $8.83 $11.11 $15.07 $18.51 $21.73<br />
47-2082 Tapers $11.12 $15.38 $17.51 $10.48 $12.26 $15.45 $17.91 $20.73<br />
47-2111 Electricians $15.73 $21.78 $24.80 $13.83 $18.01 $22.15 $26.15 $29.08<br />
* annual wage data<br />
† insufficient wage data
Denver Metro Region JVS —<strong>Spring</strong> <strong>2006</strong><br />
26<br />
Denver Metro Region Occupational Employment Statistics (OES) Wages (Nov. 2004 wages based on data released Nov. 2005)–19<br />
SOC<br />
Code<br />
SOC Occupational Title<br />
Entry-<br />
Level<br />
Average Wages<br />
Overall<br />
Experienced<br />
Percentile Distribution<br />
10th 25th 50th 75th 90th<br />
47-2121 Glaziers $14.44 $20.49 $23.52 $13.98 $16.22 $19.70 $25.06 $30.19<br />
47-2131 Insulation Workers, Floor, Ceiling, and Wall $11.23 $15.34 $17.40 $10.64 $12.42 $15.02 $17.48 $21.25<br />
47-2141 Painters, Construction and Maintenance $10.11 $15.07 $17.55 $8.62 $11.81 $15.28 $17.60 $21.37<br />
47-2151 Pipelayers $10.87 $14.34 $16.07 $10.04 $11.38 $13.37 $16.63 $20.14<br />
47-2152 Plumbers, Pipefitters, and Steamfitters $13.80 $20.17 $23.36 $12.45 $15.73 $20.32 $24.62 $27.46<br />
47-2181 Roofers $10.93 $14.39 $16.13 $9.92 $11.71 $14.03 $16.81 $19.95<br />
47-2211 Sheet Metal Workers $10.09 $15.38 $18.03 $9.30 $11.34 $14.74 $18.37 $23.72<br />
47-2221 Structural Iron and Steel Workers $17.71 $22.21 $24.46 $16.51 $19.40 $22.93 $25.80 $27.53<br />
Helpers--Brickmasons, Blockmasons, Stonemasons, and<br />
47-3011<br />
Tile and Marble Setters<br />
$8.43 $13.18 $15.55 $7.76 $9.29 $12.75 $16.90 $20.22<br />
47-3012 Helpers--Carpenters $9.61 $11.93 $13.08 $9.20 $10.24 $11.82 $13.42 $15.51<br />
47-3013 Helpers--Electricians $9.98 $14.14 $16.23 $9.38 $11.28 $13.70 $16.78 $20.47<br />
Helpers--Painters, Paperhangers, Plasterers, and Stucco<br />
47-3014<br />
Masons<br />
$9.45 $11.65 $12.74 $8.77 $10.24 $11.84 $13.22 $14.24<br />
47-3016 Helpers--Roofers $7.95 $11.04 $12.59 $7.61 $8.47 $9.91 $12.78 $17.34<br />
47-4011 Construction and Building Inspectors $16.19 $23.53 $27.20 $14.70 $18.01 $23.47 $28.29 $33.62<br />
47-4051 Highway Maintenance Workers $14.11 $17.27 $18.85 $13.51 $14.70 $16.88 $19.87 $22.00<br />
47-4071 Septic Tank Servicers and Sewer Pipe Cleaners $15.66 $21.96 $25.11 $13.94 $17.58 $20.35 $23.90 $27.53<br />
47-4099 Construction and Related Workers, All Other $12.81 $17.08 $19.21 $12.34 $13.89 $17.03 $20.38 $22.12<br />
47-5011 Derrick Operators, Oil and Gas $15.53 $20.34 $22.75 $14.73 $16.78 $20.00 $23.96 $26.83<br />
47-5012 Rotary Drill Operators, Oil and Gas $14.04 $20.73 $24.07 $12.85 $16.13 $21.26 $25.32 $28.05<br />
47-5021 Earth Drillers, Except Oil and Gas $15.28 $18.81 $20.58 $14.61 $16.03 $18.60 $21.14 $23.09<br />
47-5071 Roustabouts, Oil and Gas $10.75 $15.46 $17.82 $9.76 $12.13 $14.68 $18.60 $23.38<br />
First-Line Supervisors/Managers of Mechanics, Installers,<br />
49-1011<br />
and Repairers<br />
$17.14 $26.98 $31.90 $15.78 $19.46 $25.53 $32.79 $40.22<br />
49-2011 Computer, Automated Teller, and Office Machine Repairers $12.69 $18.74 $21.76 $11.27 $14.28 $17.97 $23.34 $27.02<br />
* annual wage data<br />
† insufficient wage data
Denver Metro Region JVS —<strong>Spring</strong> <strong>2006</strong><br />
27<br />
Denver Metro Region Occupational Employment Statistics (OES) Wages (Nov. 2004 wages based on data released Nov. 2005)–20<br />
SOC<br />
Code<br />
SOC Occupational Title<br />
Entry-<br />
Level<br />
Average Wages<br />
Overall<br />
Experienced<br />
Percentile Distribution<br />
10th 25th 50th 75th 90th<br />
Telecommunications Equipment Installers and Repairers,<br />
49-2022<br />
Except Line Installers<br />
$21.63 $24.74 $26.30 $19.59 $22.93 $25.01 $27.07 $29.50<br />
49-2091 Avionics Technicians $16.50 $23.02 $26.28 $15.03 $18.07 $22.09 $29.22 $32.65<br />
49-2092 Electric Motor, Power Tool, and Related Repairers $11.43 $18.11 $21.45 $10.48 $12.75 $18.81 $23.16 $26.01<br />
Electrical and Electronics Installers and Repairers,<br />
49-2093<br />
Transportation Equipment<br />
$15.93 $18.48 $19.75 $14.89 $17.00 $19.00 $20.62 $21.64<br />
Electrical and Electronics Repairers, Commercial and<br />
49-2094<br />
Industrial Equipment<br />
$14.68 $20.23 $23.01 $13.15 $16.50 $19.67 $23.82 $27.79<br />
Electronic Equipment Installers and Repairers, Motor<br />
49-2096<br />
Vehicles<br />
$9.79 $13.30 $15.06 $9.26 $10.37 $12.67 $15.87 $19.28<br />
Electronic <strong>Home</strong> Entertainment Equipment Installers and<br />
49-2097<br />
Repairers<br />
$11.75 $16.34 $18.63 $11.30 $12.73 $15.70 $19.77 $23.17<br />
49-2098 Security and Fire Alarm Systems Installers $15.88 $20.23 $22.41 $15.14 $16.56 $19.26 $22.23 $28.96<br />
49-3011 Aircraft Mechanics and Service Technicians $19.05 $25.50 $28.73 $18.07 $20.82 $26.04 $30.72 $33.42<br />
49-3021 Automotive Body and Related Repairers $14.73 $23.87 $28.44 $13.36 $16.84 $23.57 $29.63 $35.38<br />
49-3023 Automotive Service Technicians and Mechanics $11.40 $18.71 $22.37 $9.82 $13.16 $18.05 $23.71 $27.71<br />
49-3031 Bus and Truck Mechanics and Diesel Engine Specialists $16.64 $21.72 $24.26 $15.17 $18.01 $20.49 $24.31 $30.16<br />
49-3042 Mobile Heavy Equipment Mechanics, Except Engines $16.48 $19.98 $21.74 $14.89 $17.89 $20.06 $22.12 $25.29<br />
49-3052 Motorcycle Mechanics $12.47 $18.75 $21.90 $10.85 $14.21 $17.48 $23.32 $28.69<br />
Outdoor Power Equipment and Other Small Engine<br />
49-3053<br />
Mechanics<br />
$8.31 $12.33 $14.34 $7.89 $8.82 $10.56 $14.88 $20.78<br />
49-3093 Tire Repairers and Changers $8.18 $10.49 $11.65 $7.71 $8.81 $10.26 $11.79 $13.77<br />
Control and Valve Installers and Repairers, Except<br />
49-9012<br />
Mechanical Door<br />
$12.47 $18.48 $21.49 $11.97 $13.26 $18.50 $22.55 $26.47<br />
Heating, Air Conditioning, and Refrigeration Mechanics and<br />
49-9021<br />
Installers<br />
$14.41 $19.93 $22.69 $13.53 $15.74 $19.65 $24.26 $26.97<br />
49-9031 <strong>Home</strong> Appliance Repairers $13.34 $21.73 $25.92 $12.08 $15.26 $19.04 $25.30 $35.06<br />
49-9041 Industrial Machinery Mechanics $16.89 $22.02 $24.58 $15.48 $18.40 $21.71 $25.74 $28.87<br />
* annual wage data<br />
† insufficient wage data
Denver Metro Region JVS —<strong>Spring</strong> <strong>2006</strong><br />
28<br />
Denver Metro Region Occupational Employment Statistics (OES) Wages (Nov. 2004 wages based on data released Nov. 2005)–21<br />
SOC<br />
Code<br />
SOC Occupational Title<br />
Entry-<br />
Level<br />
Average Wages<br />
Overall<br />
Experienced<br />
Percentile Distribution<br />
10th 25th 50th 75th 90th<br />
49-9042 Maintenance and Repair Workers, General $10.48 $16.34 $19.26 $9.41 $12.31 $15.86 $20.03 $24.79<br />
49-9044 Millwrights $14.25 $20.87 $24.17 $12.49 $16.36 $22.14 $25.53 $27.53<br />
49-9051 Electrical Power-Line Installers and Repairers $20.66 $25.88 $28.48 $18.83 $22.58 $25.98 $30.14 $33.51<br />
49-9052 Telecommunications Line Installers and Repairers $11.40 $16.72 $19.38 $10.87 $12.70 $15.88 $20.15 $25.03<br />
49-9062 Medical Equipment Repairers $15.26 $20.66 $23.36 $13.57 $17.56 $20.75 $24.53 $27.05<br />
49-9069 Precision Instrument and Equipment Repairers, All Other $20.47 $26.71 $29.82 $18.91 $21.55 $28.37 $31.75 $33.87<br />
Coin, Vending, and Amusement Machine Servicers and<br />
49-9091<br />
Repairers<br />
$8.82 $14.50 $17.34 $8.12 $9.85 $13.43 $17.38 $24.49<br />
49-9094 Locksmiths and Safe Repairers $11.67 $15.29 $17.10 $11.07 $12.31 $14.14 $18.11 $21.28<br />
49-9098 Helpers--Installation, Maintenance, and Repair Workers $8.13 $11.30 $12.88 $7.21 $9.01 $10.37 $12.95 $16.94<br />
49-9099 Installation, Maintenance, and Repair Workers, All Other $9.97 $16.56 $19.86 $8.27 $11.91 $16.26 $21.03 $25.28<br />
First-Line Supervisors/Managers of Production and<br />
51-1011<br />
Operating Workers<br />
$16.72 $24.54 $28.45 $15.19 $18.56 $23.37 $29.13 $36.82<br />
51-2022 Electrical and Electronic Equipment Assemblers $9.24 $12.41 $14.00 $8.98 $10.15 $12.06 $14.22 $17.11<br />
51-2023 Electromechanical Equipment Assemblers $9.84 $14.36 $16.62 $8.86 $11.11 $13.36 $17.89 $21.30<br />
51-2041 Structural Metal Fabricators and Fitters $12.62 $17.08 $19.31 $11.60 $13.72 $16.61 $20.45 $24.03<br />
51-2092 Team Assemblers $8.31 $12.09 $13.98 $7.54 $9.24 $11.61 $14.44 $17.38<br />
51-2099 Assemblers and Fabricators, All Other $8.77 $11.43 $12.76 $8.01 $9.34 $10.67 $12.82 $16.71<br />
51-3011 Bakers $9.14 $13.22 $15.26 $8.65 $10.07 $13.03 $15.84 $17.81<br />
51-3021 Butchers and Meat Cutters $11.21 $15.53 $17.68 $10.34 $12.60 $15.80 $18.94 $20.82<br />
Food and Tobacco Roasting, Baking, and Drying Machine<br />
51-3091<br />
Operators and Tenders<br />
$9.17 $12.81 $14.62 $8.69 $9.73 $12.75 $16.13 $17.56<br />
51-3092 Food Batchmakers $8.02 $11.33 $12.99 $7.45 $8.57 $11.52 $13.26 $15.85<br />
51-3093 Food Cooking Machine Operators and Tenders $7.35 $9.96 $11.26 $7.05 $7.89 $9.37 $11.44 $14.77<br />
Computer-Controlled Machine Tool Operators, Metal and<br />
51-4011<br />
Plastic<br />
$10.96 $15.75 $18.15 $10.01 $12.05 $15.81 $19.28 $21.66<br />
51-4012 Numerical Tool and Process Control Programmers $18.82 $23.36 $25.62 $18.26 $20.05 $23.31 $26.61 $29.58<br />
* annual wage data<br />
† insufficient wage data
Denver Metro Region JVS —<strong>Spring</strong> <strong>2006</strong><br />
29<br />
Denver Metro Region Occupational Employment Statistics (OES) Wages (Nov. 2004 wages based on data released Nov. 2005)–22<br />
SOC<br />
Code<br />
SOC Occupational Title<br />
Entry-<br />
Level<br />
Average Wages<br />
Overall<br />
Experienced<br />
Percentile Distribution<br />
10th 25th 50th 75th 90th<br />
Extruding and Drawing Machine Setters, Operators, and<br />
51-4021<br />
Tenders, Metal and Plastic<br />
$10.20 $14.12 $16.09 $9.15 $11.33 $14.03 $16.42 $19.43<br />
Cutting, Punching, and Press Machine Setters, Operators,<br />
51-4031<br />
and Tenders, Metal and Plastic<br />
$11.77 $17.56 $20.45 $10.94 $13.05 $17.18 $21.72 $25.78<br />
Grinding, Lapping, Polishing, and Buffing Machine Tool<br />
51-4033<br />
Setters, Operators, and Tenders, Me<br />
$9.77 $12.53 $13.92 $9.33 $10.30 $12.03 $14.21 $17.12<br />
Milling and Planing Machine Setters, Operators, and<br />
51-4035<br />
Tenders, Metal and Plastic<br />
$11.05 $16.15 $18.70 $10.06 $12.32 $15.23 $18.91 $24.27<br />
51-4041 Machinists $13.07 $18.81 $21.68 $11.46 $15.01 $18.85 $22.35 $26.27<br />
51-4052 Pourers and Casters, Metal $8.90 $11.38 $12.63 $8.11 $9.40 $10.76 $12.98 $14.28<br />
51-4071 Foundry Mold and Coremakers $7.72 $11.44 $13.30 $6.49 $9.16 $10.96 $13.46 $16.70<br />
Molding, Coremaking, and Casting Machine Setters,<br />
51-4072<br />
Operators, and Tenders, Metal and Plasti<br />
$8.27 $11.79 $13.55 $7.69 $8.79 $10.72 $13.48 $17.41<br />
Multiple Machine Tool Setters, Operators, and Tenders,<br />
51-4081<br />
Metal and Plastic<br />
$11.14 $13.71 $15.00 $10.67 $11.69 $13.03 $15.85 $18.08<br />
51-4111 Tool and Die Makers $16.87 $21.62 $23.99 $15.48 $18.63 $21.73 $25.35 $27.69<br />
51-4121 Welders, Cutters, Solderers, and Brazers $12.99 $16.78 $18.67 $11.91 $14.21 $16.75 $19.69 $21.58<br />
Welding, Soldering, and Brazing Machine Setters,<br />
51-4122<br />
Operators, and Tenders<br />
$10.65 $14.83 $16.93 $9.62 $11.76 $14.94 $17.70 $20.46<br />
Heat Treating Equipment Setters, Operators, and Tenders,<br />
51-4191<br />
Metal and Plastic<br />
$10.25 $15.21 $17.69 $7.27 $12.47 $15.51 $18.04 $21.18<br />
51-4192 Lay-Out Workers, Metal and Plastic $12.42 $19.38 $22.86 $11.92 $13.31 $20.18 $25.37 $27.44<br />
Plating and Coating Machine Setters, Operators, and<br />
51-4193<br />
Tenders, Metal and Plastic<br />
$9.73 $12.28 $13.56 $9.20 $10.02 $11.63 $13.72 $16.72<br />
51-4199 Metal Workers and Plastic Workers, All Other $10.49 $15.67 $18.26 $9.58 $11.55 $15.74 $19.35 $21.61<br />
51-5011 Bindery Workers $9.15 $13.65 $15.91 $8.72 $9.89 $12.08 $17.41 $21.30<br />
51-5022 Prepress Technicians and Workers $12.49 $18.21 $21.07 $11.80 $13.65 $17.91 $23.00 $25.97<br />
51-5023 Printing Machine Operators $12.52 $18.11 $20.90 $11.10 $14.23 $17.72 $21.47 $26.26<br />
51-6011 Laundry and Dry-Cleaning Workers $7.77 $11.50 $13.36 $7.37 $8.45 $10.06 $14.25 $19.03<br />
* annual wage data<br />
† insufficient wage data
Denver Metro Region JVS —<strong>Spring</strong> <strong>2006</strong><br />
30<br />
Denver Metro Region Occupational Employment Statistics (OES) Wages (Nov. 2004 wages based on data released Nov. 2005)–23<br />
SOC<br />
Code<br />
SOC Occupational Title<br />
Entry-<br />
Level<br />
Average Wages<br />
Overall<br />
Experienced<br />
Percentile Distribution<br />
10th 25th 50th 75th 90th<br />
51-6021 Pressers, Textile, Garment, and Related Materials $6.64 $9.29 $10.61 $6.14 $7.32 $9.39 $11.16 $12.80<br />
51-6031 Sewing Machine Operators $7.86 $10.69 $12.11 $7.21 $8.67 $9.95 $12.08 $15.86<br />
51-6051 Sewers, Hand $7.77 $10.67 $12.12 $6.38 $9.05 $10.44 $13.06 $15.14<br />
51-6093 Upholsterers $11.44 $14.84 $16.54 $11.41 $12.93 $14.84 $16.96 $19.88<br />
51-7011 Cabinetmakers and Bench Carpenters $10.11 $14.42 $16.58 $9.61 $10.96 $13.85 $17.74 $20.68<br />
51-7021 Furniture Finishers $11.50 $16.06 $18.34 $10.59 $12.91 $16.01 $19.32 $21.58<br />
51-7041 Sawing Machine Setters, Operators, and Tenders, Wood $10.53 $13.25 $14.61 $9.73 $11.15 $12.72 $14.69 $17.41<br />
Woodworking Machine Setters, Operators, and Tenders,<br />
51-7042<br />
Except Sawing<br />
$9.73 $13.57 $15.49 $9.35 $10.37 $12.59 $16.19 $19.99<br />
51-8013 Power Plant Operators $21.49 $25.24 $27.11 $19.55 $22.79 $25.36 $27.90 $31.57<br />
51-8021 Stationary Engineers and Boiler Operators $14.75 $21.36 $24.66 $12.95 $17.16 $21.37 $25.55 $29.81<br />
Water and Liquid Waste Treatment Plant and System<br />
51-8031<br />
Operators<br />
$17.59 $22.94 $25.62 $16.89 $20.13 $23.87 $26.35 $27.97<br />
51-8092 Gas Plant Operators $17.24 $22.89 $25.72 $15.82 $18.35 $21.88 $27.21 $32.25<br />
Petroleum Pump System Operators, Refinery Operators,<br />
51-8093<br />
and Gaugers<br />
$20.15 $23.25 $24.79 $18.58 $22.27 $24.17 $26.01 $27.12<br />
51-8099 Plant and System Operators, All Other $14.52 $20.52 $23.51 $13.03 $16.31 $21.51 $24.77 $26.78<br />
51-9011 Chemical Equipment Operators and Tenders $11.84 $15.50 $17.33 $11.35 $12.79 $15.29 $18.12 $21.02<br />
Crushing, Grinding, and Polishing Machine Setters,<br />
51-9021<br />
Operators, and Tenders<br />
$10.09 $14.08 $16.07 $9.49 $10.70 $13.40 $17.09 $20.17<br />
51-9022 Grinding and Polishing Workers, Hand $9.84 $12.92 $14.46 $9.41 $10.33 $11.70 $14.22 $19.48<br />
Mixing and Blending Machine Setters, Operators, and<br />
51-9023<br />
Tenders<br />
$9.71 $14.76 $17.28 $8.95 $11.37 $15.08 $17.35 $21.00<br />
51-9031 Cutters and Trimmers, Hand $9.03 $12.48 $14.21 $8.00 $10.21 $12.88 $15.19 $16.47<br />
Cutting and Slicing Machine Setters, Operators, and<br />
51-9032<br />
Tenders<br />
Extruding, Forming, Pressing, and Compacting Machine<br />
51-9041<br />
Setters, Operators, and Tenders<br />
* annual wage data<br />
† insufficient wage data<br />
$9.17 $12.84 $14.68 $8.75 $9.63 $11.41 $15.98 $18.41<br />
$6.83 $12.06 $14.68 $6.03 $7.84 $11.88 $15.88 $18.93
Denver Metro Region JVS —<strong>Spring</strong> <strong>2006</strong><br />
31<br />
Denver Metro Region Occupational Employment Statistics (OES) Wages (Nov. 2004 wages based on data released Nov. 2005)–24<br />
SOC<br />
Code<br />
SOC Occupational Title<br />
Entry-<br />
Level<br />
Average Wages<br />
Overall<br />
Experienced<br />
Percentile Distribution<br />
10th 25th 50th 75th 90th<br />
51-9061 Inspectors, Testers, Sorters, Samplers, and Weighers $10.59 $16.70 $19.75 $9.55 $12.06 $15.58 $20.61 $26.29<br />
51-9071 Jewelers and Precious Stone and Metal Workers $11.44 $16.04 $18.34 $11.00 $12.02 $13.48 $17.14 $24.94<br />
51-9111 Packaging and Filling Machine Operators and Tenders $7.99 $11.93 $13.90 $7.17 $9.04 $11.67 $14.59 $17.22<br />
Coating, Painting, and Spraying Machine Setters,<br />
51-9121<br />
Operators, and Tenders<br />
$10.24 $13.67 $15.39 $9.07 $11.39 $13.21 $15.75 $19.15<br />
51-9122 Painters, Transportation Equipment $12.38 $23.26 $28.69 $9.28 $16.09 $23.97 $27.76 $39.74<br />
51-9123 Painting, Coating, and Decorating Workers $9.89 $12.96 $14.50 $9.09 $10.71 $12.78 $14.86 $16.97<br />
51-9131 Photographic Process Workers $8.74 $13.60 $16.03 $8.00 $9.75 $12.27 $16.31 $21.67<br />
51-9132 Photographic Processing Machine Operators $8.94 $11.38 $12.60 $8.41 $9.33 $10.59 $12.81 $15.98<br />
51-9141 Semiconductor Processors $9.84 $12.78 $14.25 $9.34 $10.23 $11.82 $13.72 $17.40<br />
51-9191 Cementing and Gluing Machine Operators and Tenders $12.43 $15.41 $16.90 $11.06 $13.83 $15.47 $17.08 $20.17<br />
Cleaning, Washing, and Metal Pickling Equipment<br />
51-9192<br />
Operators and Tenders<br />
$9.21 $12.21 $13.71 $8.62 $9.77 $11.55 $14.20 $16.88<br />
51-9195 Molders, Shapers, and Casters, Except Metal and Plastic $9.16 $11.62 $12.85 $8.70 $9.27 $10.27 $12.66 $18.08<br />
51-9196 Paper Goods Machine Setters, Operators, and Tenders $13.67 $16.49 $17.91 $12.55 $14.69 $16.60 $18.80 $20.92<br />
51-9198 Helpers--Production Workers $7.12 $10.59 $12.32 $6.81 $7.74 $9.52 $12.53 $17.36<br />
51-9199 Production Workers, All Other $7.00 $11.47 $13.71 $6.37 $7.99 $10.68 $13.34 $18.84<br />
53-1011 Aircraft Cargo Handling Supervisors $11.79 $19.76 $23.75 $10.88 $13.08 $15.64 $21.96 $39.64<br />
First-Line Supervisors/Managers of Helpers, Laborers, and<br />
53-1021<br />
Material Movers, Hand<br />
$14.71 $20.62 $23.58 $13.82 $16.59 $20.00 $24.16 $28.91<br />
First-Line Supervisors/Managers of Transportation and<br />
53-1031<br />
Material-Moving Machine and Vehicle<br />
$15.94 $25.42 $30.17 $13.80 $18.36 $23.59 $28.82 $35.71<br />
* 53-2011 Airline Pilots, Copilots, and Flight Engineers $65,403 $101,654 $119,780 $48,119 $80,346 $97,017 $128,828 $144,721<br />
* 53-2012 Commercial Pilots $23,754 $57,983 $75,098 $20,345 $27,035 $48,699 $87,923 $110,112<br />
53-2021 Air Traffic Controllers $39.45 $53.91 $61.14 $36.77 $46.50 $58.58 $64.38 $67.86<br />
53-2022 Airfield Operations Specialists $15.17 $24.16 $28.65 $14.59 $16.52 $25.11 $31.46 $34.52<br />
53-3021 Bus Drivers, Transit and Intercity $12.25 $15.40 $16.97 $11.77 $12.81 $14.64 $18.37 $20.89<br />
* annual wage data<br />
† insufficient wage data
Denver Metro Region JVS —<strong>Spring</strong> <strong>2006</strong><br />
32<br />
Denver Metro Region Occupational Employment Statistics (OES) Wages (Nov. 2004 wages based on data released Nov. 2005)–25<br />
SOC<br />
Code<br />
SOC Occupational Title<br />
Entry-<br />
Level<br />
Average Wages<br />
Overall<br />
Experienced<br />
Percentile Distribution<br />
10th 25th 50th 75th 90th<br />
53-3022 Bus Drivers, School $11.24 $14.17 $15.64 $10.52 $12.04 $14.18 $16.38 $18.10<br />
53-3031 Driver/Sales Workers $6.01 $11.26 $13.89 $5.73 $6.53 $10.17 $14.89 $18.92<br />
53-3032 Truck Drivers, Heavy and Tractor-Trailer $14.04 $17.65 $19.45 $13.30 $14.99 $17.04 $20.22 $23.70<br />
53-3033 Truck Drivers, Light or Delivery Services $9.67 $14.33 $16.66 $8.89 $10.87 $14.04 $17.20 $20.96<br />
53-3041 Taxi Drivers and Chauffeurs $8.13 $10.41 $11.55 $7.48 $8.85 $10.28 $11.99 $13.25<br />
53-3099 Motor Vehicle Operators, All Other $7.98 $13.26 $15.91 $6.72 $9.21 $12.77 $18.09 $20.55<br />
53-6021 Parking Lot Attendants $6.56 $8.74 $9.84 $6.07 $7.10 $8.44 $10.30 $12.26<br />
53-6031 Service Station Attendants $7.03 $9.62 $10.91 $6.50 $7.66 $9.22 $11.03 $13.52<br />
53-7011 Conveyor Operators and Tenders $10.18 $13.41 $15.03 $9.45 $10.86 $12.77 $15.44 $19.18<br />
53-7021 Crane and Tower Operators $14.34 $19.84 $22.59 $12.97 $16.25 $19.81 $23.72 $27.07<br />
53-7051 Industrial Truck and Tractor Operators $11.07 $14.20 $15.76 $10.17 $11.84 $13.76 $16.38 $19.22<br />
53-7061 Cleaners of Vehicles and Equipment $6.86 $10.17 $11.82 $6.16 $7.89 $9.79 $11.64 $15.30<br />
53-7062 Laborers and Freight, Stock, and Material Movers, Hand $8.27 $11.35 $12.90 $7.48 $9.09 $10.76 $13.27 $16.33<br />
53-7063 Machine Feeders and Offbearers $9.37 $12.63 $14.27 $8.78 $10.47 $12.73 $14.97 $16.65<br />
53-7064 Packers and Packagers, Hand $7.33 $9.21 $10.15 $7.00 $7.54 $8.39 $10.28 $13.66<br />
53-7072 Pump Operators, Except Wellhead Pumpers $12.98 $21.23 $25.35 $10.05 $11.42 $23.81 $26.10 $27.47<br />
53-7073 Wellhead Pumpers $12.41 $17.85 $20.57 $12.23 $13.71 $16.90 $22.73 $25.85<br />
53-7081 Refuse and Recyclable Material Collectors $10.03 $13.52 $15.26 $8.56 $11.21 $12.86 $16.01 $19.66<br />
53-7121 Tank Car, Truck, and Ship Loaders $10.31 $14.40 $16.44 $9.37 $11.25 $13.81 $17.09 $20.47<br />
53-7199 Material Moving Workers, All Other $9.06 $11.77 $13.13 $8.24 $9.51 $10.65 $13.22 $18.31<br />
* annual wage data<br />
† insufficient wage data
Denver Metro Region JVS —<strong>Spring</strong> <strong>2006</strong><br />
33<br />
DENVER METRO REGION WORKFORCE CENTERS<br />
Adams County One Stop<br />
Career Center<br />
12200 N. Pecos St.<br />
Westminster, CO 80234<br />
Phone: 303-453-8600<br />
Fax: 303-453-8655<br />
Broomfield WFC<br />
6650 W. 120th Ave.<br />
Broomfield, CO 80020<br />
Phone: 303-464-5855<br />
Fax: 303-465-0117<br />
Douglas County WFC<br />
(Tues. by appt.)<br />
101 Third St.<br />
Castle Rock, CO 80104<br />
Phone: 303-688-4825<br />
Fax: 303-688-0292<br />
Longmont WFC<br />
1500 Kansas Ave., Suite 4D<br />
Longmont, CO 80501<br />
Phone: 303-651-1510<br />
Fax: 303-651-0288<br />
Arapahoe/Douglas WORKS!<br />
Arapahoe CentrePoint Plaza<br />
14980 E. Alameda Dr.<br />
Aurora, CO 80012<br />
Phone: 303-636-1160<br />
Fax: 303-636-1250<br />
Aurora WFC<br />
3508 Peoria St., #D<br />
Aurora, CO 80010<br />
Phone: 303-363-9380<br />
Fax: 303-363-9381<br />
Aurora WFC<br />
Community College of Aurora<br />
16000 E. Centre Tech Pkwy., A-106C<br />
Aurora, CO 80011<br />
Phone: 303-340-7575<br />
Boulder County WFC<br />
2905 Center Green Ct., Suite B<br />
Boulder, CO 80301<br />
Phone: 303-301-2900<br />
Fax: 303-939-0054<br />
Brighton WFC<br />
18 N. Main St.<br />
Brighton, CO 80601<br />
Phone: 303-659-4250<br />
Fax: 303-659-9178<br />
Denver International<br />
Airport WFC<br />
Please call <strong>for</strong> office hours.<br />
8500 Pena Blvd.<br />
6th Level, Main Terminal, West<br />
Denver, CO 80249<br />
Phone: 303-342-2590<br />
Fax: 303-342-2592<br />
Denver Office of Economic<br />
Development, Division of<br />
Work<strong>for</strong>ce Development<br />
1391 N. Speer Blvd., #500<br />
Denver, CO 80204<br />
<strong>Job</strong> Seekers:<br />
Phone: 720-865-5619<br />
Fax: 720-865-5685<br />
Employer Services <strong>Job</strong> Unit:<br />
Phone: 720-913-1648<br />
Fax: 720-913-1652<br />
Denver Youth WFC<br />
1391 N. Speer Blvd., #710<br />
Denver, CO 80204<br />
Phone: 720-865-5700<br />
Fax: 720-865-5681<br />
Front Range<br />
Community College WFC<br />
Closed during semester breaks.<br />
3645 W. 112th Ave., Rm. B-1315<br />
Westminster, CO 80031<br />
Phone: 303-404-5163<br />
Fax: 303-438-9524<br />
Lakewood WFC<br />
730 Simms, Suite 300<br />
Golden, CO 80401<br />
Phone: 303-271-4700<br />
Fax: 303-271-4708<br />
Littleton WFC<br />
1610 W. Littleton Blvd., Suite 100<br />
Littleton, CO 80120<br />
Phone: 303-734-5200<br />
Fax: 303-734-5229<br />
Lone Tree WFC<br />
Park Meadows Center<br />
9350 Heritage Hills Circle<br />
Lone Tree, CO 80124<br />
Phone: 303-784-7868<br />
Fax: 303-799-0223<br />
Quigg Newton WFC<br />
4440 Navajo St.<br />
Denver, CO 80211<br />
Phone: 303-458-4891<br />
Fax: 303-433-3547<br />
Stapleton Plaza WFC<br />
3401 Quebec, Suite 7700<br />
Denver, CO 80207<br />
Phone: 720-865-0060<br />
Fax: 720-865-0091<br />
Thornton WFC<br />
550 Thornton Pkwy, #200.<br />
Thornton, CO 80229<br />
Phone: 303-452-2304<br />
Fax: 303-452-7072<br />
Westside WFC<br />
1200 Federal Blvd.<br />
Denver, CO 80204<br />
Phone: 720-944-1615<br />
Fax: 720-944-4131<br />
C O L O R A D O<br />
C E N T E R