Revit Sustainable exercise No. 2
Revit Sustainable exercise No. 2
Revit Sustainable exercise No. 2

You also want an ePaper? Increase the reach of your titles
YUMPU automatically turns print PDFs into web optimized ePapers that Google loves.
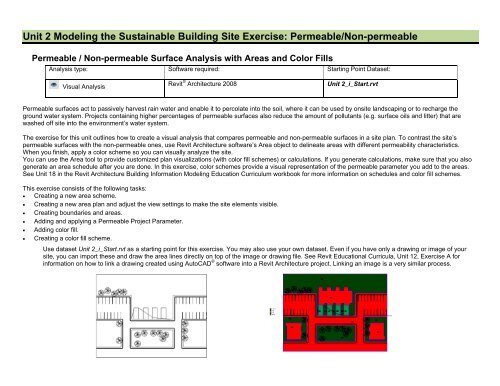
Unit 2 Modeling the <strong>Sustainable</strong> Building Site Exercise: Permeable/<strong>No</strong>n-permeable<br />
Permeable / <strong>No</strong>n-permeable Surface Analysis with Areas and Color Fills<br />
Analysis type: Software required: Starting Point Dataset:<br />
Visual Analysis<br />
<strong>Revit</strong> ® Architecture 2008<br />
Unit 2_i_Start.rvt<br />
Permeable surfaces act to passively harvest rain water and enable it to percolate into the soil, where it can be used by onsite landscaping or to recharge the<br />
ground water system. Projects containing higher percentages of permeable surfaces also reduce the amount of pollutants (e.g. surface oils and litter) that are<br />
washed off site into the environment’s water system.<br />
The <strong>exercise</strong> for this unit outlines how to create a visual analysis that compares permeable and non-permeable surfaces in a site plan. To contrast the site’s<br />
permeable surfaces with the non-permeable ones, use <strong>Revit</strong> Architecture software’s Area object to delineate areas with different permeability characteristics.<br />
When you finish, apply a color scheme so you can visually analyze the site.<br />
You can use the Area tool to provide customized plan visualizations (with color fill schemes) or calculations. If you generate calculations, make sure that you also<br />
generate an area schedule after you are done. In this <strong>exercise</strong>, color schemes provide a visual representation of the permeable parameter you add to the areas.<br />
See Unit 18 in the <strong>Revit</strong> Architecture Building Information Modeling Education Curriculum workbook for more information on schedules and color fill schemes.<br />
This <strong>exercise</strong> consists of the following tasks:<br />
• Creating a new area scheme.<br />
• Creating a new area plan and adjust the view settings to make the site elements visible.<br />
• Creating boundaries and areas.<br />
• Adding and applying a Permeable Project Parameter.<br />
• Adding color fill.<br />
• Creating a color fill scheme.<br />
Use dataset Unit 2_i_Start.rvt as a starting point for this <strong>exercise</strong>. You may also use your own dataset. Even if you have only a drawing or image of your<br />
site, you can import these and draw the area lines directly on top of the image or drawing file. See <strong>Revit</strong> Educational Curricula, Unit 12, Exercise A for<br />
information on how to link a drawing created using AutoCAD ® software into a <strong>Revit</strong> Architecture project. Linking an image is a very similar process.
Before: Initial site plan from sample<br />
After: A color-filled area plan that shows permeable and non-permeable<br />
site areas<br />
1 Create a New Area Scheme<br />
On the Settings menu, access the Room and Area Settings dialog box, Area Schemes tab. Click New. Add a new area scheme and name it Permeable.<br />
<strong>No</strong>te: Area Schemes are used to create separate area boundaries for different purposes. For each Scheme you create, you may also create an associated Area<br />
plan. In each Area plan you may add area boundary lines and area objects to calculate the square footages of different aspects of your project. For<br />
example, you might have a department area scheme, a building code area scheme, and this permeable scheme. Each separate scheme enables you to<br />
place the boundary lines according to the needs of the respective area divisions.<br />
2 Create a New Area Plan<br />
To create a new Level 1 area plan of the permeable area scheme type you just created, click View menu > New > Area Plan. Do NOT associate lines with<br />
exterior walls when prompted. Use the option bar filter to copy just the detail lines from the Level 1 floor plan. To place them in the Permeable Areas Site<br />
Plan, click Edit menu > Paste Aligned. Click View menu > Properties. Finally, select Level Below from the lists under Primary Range Bottom and View
Depth Level.<br />
3 Create the Area Boundaries and Areas<br />
Next, use the area boundary tool to generate the lines that will form the edges of the areas. In this particular <strong>exercise</strong>, establish these boundaries at the<br />
edge of the sidewalk and building footprints. The sidewalk in this example abuts the curb, so the entire area from the grass side of the curb across the<br />
driving area to the far side of the adjacent sidewalk is all non-permeable area (see end result image at beginning of <strong>exercise</strong>).<br />
To establish the bounds of the permeable and non-permeable areas, click Area Boundary. Then, click the pointer arrow and pick the lines from the existing<br />
geometry. After establishing the boundaries, use the Area tool to add areas inside each boundary.<br />
TIPS • On the Hover tab, select multiple lines at once while using the Area Boundary Pick tool.<br />
• Clear the Apply Area Rules check box. Use this option for picking walls.<br />
4 Add and Apply a Permeable Project Parameter
Click Settings menu > Project Parameters to access the Project Parameters dialog box. Add a new parameter that uses the settings shown in the figure<br />
above. Under Categories, select only Areas.<br />
<strong>No</strong>te: Under Parameter Data, permeability is represented with a number. That enables you to represent a range of permeability rather than simply representing it<br />
as permeable or non-permeable. As a result, you can show areas in the parking lot that might have a drivable grid that is neither fully permeable (1.00) nor<br />
fully impermeable (0.00) but somewhere in between.<br />
5 Add the Permeability Information
Select multiple areas that have similar permeability levels. Right-click the selected objects. Click Properties. In the Properties dialog box, assign the<br />
permeability to the new instance parameter. For example, in the image above, apply a permeability number of 1 to all grassy areas on the site. Repeat this<br />
process until you have applied permeability ratios to all areas of the site. If you are using sample project data, assign a permeability of 0 to the drivable<br />
areas and a permeability of .75 to the individual parking areas on the north.<br />
6 Create a New Permeable Color Scheme<br />
Click Settings menu > Color Fill Themes. Create a new theme for the Areas (Permeable) category based on the permeable parameter.
Under Category, select Areas (Permeable).<br />
Click the new scheme icon to create a new scheme and enter a title for the new scheme in the scheme definition dialog box that appears. Click OK to return<br />
to the Edit Color Scheme dialog box.<br />
Click the By Range radio button.<br />
Click the green “+” sign in the left margin to add more ranges.<br />
To modify the range, click in the At Least column and modify the values as desired. To change permeability range colors, click on the color you wish to<br />
change and select a new one. In this same dialog box, you may also set the options to display color fill in the foreground.<br />
7 Add the Color Scheme<br />
Use the Drafting Design bar Color Scheme tool to add the Permeability color scheme to the view.<br />
Exercise complete.<br />
Because the area objects now contain the permeability properties, you may use schedules to both enter the data, and to create totals and percentages of<br />
the whole site with calculated parameters.