Triplet births - Centers for Disease Control and Prevention
Triplet births - Centers for Disease Control and Prevention
Triplet births - Centers for Disease Control and Prevention

You also want an ePaper? Increase the reach of your titles
YUMPU automatically turns print PDFs into web optimized ePapers that Google loves.
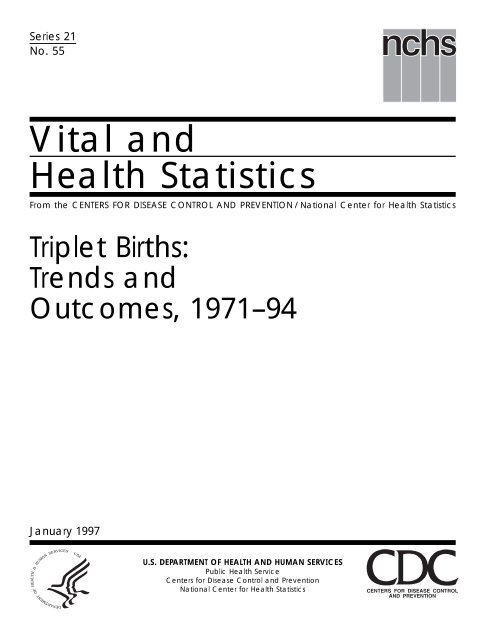
Series 21<br />
No. 55<br />
Vital <strong>and</strong><br />
Health Statistics<br />
From the CENTERS FOR DISEASE CONTROL AND PREVENTION / National Center <strong>for</strong> Health Statistics<br />
<strong>Triplet</strong> Births:<br />
Trends <strong>and</strong><br />
Outcomes, 1971–94<br />
January 1997<br />
U.S. DEPARTMENT OF HEALTH AND HUMAN SERVICES<br />
Public Health Service<br />
<strong>Centers</strong> <strong>for</strong> <strong>Disease</strong> <strong>Control</strong> <strong>and</strong> <strong>Prevention</strong><br />
National Center <strong>for</strong> Health Statistics
Copyright In<strong>for</strong>mation<br />
All material appearing in this report is in the public domain <strong>and</strong> may be<br />
reproduced or copied without permission; citation as to source, however, is<br />
appreciated.<br />
Suggested citation<br />
Martin JA, MacDorman MF, Mathews TJ. <strong>Triplet</strong> <strong>births</strong>: trends <strong>and</strong> outcomes,<br />
1971–94. National Center <strong>for</strong> Health Statistics. Vital Health Stat 21(55). 1997.<br />
Library of Congress Cataloging-in-Publication Data<br />
Martin, Joyce A., M.P.H.<br />
<strong>Triplet</strong> <strong>births</strong>: trends <strong>and</strong> outcomes, 1971–94 / [by Joyce A.<br />
Martin, Marian F. MacDorman, <strong>and</strong> T. J. Mathews.<br />
p. cm. — (DHHS publication ; no. (PHS) 97-1933) (Vital <strong>and</strong><br />
health statistics. Series 21, Data on natality, marriage, <strong>and</strong><br />
divorce ; no. 55)<br />
‘‘February 1997.’’<br />
Includes bibliographical references.<br />
ISBN 0-8406-0524-2<br />
1. <strong>Triplet</strong>s—United States—Statistics. 2. Multiple <strong>births</strong>—<br />
United States—Statistics. I. MacDorman, Marian F. II. Mathews,<br />
T. J. III. National Center <strong>for</strong> Health Statistics (U.S.) IV.<br />
Series. V. Series: Vital <strong>and</strong> health statistics. Series 21,<br />
Data from the national vital statistics system ; no. 55.<br />
HA211.A3 no. 55 RG698.U6<br />
304.6'3'0973021 s—dc21<br />
[304.6'3'0973] 96-50049<br />
CIP<br />
For sale by the U.S. Government Printing Office<br />
Superintendent of Documents<br />
Mail Stop: SSOP<br />
Washington, DC 20402-9328<br />
Printed on acid-free paper
Vital <strong>and</strong><br />
Health Statistics<br />
<strong>Triplet</strong> Births:<br />
Trends <strong>and</strong><br />
Outcomes, 1971–94<br />
Series 21:<br />
Data From the<br />
National Vital Statistics System<br />
No. 55<br />
U.S. DEPARTMENT OF HEALTH AND HUMAN SERVICES<br />
Public Health Service<br />
<strong>Centers</strong> <strong>for</strong> <strong>Disease</strong> <strong>Control</strong> <strong>and</strong> <strong>Prevention</strong><br />
National Center <strong>for</strong> Health Statistics<br />
Hyattsville, Maryl<strong>and</strong><br />
January 1997<br />
DHHS Publication No. (PHS) 97-1933
National Center <strong>for</strong> Health Statistics<br />
Edward J. Sondik, Ph.D., Director<br />
Jack R. Anderson, Deputy Director<br />
Jack R. Anderson, Acting Associate Director <strong>for</strong><br />
International Statistics<br />
Lester R. Curtin, Ph.D., Acting Associate Director <strong>for</strong><br />
Research <strong>and</strong> Methodology<br />
Jacob J. Feldman, Ph.D., Associate Director <strong>for</strong> Analysis,<br />
Epidemiology, <strong>and</strong> Health Promotion<br />
Gail F. Fisher, Ph.D., Associate Director <strong>for</strong> Data St<strong>and</strong>ards,<br />
Program Development, <strong>and</strong> Extramural Programs<br />
Edward L. Hunter, Associate Director <strong>for</strong> Planning, Budget,<br />
<strong>and</strong> Legislation<br />
Jennifer H. Madans, Ph.D., Acting Associate Director <strong>for</strong><br />
Vital <strong>and</strong> Health Statistics Systems<br />
Stephen E. Nieberding, Associate Director <strong>for</strong><br />
Management<br />
Charles J. Rothwell, Associate Director <strong>for</strong> Data<br />
Processing <strong>and</strong> Services<br />
Division of Vital Statistics<br />
Mary Anne Freedman, Director<br />
Stephanie J. Ventura, Acting Chief, Natality, Marriage <strong>and</strong><br />
Divorce Statistics Branch<br />
Nicholas F. Pace, Acting Chief, Systems <strong>and</strong> Programming<br />
Branch
Abstract<br />
Objectives—This report describes changes in the number<br />
<strong>and</strong> ratio of live <strong>births</strong> in triplet <strong>and</strong> other higher order<br />
multiple deliveries from 1971 to 1994 by maternal race, age,<br />
education, <strong>and</strong> marital status. The report also examines the<br />
birth outcomes of triplets compared with singletons, including<br />
overall gestation specific, <strong>and</strong> birthweight specific infant mortality<br />
rates.<br />
Methods—Birth data are obtained from the U.S. certificates<br />
of live birth. Mortality data were obtained from the<br />
Linked Birth <strong>and</strong> Infant Death Data Sets <strong>for</strong> the 1983–91 birth<br />
cohorts. Most analyses are based on triplet <strong>and</strong> other higherorder<br />
multiple <strong>births</strong> (quadruplet <strong>and</strong> quintuplet <strong>and</strong> greater<br />
<strong>births</strong>) in the aggregate. (<strong>Triplet</strong> <strong>births</strong> comprise about 92 percent<br />
of all higher order multiple <strong>births</strong>.) <strong>Triplet</strong> <strong>and</strong> other<br />
higher order birth ratios <strong>for</strong> most variables are computed by<br />
combining data <strong>for</strong> years 1982–84 <strong>and</strong> 1992–94, <strong>and</strong> <strong>for</strong> infant<br />
mortality by combining birth cohorts <strong>for</strong> years 1987–91.<br />
Findings—Between 1971 <strong>and</strong> 1994 the number <strong>and</strong> ratio<br />
of triplet <strong>births</strong> quadrupled, rising from 1,034 to 4,594, <strong>and</strong><br />
from 29.1 to 116.2 per 100,000 live <strong>births</strong>. Most of the<br />
increase was among <strong>births</strong> to white mothers, particularly<br />
among married <strong>and</strong> more educated mothers. Only about<br />
one-third of the increase in triplet birthing among white<br />
mothers between 1989 <strong>and</strong> 1994 could be attributed to changes<br />
in the maternal age distribution. Massachusetts reported the<br />
highest triplet birth ratio (215.9), more than twice the U.S.<br />
ratio (105.5). Other States with comparatively high ratios were<br />
New Hampshire, New Jersey, <strong>and</strong> Iowa. Nine of 10 triplets<br />
were born preterm compared with 1 of 10 singletons. The<br />
average triplet weighed 1,698 grams at birth, one-half that of<br />
the average singleton (3,358 grams). <strong>Triplet</strong>s were about 12<br />
times more likely to die during the first year of life as<br />
singletons, but had a survival advantage over singletons at<br />
lower gestations <strong>and</strong> birthweights.<br />
Keywords: triplet <strong>births</strong> v higher order multiple <strong>births</strong> v birth<br />
certificate v triplet infant health v triplet infant mortality<br />
iii
Contents<br />
Abstract. .............................................................................................. iii<br />
Highlights ............................................................................................. 1<br />
Introduction. ........................................................................................... 2<br />
Methods. .............................................................................................. 3<br />
Results. ............................................................................................... 5<br />
Trends in triplet <strong>births</strong> ................................................................................. 5<br />
Maternal race <strong>and</strong> ethnicity ........................................................................... 5<br />
The effect of the changing maternal age distribution. ...................................................... 5<br />
Age-specific birth ratios.............................................................................. 6<br />
Maternal educational attainment <strong>and</strong> marital status ........................................................ 6<br />
Mothers’ State of residence ........................................................................... 7<br />
Birth outcomes ...................................................................................... 7<br />
Period of gestation <strong>and</strong> birthweight .................................................................... 7<br />
Trends in infant mortality ............................................................................ 7<br />
Infant mortality by gestation <strong>and</strong> birthweight ............................................................ 8<br />
Five leading causes of infant death..................................................................... 8<br />
Discussion ............................................................................................. 9<br />
References ............................................................................................. 11<br />
List of detailed tables .................................................................................... 12<br />
Text tables<br />
A. Numbers of triplet, quadruplet, <strong>and</strong> quintuplet <strong>and</strong> other higher order multiple <strong>births</strong>: United States, 1989–94 ....... 3<br />
B. Mean birthweight <strong>for</strong> triplet <strong>and</strong> other higher order multiple <strong>births</strong> <strong>and</strong> singleton <strong>births</strong> by length of gestation:<br />
United States, 1992–94 total.......................................................................... 7<br />
Figures<br />
1. Observed <strong>and</strong> age-adjusted birth ratios <strong>for</strong> triplet <strong>and</strong> other higher order multiple <strong>births</strong> by race of mother,<br />
1980–94 ......................................................................................... 5<br />
2. <strong>Triplet</strong> <strong>and</strong> other higher order multiple birth ratios by age of mother, 1972–74, 1982–84, <strong>and</strong> 1992–94 ............ 6<br />
3. <strong>Triplet</strong> <strong>and</strong> other higher order multiple birth ratios <strong>for</strong> married mothers 30–39 years of age by education, 1982–84<br />
<strong>and</strong> 1992–94 ...................................................................................... 6<br />
4. Birthweight distributions <strong>for</strong> triplet <strong>and</strong> other higher order multiple <strong>births</strong> <strong>and</strong> singleton <strong>births</strong>, 1992–94. ........... 7<br />
v
<strong>Triplet</strong> Births: Trends <strong>and</strong><br />
Outcomes, 1971–94<br />
by Joyce A. Martin M.P.H; Marian F. MacDorman Ph.D.;<br />
<strong>and</strong> T. J. Mathews, M.S., Division of Vital Statistics<br />
Highlights<br />
The number of live <strong>births</strong> in triplet <strong>and</strong> other higher order<br />
multiple deliveries tripled between 1980 (1,337) <strong>and</strong> 1994<br />
(4,594) <strong>and</strong> quadrupled between 1971 (1,034) <strong>and</strong> 1994. Over<br />
the last decade (1985–94), increases in the number of triplets<br />
averaged 11 percent a year.<br />
The triplet <strong>and</strong> other higher order birth ratio (the number<br />
of triplet <strong>and</strong> other higher order multiple <strong>births</strong> per 100,000<br />
live <strong>births</strong>) rose 214 percent between 1980 <strong>and</strong> 1994, from<br />
37.0 to 116.2. Steady, sizable increases averaging 12 percent a<br />
year were reported <strong>for</strong> 1987–94.<br />
The overall rise in the triplet <strong>and</strong> other higher order<br />
multiple birth ratio (or triplet birth ratio) can be attributed<br />
almost exclusively to the rise in triplet <strong>births</strong> to white mothers,<br />
among whom the ratio rose 252 percent (from 37.6 to 132.2)<br />
between 1980 <strong>and</strong> 1994.<br />
About one-third of the increase in the triplet birth ratio<br />
among white mothers can be explained by changes in the<br />
maternal age distribution. The likely explanation <strong>for</strong> the<br />
remaining two-thirds of the increase is the rise in the use of<br />
fertility-enhancing drugs <strong>and</strong> techniques.<br />
Among black mothers, the triplet birth ratio rose by a<br />
more modest 52 percent (from 37.1 to 56.3). Most of the<br />
increase among black mothers is fairly recent, occurring since<br />
the mid- to late-1980’s.<br />
Massachusetts reported the highest triplet birth ratio <strong>for</strong><br />
1992–94, 215.9, more than twice as high as that of the Nation<br />
as a whole. Ratios were also comparatively high <strong>for</strong> New<br />
Hampshire, New Jersey, <strong>and</strong> Iowa.<br />
<strong>Triplet</strong> <strong>births</strong> are at much greater risk than singletons of<br />
poor birth outcome. More than 9 of 10 triplet <strong>births</strong> were born<br />
preterm (less than 37 competed weeks of gestation) compared<br />
with fewer than 1 of 10 singleton infants. The average weight<br />
of a triplet newborn (3 pounds 12 ounces or 1,698 grams) was<br />
one-half that of a singleton newborn (7 pounds 6 ounces or<br />
3,358 grams). The infant death rate <strong>for</strong> triplet <strong>and</strong> other higher<br />
order multiple <strong>births</strong> was 12 times higher than that <strong>for</strong><br />
singletons (93.7 compared with 7.8 infant deaths per 1,000<br />
live <strong>births</strong>), but triplets generally held a survival advantage<br />
over singletons at lower birthweights <strong>and</strong> shorter gestations.<br />
1
Introduction<br />
This report describes changes in the number <strong>and</strong> ratio of<br />
live <strong>births</strong> in triplet <strong>and</strong> other higher order multiple deliveries<br />
between 1971 <strong>and</strong> 1994 by maternal race, age, education, <strong>and</strong><br />
marital status. The report also examines the birth outcomes<br />
<strong>and</strong> infant mortality of newborn triplets compared with newborn<br />
singletons.<br />
National in<strong>for</strong>mation on the plurality of <strong>births</strong> based on<br />
data derived from birth certificates has been published annually<br />
by the National Center <strong>for</strong> Health Statistics (NCHS) since<br />
1917. (Excepted are data years 1969 <strong>and</strong> 1970 <strong>for</strong> which<br />
plurality data are not available.) NCHS also has published<br />
additional, more detailed reports on the subject (1,2). These<br />
This report was prepared in the Division of Vital Statistics (DVS). The<br />
authors gratefully acknowledge the assistance of Selma M. Taffel who is as<br />
generous as ever with her time <strong>and</strong> insight. We would also like to thank<br />
Robert L. Heuser, Chief (retired), Stephanie J. Ventura, Acting Chief of the<br />
Natality, Marriage, <strong>and</strong> Divorce Statistics Branch, DVS, <strong>and</strong> John L. Kiely,<br />
Chief, Infant <strong>and</strong> Child Health Studies, Division of Health <strong>and</strong> Utilization<br />
Analysis <strong>for</strong> their helpful comments. This report was edited by Thelma W.<br />
S<strong>and</strong>ers <strong>and</strong> typeset by Jacqueline M. Davis of the Publications Branch,<br />
Division of Data Services.<br />
2<br />
reports focused on <strong>births</strong> in twin deliveries as opposed to<br />
<strong>births</strong> in triplet <strong>and</strong> other higher multiple deliveries (from now<br />
on referred to as ‘‘triplet <strong>births</strong>’’ or ‘‘triplets’’) because twin<br />
<strong>births</strong> comprise the vast majority of multiples, <strong>and</strong> because of<br />
the small number of triplet <strong>births</strong> at the time these reports were<br />
written. However, the recent, rapid rise in the number <strong>and</strong> ratio<br />
of triplet <strong>births</strong>, has heightened the interest in, <strong>and</strong> the<br />
feasibility of studying triplets independently.<br />
Although data are available <strong>for</strong> selected years, NCHS has<br />
not published recent annual infant mortality rates by plurality<br />
from the linked birth <strong>and</strong> death data sets. Two early NCHS<br />
studies did, however, present rates <strong>for</strong> singleton <strong>and</strong> plural<br />
<strong>births</strong> based on the 1950 <strong>and</strong> 1960 birth cohorts (3,4).<br />
The general literature includes a number of recent reports<br />
(published since 1990) on multiple <strong>births</strong> based on national<br />
vital records (5–14); only one of these reports focuses exclusively<br />
on triplets (9). This is the first NCHS report to focus on<br />
triplet <strong>births</strong>.
Methods<br />
Birth data <strong>for</strong> this analysis were obtained from birth<br />
certificates from all States <strong>and</strong> the District of Columbia <strong>for</strong><br />
1985–94. The data are provided to NCHS through the Vital<br />
Statistics Cooperative Program (VSCP). From 1972 to 1984<br />
the VSCP included varying numbers of States that provided<br />
data based on 100 percent of their birth certificates. Data <strong>for</strong><br />
States not in the VSCP were based on a 50-percent sample of<br />
birth certificates filed in those States. For 1971 data were<br />
based on a 20- to 50-percent sample of <strong>births</strong>. The data sets<br />
include <strong>births</strong> of U.S. residents occurring in the United States,<br />
but excludes <strong>births</strong> <strong>and</strong> deaths of U.S. residents occurring<br />
outside the United States.<br />
Mortality data were obtained from the Linked Birth <strong>and</strong><br />
Infant Death Data Sets <strong>for</strong> the 1983–91 birth cohorts. In<br />
these data sets, the death certificate is linked with the corresponding<br />
birth certificate <strong>for</strong> each infant who dies in the<br />
United States. For example, the 1991 birth cohort file includes<br />
infants born in 1991 who died in 1991 or 1992. The linked file<br />
is constructed as a cohort file, with a one-to-one match of birth<br />
<strong>and</strong> death records from the NCHS annual Natality <strong>and</strong> Mortality<br />
Vital Statistics Files (15). For more detailed in<strong>for</strong>mation see<br />
Public Use Tape Documentation: Linked Birth/Infant Death<br />
Data Set (16).<br />
The practice of matching live birth <strong>and</strong> fetal death records,<br />
which made it possible to determine the number of sets of<br />
multiple <strong>births</strong>, was discontinued on the national level beginning<br />
with data year 1959. This report, there<strong>for</strong>e, refers only to<br />
individual live <strong>births</strong> or deaths in triplet <strong>and</strong> other higher order<br />
multiple birth deliveries, NOT to sets of triplets. For example,<br />
a delivery resulting in two live <strong>births</strong> <strong>and</strong> one stillbirth would<br />
be reported as two live <strong>births</strong> in a triplet delivery, or two triplet<br />
<strong>births</strong>. Thus, the number of triplet sets cannot be derived from<br />
these data.<br />
For much of the period covered by this report (1978–88)<br />
triplet <strong>births</strong> were not differentiated from quadruplet <strong>and</strong><br />
quintuplet <strong>and</strong> higher order multiple <strong>births</strong> in the coding<br />
process <strong>for</strong> the birth or linked birth-infant death data sets.<br />
Thus, most analyses in this report are based on triplet <strong>and</strong><br />
other higher order multiple <strong>births</strong> in the aggregate. <strong>Triplet</strong><br />
<strong>births</strong>, however, comprise the bulk of higher order multiple<br />
<strong>births</strong> (92 percent <strong>for</strong> 1989–94). There<strong>for</strong>e, the category ‘‘triplet<br />
<strong>and</strong> other higher order multiple <strong>births</strong>’’ primarily represents<br />
triplet <strong>births</strong> (table A).<br />
The triplet birth ratio is defined as the number of triplet<br />
<strong>births</strong> per 100,000 live <strong>births</strong>. Three years of data are combined<br />
to compute triplet birth ratios <strong>for</strong> a number of variables<br />
Table A. Numbers of triplet, quadruplet, <strong>and</strong> quintuplet <strong>and</strong> other<br />
higher order multiple <strong>births</strong>: United States, 1989–94<br />
Year <strong>Triplet</strong>s Quadruplets<br />
Quintuplets<br />
<strong>and</strong> other<br />
higher order<br />
multiples<br />
<strong>Triplet</strong>s as<br />
percent of<br />
all triplet<br />
<strong>and</strong> other<br />
higher<br />
order<br />
multiple <strong>births</strong><br />
1994 .............. 4,233 315 46 92<br />
1993 .............. 3,834 277 57 92<br />
1992 .............. 3,547 310 26 91<br />
1991 .............. 3,121 203 22 93<br />
1990 .............. 2,830 185 13 93<br />
1989 .............. 2,529 229 40 90<br />
in order to generate statistically reliable rates. Data <strong>for</strong> years<br />
1982–84 are combined <strong>and</strong>, when appropriate, compared with<br />
data <strong>for</strong> years 1992–94. Similarly, more detailed infant mortality<br />
rates (defined as the number of infant deaths under 1<br />
year of age per 1,000 live <strong>births</strong>) combine data <strong>for</strong> birth<br />
cohorts 1987–91.<br />
National data <strong>for</strong> <strong>births</strong> to unmarried women are derived<br />
from two sources. For 1994 marital status is reported directly<br />
on the birth certificate of 45 States <strong>and</strong> the District of<br />
Columbia. For 1992–93 marital status is reported directly on<br />
the birth certificate of 44 States <strong>and</strong> the District of Columbia,<br />
<strong>and</strong> <strong>for</strong> 1982–84 marital status was reported directly on the<br />
birth certificates of 41 States <strong>and</strong> the District of Columbia. For<br />
the remaining States, marital status was inferred from comparison<br />
of the child’s <strong>and</strong> parent’s surnames.<br />
For 1982–84 educational attainment of the mother was<br />
not reported <strong>for</strong> three States: Cali<strong>for</strong>nia, Texas, <strong>and</strong> Washington.<br />
For 1992–94 this item was available <strong>for</strong> all 50 States <strong>and</strong><br />
the District of Columbia. <strong>Triplet</strong> birth ratios <strong>for</strong> 1992–94 by<br />
age, education, <strong>and</strong> marital status are presented <strong>for</strong> both the<br />
entire reporting area (50 States <strong>and</strong> the District of Columbia),<br />
<strong>and</strong> <strong>for</strong> a 47-State <strong>and</strong> the District of Columbia reporting area.<br />
To maintain consistent reporting areas between time periods<br />
(1982–84 <strong>and</strong> 1992–94), all analyses are based on the 47-State<br />
area.<br />
Trend data by race in this report are tabulated by race of<br />
mother <strong>for</strong> all years. References to white <strong>births</strong> <strong>and</strong> white<br />
mothers or black <strong>births</strong> <strong>and</strong> black mothers are used interchangeably.<br />
Trends <strong>and</strong> characteristics of triplet <strong>births</strong> among racial<br />
or ethnic groups other than white <strong>and</strong> black are not presented<br />
because of small numbers or, as in the case <strong>for</strong> Hispanic <strong>births</strong>,<br />
3
ecause of substantial changes in the size <strong>and</strong> composition of<br />
the reporting area over the study period. (Hispanics can be of<br />
any race.) Where the race of mother is missing from the birth<br />
record, it is imputed according to the race of the mother of the<br />
previous record with known race (17).<br />
The effects of changes in the maternal age distribution on<br />
triplet birth ratios <strong>for</strong> 1980–94 are eliminated using direct<br />
st<strong>and</strong>ardization. The 1980 distribution of <strong>births</strong> by age of<br />
4<br />
mother is used as the st<strong>and</strong>ard population. St<strong>and</strong>ardization was<br />
per<strong>for</strong>med separately by race of mother.<br />
The period of gestation is computed from the first day of<br />
the last normal menstrual period (LMP), as reported by the<br />
mother, to the date of birth. When the LMP is not stated or is<br />
inconsistent with birthweight, the ‘‘clinical estimate of gestation’’<br />
or the birth attendants’ estimate of gestational age is<br />
used.
Results<br />
Trends in triplet <strong>births</strong><br />
There were 4,594 live <strong>births</strong> in triplet deliveries in 1994,<br />
triple the number born during the early 1980’s <strong>and</strong> more than<br />
quadruple the number of 1971 (table 1). The incidence of<br />
triplet birthing accelerated between 1971 <strong>and</strong> 1994; increases<br />
averaged about 2 percent a year <strong>for</strong> the 1970’s, 7 percent <strong>for</strong><br />
the early 1980’s, <strong>and</strong> 11 percent from 1985 to 1989. During<br />
the first half of the 1990’s, the number of triplet <strong>births</strong><br />
continued to rise rapidly despite a decline in singleton <strong>births</strong>.<br />
As a result, there were more triplets born over this 5-year<br />
period than <strong>for</strong> the entire decade of the 1980’s.<br />
As would be expected, the triplet birth ratio also rose over<br />
this period, <strong>and</strong> at only a slightly slower pace than the number<br />
of triplet <strong>births</strong>. The 1994 ratio of 116.2 per 100,000 was twice<br />
the 1987 ratio of 56.2, <strong>and</strong> 4 times the 1971 ratio of 29.1.<br />
Steady, sizable increases averaging 12 percent a year were<br />
reported <strong>for</strong> 1987–94.<br />
Maternal race <strong>and</strong> ethnicity<br />
The steep increase in the overall triplet birth ratio can be<br />
attributed almost exclusively to the rise in triplet <strong>births</strong> among<br />
white mothers. Throughout the study period about 80 percent<br />
of all <strong>births</strong> were to white mothers. However, from 1971 to<br />
1994, the percent of triplet <strong>births</strong> to white mothers increased<br />
from 81 to 90 percent. Among white mothers, the rise in the<br />
triplet birth ratio was even more pronounced than the rise<br />
overall. The triplet ratio among white <strong>births</strong> was 132.2 <strong>for</strong><br />
1994, nearly 5 times the ratio in 1971 (28.4), <strong>and</strong> double that<br />
reported only 6 years earlier (66.0 in 1988). Between 1990 <strong>and</strong><br />
1994 alone, the ratio rose 65 percent.<br />
<strong>Triplet</strong> birth ratios <strong>for</strong> black <strong>and</strong> white mothers were quite<br />
similar during the 1970’s <strong>and</strong> early 1980’s, but ratios <strong>for</strong><br />
subsequent years diverged sharply. Ratios <strong>for</strong> black triplet<br />
<strong>births</strong> fluctuated during the 1970’s <strong>and</strong> 1980’s, but rose by<br />
52 percent between 1980 <strong>and</strong> 1994, from 37.1 to 56.3 (compared<br />
with a 252 percent increase in white triplet <strong>births</strong>, from<br />
37.6 to 132.2). Growth in the ratio among black mothers<br />
appears to be increasing <strong>for</strong> the most recent years; between<br />
1990 <strong>and</strong> 1994 ratios increased 20 percent, rising from 46.9 to<br />
56.3 per 100,000.<br />
More recent triplet birth ratios among white mothers<br />
undoubtably would be even higher if not <strong>for</strong> the increasing<br />
influence of <strong>births</strong> of Hispanic origin. Although reliable ratios<br />
are not available <strong>for</strong> much of the study period, triplet <strong>births</strong><br />
appear to be much rarer among white Hispanic mothers than<br />
among non-Hispanic white mothers. For 1994 the non-<br />
Hispanic white triplet birth ratio was 152.6, 3 times as high as<br />
the ratio among white Hispanic mothers of 52.3, <strong>and</strong> 15 percent<br />
higher than the ratio including Hispanic mothers (132.2).<br />
The effect of the changing maternal age distribution<br />
The proportion of mothers aged 30 years <strong>and</strong> over who<br />
gave birth in 1994 was much higher than in 1980 (34<br />
compared with 20 percent); the result of delayed childbearing<br />
<strong>and</strong> an aging female population. This upward shift in the<br />
maternal age distribution would be expected to have a positive<br />
influence on triplet birth ratios because the risk of multiple<br />
birth increases with maternal age until about the age of 40<br />
(18). (This is believed to occur as a result of the heightened<br />
levels of gonadotropin hormones of older mothers (18).) A<br />
second factor widely recognized to have a positive effect on<br />
the triplet birth ratio is fertility-enhancing therapies such as<br />
ovulation-enhancing drugs <strong>and</strong> assisted reproductive techniques<br />
(<strong>for</strong> example, in vitro fertilizations) (19). These therapies,<br />
which are more likely to result in triplet <strong>births</strong> <strong>and</strong> are<br />
more commonly used by older white women, became more<br />
widespread during the 1980’s (20).<br />
Direct st<strong>and</strong>ardization was used to separate the effect of<br />
the older maternal age distribution from that of other potential<br />
influences on triplet birth ratios between 1980 <strong>and</strong> 1994.<br />
Figure 1 represents the observed <strong>and</strong> age-adjusted triplet birth<br />
Per 100,000 live <strong>births</strong><br />
135<br />
100<br />
50<br />
White<br />
Black Observed<br />
30<br />
1980 1985 1990 1994<br />
Year<br />
Observed<br />
Adjusted<br />
Adjusted<br />
Figure 1. Observed <strong>and</strong> age-adjusted birth ratios <strong>for</strong> triplet <strong>and</strong><br />
other higher order multiple <strong>births</strong> by race of mother, 1980–94<br />
5
atios by maternal race from 1980 to 1994. After st<strong>and</strong>ardization<br />
<strong>for</strong> maternal age, the triplet birth ratio <strong>for</strong> white <strong>births</strong> in<br />
1994 was 102.1 (compared with the observed or unadjusted<br />
ratio of 132.2). That is, given a maternal age distribution <strong>for</strong><br />
1994 similar to that of 1980, the triplet birth ratio would be<br />
about one-fourth lower than the actual ratio or, put another<br />
way, the changing maternal age distribution explains about<br />
one-third of the increase in triplet birth ratios among white<br />
mothers from 1980 to 1994.<br />
The adjustment reveals that the changing age distribution<br />
had a slightly greater impact on triplet birth ratios among<br />
black mothers. St<strong>and</strong>ardization resulted in an age-adjusted<br />
level of 49.1, compared with the observed ratio of 56.3,<br />
indicating that about two-fifths of the increase in the black<br />
<strong>births</strong> can be attributed to this cause.<br />
Age-specific birth ratios<br />
Sharp rises in age-specific triplet birth ratios among older<br />
mothers over the study period also suggest the influence of<br />
factors other than a shifting maternal age distribution on<br />
overall triplet birth ratios (table 2 <strong>and</strong> figure 2). Between<br />
1982–84 <strong>and</strong> 1992–94 triplet birth ratios increased <strong>for</strong> each<br />
age group, but increases were the most pronounced among<br />
mothers 30 years of age <strong>and</strong> over. <strong>Triplet</strong> birth ratios more<br />
than tripled <strong>for</strong> mothers 35–39 years of age, rising from 67.8<br />
to 216.1 <strong>and</strong> nearly tripled <strong>for</strong> mothers 30–34 years of age,<br />
rising from 68.6 to 193.6. Comparatively, the triplet birth ratio<br />
<strong>for</strong> mothers 25–29 years of age doubled, <strong>and</strong> that <strong>for</strong> mothers<br />
aged 20–24 years rose by only 17 percent.<br />
The number of triplet <strong>births</strong> born to women in their <strong>for</strong>ties<br />
between 1982 <strong>and</strong> 1984 was too small (only 15) to allow <strong>for</strong><br />
the computation of stable ratios <strong>and</strong> <strong>for</strong> comparison of these<br />
ratios with those <strong>for</strong> 1992–94. However, it should be noted<br />
that there has been a large increase in the number of triplet<br />
<strong>births</strong> to women in this age group, <strong>and</strong> this increase is far in<br />
excess of the rise in singleton <strong>births</strong>. For 1992–94 the number<br />
of triplet <strong>births</strong> to mothers 40–49 years of age (379 <strong>births</strong>) was<br />
25 times as high as the number born to their counterparts in<br />
Per 100,000 live <strong>births</strong><br />
250<br />
200<br />
150<br />
100<br />
50<br />
1972 74 1982 84 1992 94<br />
0<br />
Under 20 20 24 25 29 30 34 35 39 40 44<br />
Years of age<br />
Figure 2. <strong>Triplet</strong> <strong>and</strong> other higher order multiple birth ratios by<br />
age of mother, 1972–74, 1982–84, <strong>and</strong> 1992–94<br />
6<br />
1982–84 (15 <strong>births</strong>). In contrast, the number of singleton<br />
<strong>births</strong> to mothers in this age group was 2.3 times as high.<br />
Among white mothers, a similar, albeit stronger rise in<br />
age-specific ratios among mothers 30 years of age <strong>and</strong> over<br />
was observed. Increases <strong>for</strong> all age groups were substantially<br />
less pronounced among black mothers. The largest increases<br />
among black mothers were, however, also among older mothers<br />
35–39 years of age.<br />
Maternal educational attainment <strong>and</strong> marital status<br />
Increases in triplet birth ratios between 1982–84 <strong>and</strong><br />
1992–94 were most pronounced among married, collegeeducated<br />
mothers 30 years of age <strong>and</strong> over. (Table 3 includes<br />
triplet birth ratios by race, age, education, <strong>and</strong> marital status<br />
<strong>for</strong> 1992–94 <strong>for</strong> two reporting areas, one <strong>for</strong> the entire United<br />
States, <strong>and</strong> the other <strong>for</strong> the 47-State reporting area <strong>for</strong> which<br />
comparable data are available <strong>for</strong> 1982–84 <strong>and</strong> 1992–94. All<br />
analyses in the report are based on ratios derived from the<br />
47-State reporting area, see Sources <strong>and</strong> methods.) Among all<br />
married women, there was a more than threefold rise in the<br />
birth ratio (from 47.9 to 151.4) in contrast with only a<br />
14 percent rise in the ratio among unmarried mothers (from<br />
32.5 to 37.1). Ratios <strong>for</strong> married mothers in their twenties<br />
doubled, while levels among mothers in their thirties more<br />
than tripled.<br />
Increases were observed in triplet birth ratios between<br />
1982–84 <strong>and</strong> 1992–94 across all educational levels, but the<br />
largest were found among women with more education. Again,<br />
increases were largely restricted to married mothers. Over this<br />
time period, triplet birth ratios increased 67 percent among<br />
married mothers with less than a high school education,<br />
173 percent <strong>for</strong> mothers with at least 12 years of school, <strong>and</strong><br />
224 percent <strong>for</strong> college-educated mothers (at least 16 years of<br />
education). Increases <strong>for</strong> each educational level were most<br />
elevated <strong>for</strong> mothers aged 30–39 years (figure 3). Ratios more<br />
than tripled among married mothers in their thirties in each<br />
educational category except <strong>for</strong> those with less than a high school<br />
education that rose by a comparatively modest 72 percent.<br />
Per 100,000 live <strong>births</strong><br />
350<br />
300<br />
250<br />
200<br />
150<br />
100<br />
50<br />
1982 84 1992 94<br />
0<br />
0 11 years 12 years 13 15 16 years<br />
years or more<br />
Education<br />
NOTE: Excludes data <strong>for</strong> Cali<strong>for</strong>nia, Texas, <strong>and</strong> Washington.<br />
Figure 3. <strong>Triplet</strong> <strong>and</strong> other higher order multiple birth ratios <strong>for</strong><br />
married mothers 30–39 years of age by education, 1982–84 <strong>and</strong><br />
1992–94
Trends in triplet birth ratios by marital status <strong>and</strong> educational<br />
attainment among white mothers between 1982–84 <strong>and</strong><br />
1992–94 were similar to those noted earlier, but generally<br />
were of greater magnitude. Among black mothers, trends were<br />
generally analogous, but considerably more modest. Although<br />
rises in the triplet birth ratio overall among black unmarried<br />
mothers were greater than <strong>for</strong> white unmarried mothers, these<br />
data suggest that the largest increases among black mothers<br />
were also among those who were older, married, <strong>and</strong> more<br />
educated.<br />
Mothers’ State of residence<br />
Massachusetts reported the highest triplet birth ratio <strong>for</strong><br />
combined years 1992–94 (215.9) more than twice as high as<br />
that of the Nation as a whole (105.5) (table 4). The Massachusetts<br />
ratio was substantially higher than that of any other State<br />
<strong>for</strong> both 1993 <strong>and</strong> 1994, <strong>and</strong> was the third highest <strong>for</strong> 1992.<br />
Other States reporting ratios at least 50 percent higher than the<br />
United States <strong>for</strong> 1992–94 were New Hampshire, New Jersey,<br />
<strong>and</strong> Iowa. These States also tended to have higher proportions<br />
of <strong>births</strong> to older mothers who are more likely to have a triplet<br />
birth, <strong>and</strong> to older, white non-Hispanic mothers who may be<br />
more likely to obtain fertility-enhancing drugs <strong>and</strong> procedures,<br />
further increasing their chances of bearing triplets (20).<br />
Birth outcomes<br />
Period of gestation <strong>and</strong> birthweight<br />
The mean or average gestational age <strong>for</strong> triplet infants<br />
was 32 completed weeks, almost 7 weeks shorter than the<br />
average <strong>for</strong> singleton <strong>births</strong> (table 5). The most common<br />
gestational age <strong>for</strong> triplets was 34–36 weeks, while that <strong>for</strong><br />
singletons was 37–41 weeks. Accordingly, most triplets<br />
(91.6 percent) were born preterm, that is, at fewer than 37<br />
completed weeks of gestation, compared with 9.8 percent of<br />
singleton infants. Moreover, 13.4 percent of triplets were born<br />
at the extremely preterm gestational age of less than 28 weeks,<br />
whereas only 0.6 percent of singletons were born at this short<br />
gestational age.<br />
The average triplet weighed 3 pounds, 12 ounces (1,698<br />
grams) at birth, one-half that of the average singleton infant (7<br />
pounds, 6 ounces or 3,358 grams) (table 6). Because preterm<br />
infants weigh less than term infants, the smaller size of triplet<br />
<strong>births</strong> can be partly explained by their shorter gestations, but<br />
large differences in birthweight between triplets <strong>and</strong> singletons<br />
persist at similar or equal gestations. At each completed week<br />
of gestation except the shortest (17 weeks), the average<br />
birthweight <strong>for</strong> triplets was lower than that of singletons (data<br />
not shown). The greatest absolute <strong>and</strong> relative disparities in<br />
triplet <strong>and</strong> singleton birthweight, however, were <strong>for</strong> term <strong>and</strong><br />
postterm <strong>births</strong> (those born at 37–41 weeks <strong>and</strong> at 42 <strong>and</strong> more<br />
weeks of gestation). In illustration, the average birthweight <strong>for</strong><br />
triplet term <strong>births</strong> was 1,202 grams less or 35 percent lower<br />
than that <strong>for</strong> singleton <strong>births</strong> (2,224 grams compared with<br />
3,426 grams, table B).<br />
Table B. Mean birthweight <strong>for</strong> triplet <strong>and</strong> other higher order<br />
multiple <strong>births</strong> <strong>and</strong> singleton <strong>births</strong> by length of gestation:<br />
United States, 1992–94 total<br />
Period of gestation 1 <strong>Triplet</strong> 2 Singleton<br />
Overall, 92.1 percent of triplets born between 1992 <strong>and</strong><br />
1994 were low birthweight (less than 2,500 grams); <strong>and</strong><br />
35.0 percent were very low birthweight (less than 1,500<br />
grams) (figure 4). The respective proportions <strong>for</strong> singleton<br />
infants were 6.0 <strong>and</strong> 1.1 percent. At no gestational age was the<br />
average triplet birthweight greater than 2,499 grams. Most<br />
triplets, 86.0 percent, are born both low birthweight <strong>and</strong><br />
preterm; only 6.2 percent were term low-birthweight infants<br />
(data not shown).<br />
<strong>Triplet</strong>s born to black mothers (unlike singleton <strong>births</strong> to<br />
black mothers) were slightly less likely than triplets born to<br />
white mothers to be preterm (88.2 compared with 91.1 percent),<br />
but were nearly twice as likely to be born at less than 28<br />
weeks (22.4 compared with 12.7 percent). <strong>Triplet</strong>s born to<br />
black mothers were slightly smaller on average than those<br />
born to white mothers (1,537 compared with 1,712 grams) <strong>and</strong><br />
were more likely to be very low birthweight; nearly one-half<br />
of all black triplets (45.4 percent) weighed less than 1,500<br />
grams compared with 34.1 percent of white triplets (tables 5<br />
<strong>and</strong> 6).<br />
Percent<br />
40<br />
30<br />
20<br />
10<br />
0<br />
Less<br />
than 500<br />
<strong>Triplet</strong>s<br />
Mean<br />
2,000<br />
2,499<br />
Grams<br />
Difference<br />
in grams<br />
Singletons<br />
Percent<br />
difference<br />
All gestations. ........ 1,698 3,358 –1,660 –49<br />
Under 28 weeks. ...... 731 961 –230 –24<br />
28–31 weeks. ........ 1,347 2,054 –707 –34<br />
32–33 weeks. ........ 1,755 2,497 –742 –30<br />
34–36 weeks. ........ 2,109 2,898 –789 –27<br />
37–41 weeks. ........ 2,224 3,426 –1,202 –35<br />
42 weeks or more. ..... 2,203 3,525 –1,322 –38<br />
1 Completed weeks of gestation.<br />
2 Includes <strong>births</strong> in quadruplet, <strong>and</strong> quintuplet <strong>and</strong> other higher order multiple deliveries.<br />
4,000<br />
or more<br />
Figure 4. Birthweight distributions <strong>for</strong> triplet <strong>and</strong> other higher<br />
order multiple <strong>births</strong> <strong>and</strong> singleton <strong>births</strong>, 1992–94<br />
7
Trends in infant mortality<br />
From 1983 to 1991 infant mortality rates <strong>for</strong> triplet <strong>births</strong><br />
declined by 40 percent, from 156.1 infant deaths per 1,000 live<br />
<strong>births</strong> to 93.7 <strong>for</strong> 1991 (table 7). This decrease was greater<br />
than the 28 percent decrease among singletons (from 10.9 in<br />
1983 to 7.8 in 1991). Infant mortality rates <strong>for</strong> triplet <strong>births</strong> to<br />
white mothers declined more rapidly <strong>and</strong> were generally<br />
substantially lower than those <strong>for</strong> triplet <strong>births</strong> to black<br />
mothers, although small numbers of black infant deaths have<br />
led to large fluctuations in infant mortality rates <strong>for</strong> this group.<br />
Infant mortality by gestation <strong>and</strong> birthweight<br />
In recent years triplet infants have been about 12 times<br />
more likely to die during the first year of life as singleton<br />
infants. Much of the difference in mortality can be explained<br />
by triplets’ considerably shorter gestations <strong>and</strong> lower birthweights<br />
(see section on Period of gestation <strong>and</strong> birthweight).<br />
For combined years 1987–91, birthweight-specific mortality<br />
rates through 2,500 grams <strong>for</strong> triplets were comparable to, or<br />
were more favorable than those <strong>for</strong> singletons (table 8). Below<br />
birthweights of 1,000 grams, mortality rates were similar <strong>for</strong><br />
triplets <strong>and</strong> singletons, but at 1,000–2,499 grams, triplets held<br />
a distinct survival advantage. For example, at birthweights of<br />
1,500–1,999 grams, the triplet infant mortality rate was 15.2<br />
per 1,000 compared with a singleton rate of 50.4.<br />
Among all triplet <strong>births</strong>, mortality was lowest at birthweights<br />
of 2,000–2,499 grams, whereas among singletons, the<br />
most favorable mortality rate was <strong>for</strong> heavier babies with<br />
birthweights of at least 2,500 grams. (Although considered<br />
unreliable because it is based on only 15 deaths, the rate <strong>for</strong><br />
triplets with birthweights of 2,500 grams or more (11.4) is<br />
higher than that <strong>for</strong> triplets born at 2,000–2,499 grams (7.3),<br />
<strong>and</strong> <strong>for</strong> singletons born at 2,500 grams or more (3.7)).<br />
<strong>Triplet</strong> mortality rates by gestation follow a pattern not<br />
unlike that of birthweight (table 9). For gestations of less than<br />
28 weeks, the infant mortality rate was higher among triplets<br />
than <strong>for</strong> singletons (628.8 compared with 402.1 per 1,000), but<br />
<strong>for</strong> longer gestations of up to 36 weeks, triplet mortality rates<br />
were similar to, or more favorable than those <strong>for</strong> singletons.<br />
For instance, at 32–33 weeks, the triplet mortality rate of 17.9<br />
was 33 percent lower than the singleton rate (26.8). Conversely,<br />
triplet <strong>births</strong> born at term were at greater risk of<br />
mortality than singleton term <strong>births</strong> (21.5 compared with 4.0).<br />
8<br />
Whereas, among singleton <strong>births</strong> infant mortality rates<br />
decline steadily with increasing gestation, mortality rates<br />
among triplets decline to 34–36 weeks, but rise <strong>for</strong> <strong>births</strong> born<br />
at term. As a result, <strong>for</strong> triplet <strong>births</strong> overall, the lowest<br />
mortality was among moderately preterm <strong>births</strong> of 34–36<br />
weeks of gestation, whereas singleton mortality was most<br />
favorable among term <strong>births</strong>.<br />
Five leading causes of infant death<br />
The five leading causes of infant death were the same <strong>for</strong><br />
triplets as <strong>for</strong> singletons, but the order of the causes was very<br />
different (table 10). The leading cause of death <strong>for</strong> triplets was<br />
Newborn affected by maternal complications of pregnancy<br />
(maternal complications), followed by Respiratory distress<br />
syndrome (RDS), Disorders relating to short gestation <strong>and</strong><br />
unspecified low birthweight (short gestation <strong>and</strong> low birthweight),<br />
Congenital anomalies, <strong>and</strong> Sudden infant death syndrome<br />
(SIDS). For singletons, the leading cause of death was<br />
Congenital anomalies, followed by SIDS, short gestation <strong>and</strong><br />
low birthweight, RDS, <strong>and</strong> maternal complications. Of the<br />
triplet records coded to maternal complications as a cause of<br />
death, the majority of these deaths (89 percent in 1991) were<br />
coded to subcategory 761.5—Multiple pregnancy. Cause-ofdeath<br />
coding rules require that maternal complications such as<br />
Multiple pregnancy be selected in preference to short gestation<br />
<strong>and</strong> low birthweight as the underlying cause of death, even if<br />
the physician had listed short gestation <strong>and</strong> low birthweight as<br />
the underlying cause (21). All triplet records coded to multiple<br />
pregnancy in 1991 also contained multiple cause-of-death<br />
codes <strong>for</strong> short gestation <strong>and</strong> low birthweight. If these records<br />
were recoded to short gestation <strong>and</strong> low birthweight, as has<br />
been done in other studies of multiple deliveries (6), short<br />
gestation <strong>and</strong> low birthweight would have been the leading<br />
cause of death <strong>for</strong> triplets.<br />
In general, infant mortality rates <strong>for</strong> causes of death that<br />
are strongly associated with low birthweight are much higher<br />
among triplets than among singletons. In 1991 at least 97 percent<br />
of the deaths from maternal complications, RDS, <strong>and</strong><br />
short gestation <strong>and</strong> low birthweight (the three leading causes<br />
of infant death <strong>for</strong> triplet <strong>and</strong> higher order <strong>births</strong>) were to lowbirthweight<br />
infants (data not shown).
Discussion<br />
The triplet birth ratio rose 214 percent over the 15-year<br />
period 1980 to 1994. Among white mothers, the ratio rose<br />
252 percent <strong>and</strong> among black mothers, 52 percent. In comparison,<br />
the twin birth ratio rose only 30 percent over this period.<br />
Most of the remarkable rise in the overall triplet birth ratio can<br />
be attributed to increases in triplet <strong>births</strong> to white mothers who<br />
accounted <strong>for</strong> 87 percent of all triplet <strong>births</strong>.<br />
About one-third of the increase in the white triplet birth<br />
ratio can be explained by the change in maternal age at<br />
childbearing. The likely explanation <strong>for</strong> the remaining twothirds<br />
of the increase is the rise in the use of fertilityenhancing<br />
drugs <strong>and</strong> techniques (ovulation-enhancing drugs<br />
<strong>and</strong> assisted reproductive techniques such as in vitro fertilization),<br />
which are more likely to result in triplet <strong>births</strong> (20 <strong>and</strong><br />
22–24) <strong>and</strong> are more commonly used by older white women<br />
of higher socioeconomic status, the group <strong>for</strong> which triplet<br />
birth ratios rose the most (20). A recent study estimates that<br />
about 30 percent of the increase in triplet <strong>births</strong> from the early<br />
1970’s to the early 1990’s can be attributed to the older<br />
maternal age distribution (a proportion similar to that reported<br />
here), 38 percent to artificial reproductive techniques, <strong>and</strong> the<br />
remaining one-third may be associated with the use of fertilityenhancing<br />
drugs (19). Others have estimated that 59–80 percent<br />
of the increase in triplet <strong>births</strong> are the result of these therapies<br />
(25,26).<br />
Although at a much slower pace, triplet birthing among<br />
black mothers is also on the rise. This study suggests that<br />
much of this increase also is the result of factors other than a<br />
changing maternal age distribution such as fertility-enhancing<br />
therapies. This contrasts with the results of an earlier study<br />
that attributed the growth in the triplet birth ratio among black<br />
mothers from 1972 to 1989 to an older maternal age distribution<br />
(9). This discrepancy is most likely the result of the<br />
different time periods studied. Indeed, we found that most of<br />
the increase among black mothers is fairly recent, occurring<br />
since the mid- to late-1980’s. When 3-year average triplet<br />
birth ratios are used, the triplet birth ratio increased 8 percent<br />
between 1980–82 <strong>and</strong> 1986–88, <strong>and</strong> 34 percent between<br />
1986–88 <strong>and</strong> 1992–94.<br />
The steep rise in triplet <strong>births</strong> (whether the result of<br />
fertility-enhancing techniques) is of concern because of their<br />
high likelihood of permanent disability or early death. (Extensive<br />
pregnancy-related morbidity among mothers of triplets<br />
has been reported elsewhere (27).) This study confirms that<br />
triplet <strong>births</strong> are at greater risk than singletons of poor birth<br />
outcomes, <strong>and</strong> that much of this excess risk results from<br />
triplets’ shorter gestations <strong>and</strong> lower birthweights. The vast<br />
majority (92.1 percent) weigh less than 2,500 grams at birth,<br />
<strong>and</strong> more than one-third less than 1,500 grams; most are born<br />
preterm (91.1 percent), <strong>and</strong> 13 percent were born at the very<br />
abbreviated gestational length of less than 28 weeks. Associated<br />
with the high preterm rate of triplets is their increased risk<br />
of inadequate lung development <strong>and</strong> greater likelihood of<br />
morbidity (22) or infant death resulting from respiratory<br />
distress syndrome.<br />
The survival advantage which triplets appear to have with<br />
respect to singletons at most shorter gestations <strong>and</strong> lower<br />
birthweights disappears <strong>for</strong> gestations of 34 weeks <strong>and</strong> greater,<br />
<strong>and</strong> may disappear at birthweights of 2,500 grams <strong>and</strong> more.<br />
These findings suggest that intrauterine growth may stop<br />
earlier <strong>for</strong> triplets than <strong>for</strong> singletons, <strong>and</strong>, that the optimum<br />
gestational age <strong>and</strong> birthweight may be shorter <strong>and</strong> lower <strong>for</strong><br />
triplets than <strong>for</strong> singletons. Indeed, the mean birthweight <strong>for</strong><br />
triplets dropped precipitously at 39 weeks, whereas that of<br />
singletons did not begin to decline until the 42d week of<br />
gestation (data not shown). Ellster AD, et al. (26) found that<br />
the 35th week of gestation was the point at which triplet<br />
birthweight began to lag even further behind that of singletons.<br />
Similar results have been reported <strong>for</strong> twin <strong>births</strong> (24,28).<br />
Whereas data on birthweight <strong>and</strong> plurality from the birth<br />
certificate are considered reliable (29,30), the accuracy of birth<br />
certificate data on gestational age has been widely questioned<br />
(31). However, comparison of our data on the gestational age<br />
of triplets with that of a study that based its computation of<br />
gestational age on known date of conception by artificial<br />
methods, or by first trimester ultrasonography <strong>for</strong> patients who<br />
conceived spontaneously, revealed fairly similar average gestational<br />
ages (33 compared with 32.2 weeks) <strong>and</strong> rates of<br />
preterm birth (86.0 compared with 91.1 percent) (27). For<br />
1992–94, gestational age was missing from only 1.0 percent of<br />
the birth records of triplets <strong>and</strong> 0.9 percent of records of<br />
singleton <strong>births</strong>. Differences by plurality in the rate of preterm<br />
birth are too great to be substantively affected by potential<br />
differential reporting of gestational age.<br />
In general, the birthweight <strong>and</strong> gestation measures presented<br />
in this report are comparable to, but somewhat lower<br />
than those reported elsewhere (26,27,32). One reason <strong>for</strong> the<br />
slightly lower levels is that <strong>for</strong> this study data are derived from<br />
all U.S. <strong>births</strong>, whereas data <strong>for</strong> other studies (such as the one<br />
mentioned in earlier text) are often drawn from one medical<br />
center, or are otherwise based on preselected populations<br />
(26,27,32). In addition, because disaggregated data were not<br />
9
available <strong>for</strong> much of the study period, all findings <strong>for</strong> triplets<br />
in this study include quadruplet, <strong>and</strong> quintuplet <strong>and</strong> other<br />
higher order multiple <strong>births</strong> (these <strong>births</strong> accounted <strong>for</strong> 8 percent<br />
of all triplet <strong>and</strong> other higher order multiple <strong>births</strong> <strong>for</strong><br />
1994 (table A), whereas other studies generally restrict the<br />
analysis to triplet <strong>births</strong> only.) This is important because<br />
measures of birthweight <strong>and</strong> gestation that include all higherorder<br />
multiple <strong>births</strong> are slightly different than those <strong>for</strong><br />
triplets alone (that is, the percents low birthweight, very low<br />
birthweight, <strong>and</strong> preterm are higher, <strong>and</strong> mean birthweight <strong>and</strong><br />
gestational age are lower). For example, <strong>for</strong> 1992–94 the<br />
percent low birthweight <strong>for</strong> triplets excluding other higher<br />
order multiples was 91.7 <strong>and</strong> the percent preterm was 90.8,<br />
10<br />
compared with levels <strong>for</strong> all higher order multiple <strong>births</strong> of<br />
92.4 <strong>and</strong> 91.1 percent.<br />
The majority of the 37,514 triplets born between 1980 <strong>and</strong><br />
1994 were most likely the result of fertility-enhancing therapies.<br />
Despite declines in infant mortality <strong>and</strong> a survival<br />
advantage over singletons at shorter gestations <strong>and</strong> lower<br />
birthweights, about 1 of every 10 of triplet newborns died<br />
within the first year of life. Those who survived were at<br />
greater risk of perinatal complications resulting in lifelong<br />
disability. The precarious health status of triplets <strong>and</strong> their<br />
rising numbers make further research into these <strong>births</strong> of<br />
growing importance.
References<br />
1. Heuser RL. Multiple <strong>births</strong> United States - 1964. National<br />
Center <strong>for</strong> Health Statistics. Vital Health Stat 21(14). 1967.<br />
2. Taffel SM. Health <strong>and</strong> demographic characteristics of twin<br />
<strong>births</strong>: United States, 1988. National Center <strong>for</strong> Health Statistics.<br />
Vital Health Stat 21(50). 1992.<br />
3. Armstrong RJ. A study of infant mortality from linked records<br />
by birth weight, period of gestation, <strong>and</strong> other variables United<br />
States. National Center <strong>for</strong> Health Statistics. Vital Health Stat<br />
20(12). 1972.<br />
4. Chase HC. A study of infant mortality from linked records:<br />
Comparison of neonatal mortality from two cohort studies<br />
United States. U.S. Department of Health Education <strong>and</strong> Welfare.<br />
Vital <strong>and</strong> Health Stat 20(13). 1972.<br />
5. Keith LG, Papiernik E, Luke B. The costs of multiple pregnancy.<br />
Int J Gynecol Obstet 36:109–14. 1991.<br />
6. Fowler MG, Kleinman JC, Kiely JL. Double jeopardy: Twin<br />
infant mortality in the United States, 1983 <strong>and</strong> 1984. Am J<br />
Obstet Gynecol 165(1)15–22. 1991.<br />
7. Kleinman JC, Fowler MG, Kessel SS. Comparison of infant<br />
mortality among twins <strong>and</strong> singletons: United States 1960 <strong>and</strong><br />
1983. Am J of Epidemiol 133(2):133–43. 1991.<br />
8. Luke B, Keith LG. The contribution of singletons, twins <strong>and</strong><br />
triplets to low birth weight, infant mortality <strong>and</strong> h<strong>and</strong>icap in the<br />
United States. J Reprod Med 37(8):661–6. 1992.<br />
9. Kiely JL, Kleinman JC, Kiely M. <strong>Triplet</strong>s <strong>and</strong> higher-order<br />
multiple <strong>births</strong>: Time trends <strong>and</strong> infant mortality. Am J Dis<br />
Child 146:862–8. 1992.<br />
10. Luke B. The changing pattern of multiple <strong>births</strong> in the United<br />
States: Maternal <strong>and</strong> infant characteristics, 1973 <strong>and</strong> 1990.<br />
Obstet Gynecol 84(1) 101–6. 1994.<br />
11. Mushinski M. Trends in multiple <strong>births</strong>. Stat Bull 75(3):28–35.<br />
1994.<br />
12. Powers WF, Kiely JL. The risks confronting twins: A national<br />
perspective. Am J Obstet Gynecol 170(2):456–61. 1994.<br />
13. Jewell SE, Yip R. Increasing trends in plural <strong>births</strong> in the United<br />
States. Obstet Gynecol 85(2):229–32. 1995.<br />
14. Martin JA, Taffel SM. Current <strong>and</strong> future impact of rising<br />
multiple birth ratios on low birthweight. Stat Bull 76(2) 10–8.<br />
1995.<br />
15. Wilcox LS, Marks JS, eds. From data to action: CDC’s public<br />
health surveillance <strong>for</strong> women, infants, <strong>and</strong> children. Atlanta,<br />
Georgia: 231–49. <strong>Centers</strong> <strong>for</strong> <strong>Disease</strong> <strong>Control</strong> <strong>and</strong> <strong>Prevention</strong>.<br />
1994.<br />
16. National Center <strong>for</strong> Health Statistics. Public-use data tape<br />
documentation. Linked birth/death data set: 1987–1991 birth<br />
cohorts. Hyattsville, Maryl<strong>and</strong>: Public Health Service. 1992–95.<br />
17. National Center <strong>for</strong> Health Statistics. Instruction Manual Part 3a<br />
Classification <strong>and</strong> coding instructions <strong>for</strong> live birth records,<br />
1993. Vital Stat. Hyattsville, Maryl<strong>and</strong>: Public Health Service.<br />
1993.<br />
18. Dan<strong>for</strong>th DN. Dan<strong>for</strong>th’s obstetrics <strong>and</strong> gynecology. 6th ed.<br />
Philadelphia: J.B. Lippincott Co. 1990.<br />
19. Wilcox LS, Kiely JL, Melvin CL, Martin MC. Assisted reproductive<br />
technologies: Estimates of their contribution to multiple<br />
<strong>births</strong> <strong>and</strong> newborn hospital days in the United States. Fertil<br />
Steril 65(2):361–6. 1996.<br />
20. Wilcox LS, Mosher WD. Use of infertility Services in the<br />
United States. Obstet Gynecol 82 (1):122–7. 1993.<br />
21. World Health Organization. Manual of the International Statistical<br />
Classification of <strong>Disease</strong>s, Injuries, <strong>and</strong> Causes of Death,<br />
based on the recommendations of the Ninth Revision Conference,<br />
1975. Geneva: World Health Organization. 1977.<br />
22. American College of Obstetricians <strong>and</strong> Gynecologists. Multiple<br />
gestation. ACOG technical bulletin 131. Washington: American<br />
College of Obstetricians <strong>and</strong> Gynecologists. 1995.<br />
23. Bollen N, Camus M, Staessen D, et al. The incidence of<br />
multiple pregnancy after in vitro fertilization <strong>and</strong> embryo<br />
transfer, gamete, or zygote intrafallopian transfer. Fertil Steril<br />
55(2): 314–8. 1991.<br />
24. Keith LG, Papiernik E, Keith DM, Luke B, eds. Multiple<br />
Pregnancy—Epidemiology, gestation, <strong>and</strong> perinatal outcome.<br />
New York, London: Hecht, 175–90 <strong>and</strong> Powers, 163–74. The<br />
Parthenon Publishing Group. 1995.<br />
25. Callahan TL, Hall JE, Ettner Sl, et al. The economic impact of<br />
multiple gestation pregnancies <strong>and</strong> the contribution of assisted<br />
reproductive techniques to their incidence. N Engl J Med<br />
331(4): 244–9. 1994.<br />
26. Ellster AD, Bleyl JL, Craven TE. Birthweight st<strong>and</strong>ards <strong>for</strong><br />
triplets under modern obstetric care in the United States,<br />
1984–1989. Obstet Gynecol 77(3):387–93. 1991.<br />
27. Albrech JL, Tomich PG. The maternal <strong>and</strong> neonatal outcome of<br />
triplet gestations. Am J Obstet Gynecol. 174(5):1551–6. 1996.<br />
28. Luke B, Witter FR, Abbey H, et al. Gestational age-specific<br />
birthweights of twins versus singletons. Acta Genet Med Gemollol<br />
(Roma) 40:69–76. 1991.<br />
29. Buescher PA, Pinnex KV, Davis MH, Bowling JM. Quality of<br />
the new birth certificate data: a follow-back study in North<br />
Carolina. Chess Studies 68(6):1–10. 1992.<br />
30. Schoendorf KC, Parker JD, Batkhan LZ, Kiely JL. Comparability<br />
of the birth certificate <strong>and</strong> 1988 Maternal <strong>and</strong> infant health<br />
survey. National Center <strong>for</strong> Health Statistics. Vital <strong>and</strong> Health<br />
Stat. 2(116). 1993.<br />
31. Alex<strong>and</strong>er GR, Tomkins ME, Cornely, DA. Gestational age<br />
reporting <strong>and</strong> preterm delivery. Public Health Rep 105(2):<br />
267–75. 1990.<br />
32. Sassoon DA, Castro LC, Davis JL, Hobel CJ. Perinatal outcome<br />
in triplet versus twin gestations. Obstet Gynecol. 75(5): 817–20.<br />
1990.<br />
11
List of detailed tables<br />
1. Numbers <strong>and</strong> ratios of triplet <strong>and</strong> other higher order<br />
multiple <strong>births</strong>: United States, 1971–94. ............ 13<br />
2. <strong>Triplet</strong> <strong>and</strong> other higher order multiple birth ratios by age<br />
<strong>and</strong> race of mother: United States, 1972–74, 1982–84, <strong>and</strong><br />
1992–94 total ................................ 14<br />
3. <strong>Triplet</strong> <strong>and</strong> other higher order multiple birth ratios by age,<br />
education, marital status, <strong>and</strong> race of mother: Total of 47<br />
reporting States, 1982–84, total of 47 reporting States,<br />
1992–94, <strong>and</strong> United States, 1992–94 total .......... 15<br />
4. <strong>Triplet</strong> <strong>and</strong> other higher order multiple birth ratios: United<br />
States <strong>and</strong> each State, 1992–94 total ............... 17<br />
5. Number <strong>and</strong> percent distribution of triplet <strong>and</strong> other higher<br />
order multiple <strong>births</strong> <strong>and</strong> singleton <strong>births</strong> by period of<br />
gestation <strong>and</strong> race of mother: United States, 1992–94<br />
total ....................................... 17<br />
6. Number of triplet <strong>and</strong> other higher order multiple <strong>births</strong><br />
<strong>and</strong> singleton <strong>births</strong> by period of gestation <strong>and</strong> percent<br />
12<br />
distribution by birthweight according to period of gestation<br />
<strong>and</strong> race of mother: United States, 1992–94 total . . 18<br />
7. Infant mortality rates <strong>for</strong> triplet <strong>and</strong> other higher order<br />
multiple <strong>births</strong> <strong>and</strong> singleton <strong>births</strong> by race of mother:<br />
United States, 1983–91 birth cohorts ............... 19<br />
8. Infant mortality rates <strong>for</strong> triplet <strong>and</strong> other higher order<br />
multiple <strong>births</strong> <strong>and</strong> <strong>for</strong> singleton <strong>births</strong> by birthweight:<br />
United States, birth cohorts 1987–91 total ........... 20<br />
9. Infant mortality rates <strong>for</strong> triplet <strong>and</strong> other higher order<br />
multiple <strong>births</strong> <strong>and</strong> <strong>for</strong> singleton <strong>births</strong> by period of<br />
gestation: United States, birth cohorts 1987–91 total . . . 20<br />
10. Infant mortality rates <strong>for</strong> the 5 leading causes of death <strong>for</strong><br />
triplet <strong>and</strong> other higher order multiple <strong>births</strong> <strong>and</strong> singleton<br />
<strong>births</strong>: United States, birth cohorts 1987–91 total ...... 20
Table 1. Numbers <strong>and</strong> ratios of triplet <strong>and</strong> other higher order multiple <strong>births</strong>: United States 1971–94<br />
[Ratios are live <strong>births</strong> in triplet <strong>and</strong> other higher order multiple birth deliveries per 100,000 total live <strong>births</strong>]<br />
Year <strong>Triplet</strong>s 2<br />
Total 3<br />
All races 1 White Black<br />
<strong>Triplet</strong><br />
birth<br />
ratio <strong>Triplet</strong>s 2 Total 3<br />
<strong>Triplet</strong><br />
birth<br />
ratio <strong>Triplet</strong>s 2 Total 3<br />
1994 ............. 4,594 3,952,767 116.2 4,127 3,121,004 132.2 358 636,391 56.3<br />
1993 ............. 4,168 4,000,240 104.2 3,748 3,149,833 119.0 327 658,875 49.6<br />
1992 ............. 3,883 4,065,014 95.5 3,444 3,201,678 107.6 361 673,633 53.6<br />
1991 ............. 3,346 4,110,907 81.4 2,905 3,241,273 89.6 368 682,602 53.9<br />
1990 ............. 3,028 4,158,212 72.8 2,639 3,290,273 80.2 321 684,336 46.9<br />
1989 ............. 2,798 4,040,958 69.2 2,483 3,192,355 77.8 262 673,124 38.9<br />
1988 ............. 2,385 3,909,510 61.0 2,048 3,102,083 66.0 286 638,562 44.8<br />
1987 ............. 2,139 3,809,394 56.2 1,821 3,043,828 59.8 246 611,173 40.3<br />
1986 ............. 1,814 3,756,547 48.3 1,585 3,019,175 52.5 199 592,910 33.6<br />
1985 ............. 1,925 3,760,561 51.2 1,648 3,037,913 54.2 240 581,824 41.2<br />
19844 ............. 1,653 3,669,141 45.1 1,416 2,967,100 47.7 195 568,138 34.3<br />
19834 ............. 1,575 3,638,933 43.3 1,319 2,946,468 44.8 216 562,624 38.4<br />
19824 ............. 1,484 3,680,537 40.3 1,199 2,984,817 40.2 240 568,506 42.2<br />
19814 ............. 1,385 3,629,238 38.2 1,188 2,947,679 40.3 172 564,955 30.4<br />
19804 ............. 1,337 3,612,258 37.0 1,104 2,936,351 37.6 211 568,080 37.1<br />
19794 ............. 1,202 3,494,398 34.4 999 2,842,867 35.1 185 557,684 33.2<br />
19784 ............. 1,185 3,333,279 35.6 942 2,713,108 34.7 206 532,825 38.7<br />
19774 ............. 1,076 3,326,632 32.3 899 2,720,183 33.0 164 526,667 31.1<br />
19764 ............. 1,086 3,167,788 34.3 852 2,593,957 32.8 205 498,506 41.1<br />
19754 ............. 1,066 3,144,198 33.9 909 2,576,818 35.3 151 496,829 30.4<br />
19744 ............. 1,005 3,159,958 31.8 812 2,598,222 31.3 171 494,005 34.6<br />
19734 ............. 944 3,136,965 30.1 751 2,571,660 29.2 169 500,505 33.8<br />
19724 ............. 907 3,258,411 27.8 733 2,675,535 27.4 156 519,824 30.0<br />
19715 ............. 1,034 3,555,970 29.1 834 2,939,568 28.4 196 553,750 35.4<br />
1<br />
Includes races other than white <strong>and</strong> black.<br />
2<br />
Includes <strong>births</strong> in quadruplet <strong>and</strong> quintuplet <strong>and</strong> other higher order multiple deliveries.<br />
3<br />
Includes <strong>births</strong> in twin deliveries.<br />
4<br />
Based on 100 percent of <strong>births</strong> in selected States <strong>and</strong> on a 50-percent sample of <strong>births</strong> in all other States.<br />
5 Based on a 50-percent sample of <strong>births</strong>.<br />
<strong>Triplet</strong><br />
birth<br />
ratio<br />
13
Table 2. <strong>Triplet</strong> <strong>and</strong> other higher order multiple birth ratios by age <strong>and</strong> race of mother: United States, 1972–74, 1982–84, <strong>and</strong><br />
1992–94 total<br />
[Ratios are the number of triplet <strong>and</strong> other higher order multiple <strong>births</strong> per 100,000 live <strong>births</strong> in the specific group]<br />
Age <strong>and</strong> race of mother<br />
All races 1<br />
Years Percent change<br />
1982–84 to<br />
1992–94 1982–84 1972–74<br />
1992–94<br />
Percent change<br />
1972–74 to<br />
1992–94<br />
All ages ................... 105.2 42.9 29.9 145.2 251.8<br />
Under 20 years .............. 14.9 15.0 10.2 –0.7 46.1<br />
20–24 years ................ 35.7 30.5 27.4 17.0 30.3<br />
25–29 years ................ 99.3 50.1 40.0 98.2 148.3<br />
30–34 years ................ 193.6 68.6 41.5 182.2 366.5<br />
35–39 years ................ 216.1 67.8 39.6 218.7 445.7<br />
40–44 years ................ 186.8 * 37.3 * 400.8<br />
45–49 years ................ 672.1 * * * *<br />
White<br />
All ages ................... 119.5 44.2 29.3 170.4 307.8<br />
Under 20 years .............. 12.8 13.0 7.7 –1.5 66.2<br />
20–24 years ................ 35.8 29.8 25.6 20.1 39.8<br />
25–29 years ................ 109.0 51.3 39.6 112.5 175.3<br />
30–34 years ................ 217.3 70.6 40.6 207.8 435.2<br />
35–39 years ................ 236.1 70.8 38.7 233.5 510.1<br />
40–44 years ................ 214.7 * 29.8 * 620.5<br />
45–49 years ................ 735.0 * * * *<br />
Black<br />
All ages ................... 53.1 38.3 32.8 38.6 61.9<br />
Under 20 years .............. 17.6 15.7 16.6 12.1 6.0<br />
20–24 years ................ 40.2 34.5 35.3 16.5 13.9<br />
25–29 years ................ 61.3 49.1 47.5 24.8 29.1<br />
30–34 years ................ 87.5 68.0 48.0 28.7 82.3<br />
35–39 years ................ 127.9 65.6 49.3 95.0 159.4<br />
40–44 years ................ * * * * *<br />
45–49 years ................ * * * * *<br />
*Figure does not meet st<strong>and</strong>ards of reliability or precision.<br />
1 Includes races other than white <strong>and</strong> black.<br />
14
Table 3. <strong>Triplet</strong> <strong>and</strong> other higher order multiple birth ratios by age, education, marital status, <strong>and</strong> race of mother: Total of 47<br />
reporting States, 1982–84, total of 47 reporting States, 1992–94, <strong>and</strong> United States, 1992–94 total<br />
[Ratios are the number of triplet <strong>and</strong> other higher order multiple <strong>births</strong> in the specific group]<br />
Education level, race<br />
<strong>and</strong> age of mother<br />
Total Married Unmarried<br />
1992–94 1 1992–94 2 1982–84 2 1992–94 1 1992–94 2 1982–84 2 1992–94 1 1992–94 2 1982–84 2<br />
All educational levels<br />
All races, 3 all ages ..... 105.2 115.1 44.7 136.1 151.4 47.9 37.2 37.1 32.5<br />
Under 20 years ..... 14.9 15.9 15.9 12.8 14.6 16.1 15.7 16.3 15.7<br />
20–29 years ....... 68.9 76.9 41.9 83.7 94.7 42.7 36.1 38.7 38.1<br />
30–39 years ....... 200.0 217.1 71.8 221.3 240.8 72.0 79.1 73.9 70.0<br />
40–49 years ....... 204.7 189.3 * 225.2 212.3 * 112.9 * *<br />
White, all ages ....... 119.5 133.4 46.3 145.8 161.8 48.2 35.3 34.7 32.5<br />
Under 20 years ..... 12.8 13.7 14.6 12.1 14.4 16.0 13.1 13.4 12.5<br />
20–29 years ....... 75.3 85.5 42.4 88.4 100.1 42.9 33.1 35.2 38.1<br />
30–39 years ....... 222.6 242.4 73.6 240.1 259.2 73.1 80.2 76.0 83.7<br />
40–49 years ....... 233.3 217.7 * 250.8 234.0 * 134.3 * *<br />
Black, all ages ....... 53.1 53.0 38.7 79.5 82.2 47.9 41.3 41.0 32.7<br />
Under 20 years ..... 17.5 19.0 16.2 * * * 17.5 18.8 17.1<br />
20–29 years ....... 49.1 50.0 41.5 62.8 63.9 43.6 42.7 44.0 39.7<br />
30–39 years ....... 99.2 95.3 66.2 109.9 111.0 70.5 87.0 78.1 57.9<br />
40–49 years ....... 93.0 * * * * * * * *<br />
0–11 years<br />
All races, 3 all ages ..... 33.2 36.7 28.8 40.1 46.4 27.8 27.9 31.1 30.2<br />
Under 20 years ..... 14.5 17.1 13.9 10.3 * 10.4 15.8 18.0 16.1<br />
20–29 years ....... 35.9 41.8 36.0 40.6 47.4 32.0 31.1 37.0 43.4<br />
30–39 years ....... 69.4 82.2 53.9 66.4 80.2 46.7 74.1 85.0 73.5<br />
40–49 years ....... * * * * * * * * *<br />
White, all ages ....... 33.4 38.3 24.4 40.6 47.7 24.2 26.0 29.7 24.8<br />
Under 20 years ..... 13.4 16.6 11.7 10.8 * 10.5 14.7 17.5 13.1<br />
20–29 years ....... 34.8 42.3 29.7 40.5 48.2 28.4 27.0 34.6 34.1<br />
30–39 years ....... 71.0 86.7 45.3 70.3 87.8 39.5 72.3 84.5 *<br />
40–49 years ....... * * * 89.4 * * * * *<br />
Black, all ages ....... 33.2 34.1 38.2 50.6 52.2 51.6 30.9 32.0 34.6<br />
Under 20 years ..... 14.3 15.8 15.0 * * * 14.6 16.3 16.1<br />
20–29 years ....... 42.5 41.3 54.8 * * 54.9 41.3 40.1 54.8<br />
30–39 years ....... 90.0 93.8 82.5 * * 82.7 89.4 95.4 82.2<br />
40–49 years ....... * * * * * * * * *<br />
12 years<br />
All races, 3 all ages ..... 76.6 81.4 37.8 96.3 105.6 38.7 38.6 36.4 34.1<br />
Under 20 years ..... 14.5 13.5 18.2 15.3 * 21.4 14.1 13.7 14.5<br />
20–29 years ....... 60.1 66.5 37.0 70.4 80.6 36.6 40.1 40.2 39.4<br />
30–39 years ....... 143.1 146.5 55.0 163.3 170.2 54.9 65.5 55.2 55.8<br />
40–49 years ....... 105.7 88.0 * 118.0 112.5 * * * *<br />
White, all ages ....... 84.4 91.1 37.4 101.1 110.8 37.7 35.5 32.0 35.1<br />
Under 20 years ..... 9.7 * 18.3 * * 20.6 * * *<br />
20–29 years ....... 63.8 71.3 36.3 72.7 83.2 36.1 37.1 34.7 38.3<br />
30–39 years ....... 160.2 166.4 53.8 176.2 183.0 52.2 66.5 61.7 76.9<br />
40–49 years ....... 106.4 89.7 * 112.6 109.5 * * * *<br />
See footnotes at end of table.<br />
15
Table 3. <strong>Triplet</strong> <strong>and</strong> other higher order multiple birth ratios by age, education, marital status, <strong>and</strong> race of mother: Total of 47<br />
reporting States, 1982–84, total of 47 reporting States, 1992–94, <strong>and</strong> United States, 1992–94 total—Con.<br />
[Ratios are the number of triplet <strong>and</strong> other higher order multiple <strong>births</strong> in the specific group]<br />
Education level, race<br />
<strong>and</strong> age of mother<br />
Total Married Unmarried<br />
1992–94 1 1992–94 2 1982–84 2 1992–94 1 1992–94 2 1982–84 2 1992–94 1 1992–94 2 1982–84 2<br />
12 years—Continued<br />
Black, all ages ....... 51.6 52.3 40.4 69.0 76.8 47.6 44.4 43.0 35.2<br />
Under 20 years ..... 23.3 27.0 * * * * 22.2 25.2 *<br />
20–29 years ....... 50.4 52.7 43.1 62.5 67.3 43.8 45.5 47.2 42.6<br />
30–39 years ....... 75.8 69.5 59.4 83.8 93.3 70.6 69.3 50.5 *<br />
40–49 years ....... * * * * * * * * *<br />
13–15 years<br />
All races, 3 all ages ..... 119.2 127.3 50.2 138.9 150.7 51.1 44.5 41.3 42.6<br />
Under 20 years ..... * * * * * * * * *<br />
20–29 years ....... 82.7 88.5 45.3 97.2 105.1 47.4 36.2 37.9 29.7<br />
30–39 years ....... 185.3 200.5 66.6 200.9 219.7 62.6 78.8 67.5 122.9<br />
40–49 years ....... 198.9 175.9 * 218.8 209.9 * * * *<br />
White, all ages ....... 134.7 144.1 53.8 150.4 161.7 52.8 41.1 35.1 70.5<br />
Under 20 years ..... * * * * * * * * *<br />
20–29 years ....... 92.1 98.8 49.3 103.8 111.8 48.8 33.1 31.9 58.0<br />
30–39 years ....... 207.4 223.3 68.5 219.7 236.9 64.7 74.8 62.3 171.4<br />
40–49 years ....... 217.6 202.8 * 237.6 229.6 * * * *<br />
Black, all ages ....... 65.0 63.8 35.0 80.5 79.5 45.5 51.9 51.7 21.4<br />
Under 20 years ..... * * * * * * * * *<br />
20–29 years ....... 53.8 53.4 28.4 67.9 62.2 42.1 43.7 47.5 *<br />
30–39 years ....... 98.6 95.4 61.7 102.5 107.0 60.1 92.9 79.1 *<br />
40–49 years ....... * * * * * * * * *<br />
16 or more years<br />
All races, 3 all ages ..... 228.7 239.8 75.3 237.4 249.0 76.9 89.1 79.1 *<br />
Under 20 years ..... * * * * * * * * *<br />
20–29 years ....... 121.8 128.5 58.4 128.6 135.6 60.1 36.3 39.6 *<br />
30–39 years ....... 294.2 312.5 94.3 302.5 320.9 95.7 124.3 110.6 *<br />
40–49 years ....... 316.4 287.9 * 320.7 290.9 * * * *<br />
White, all ages ....... 250.2 259.3 80.1 256.0 265.1 81.0 118.0 103.4 *<br />
Under 20 years ..... * * * * * * * * *<br />
20–29 years ....... 135.9 141.7 63.6 140.5 146.0 64.3 * * *<br />
30–39 years ....... 318.3 334.1 98.4 324.5 339.9 99.5 150.5 129.6 *<br />
40–49 years ....... 352.3 314.8 * 351.9 312.6 * * * *<br />
Black, all ages ....... 99.8 99.8 36.2 118.1 118.7 40.8 49.6 * *<br />
Under 20 years ..... * * * * * * * * *<br />
20–29 years ....... 46.4 54.5 * 58.5 70.6 * * * *<br />
30–39 years ....... 144.3 136.8 63.4 157.1 147.7 64.3 * * *<br />
40–49 years ....... * * * * * * * * *<br />
*Figure does not meet st<strong>and</strong>ards of reliability or precision.<br />
1 Includes 50 States <strong>and</strong> the District of Columbia.<br />
2 Excludes Cal<strong>for</strong>nia, Texas, <strong>and</strong> Washington that did not report education <strong>for</strong> 1982–84.<br />
3 Includes races other than white <strong>and</strong> black.<br />
16
Table 4. <strong>Triplet</strong> <strong>and</strong> other higher order multiple birth ratios: United States <strong>and</strong> each State, 1992–94 total<br />
[Ratios are live <strong>births</strong> in triplet <strong>and</strong> other higher order multiple birth deliveries per 100,000 total live <strong>births</strong>]<br />
State Ratio State Ratio<br />
United States ...................... 105.5<br />
Alabama ......................... 78.4<br />
Alaska ........................... *<br />
Arizona .......................... 94.9<br />
Arkansas ......................... 67.4<br />
Cali<strong>for</strong>nia ......................... 76.6<br />
Colorado ......................... 127.3<br />
Connecticut ....................... 136.5<br />
Delaware ......................... 123.3<br />
District of Columbia ................... *<br />
Florida ........................... 94.1<br />
Georgia .......................... 72.1<br />
Hawaii ........................... 139.0<br />
Idaho ........................... *<br />
Illinois ........................... 155.0<br />
Indiana .......................... 157.6<br />
Iowa ............................ 158.8<br />
Kansas .......................... 118.8<br />
Kentucky ......................... 64.4<br />
Louisiana ......................... 84.6<br />
Maine ........................... 72.4<br />
Maryl<strong>and</strong> ......................... 123.5<br />
Massachusetts ...................... 215.9<br />
Michigan ......................... 128.0<br />
Minnesota ........................ 149.1<br />
Mississippi ........................ 61.5<br />
*Figure does not meet st<strong>and</strong>ards of reliability or precision.<br />
Table 5. Number <strong>and</strong> percent distribution of triplet <strong>and</strong> other higher order multiple <strong>births</strong> <strong>and</strong> singleton <strong>births</strong> by period of gestation <strong>and</strong><br />
race of mother: United States, 1992–94 total<br />
Period of gestation 2<br />
All races 1 White Black<br />
<strong>Triplet</strong>s 3 Singletons <strong>Triplet</strong>s 3 Singletons <strong>Triplet</strong>s 3 Singletons<br />
Number<br />
Live <strong>births</strong>. ................. 12,645 11,716,495 11,319 9,237,688 1,046 1,912,339<br />
Total ..................... 100.0 100.0<br />
Percent distribution<br />
100.0 100.0 100.0 100.0<br />
Under 28 weeks .............. 13.4 0.6 12.7 0.4 22.4 1.6<br />
28–31 weeks ................ 21.4 1.0 21.7 0.8 19.7 2.3<br />
32–33 weeks ................ 21.8 1.2 22.0 1.0 18.9 2.5<br />
34–36 weeks ................ 34.6 6.9 35.3 6.1 27.1 10.7<br />
37–41 weeks ................ 8.4 80.3 8.0 81.6 10.6 73.7<br />
42 or more weeks ............. 0.5 9.9 0.4 10.1 1.3 9.2<br />
Under 37 weeks .............. 91.1 9.8 91.6 8.3 88.2 17.1<br />
Mean weeks ................ 32.2 39.1 32.2 39.2 31.4 38.4<br />
1 Includes races other than white <strong>and</strong> black.<br />
2 Period of gestation is in completed weeks of gestation.<br />
3 Includes <strong>births</strong> in quadruplet, <strong>and</strong> quintuplet <strong>and</strong> other higher order multiple deliveries.<br />
Missouri ........................... 79.1<br />
Montana ........................... *<br />
Nebraska .......................... 149.0<br />
Nevada ........................... 87.4<br />
New Hampshire ...................... 178.4<br />
New Jersey ......................... 165.6<br />
New Mexico ........................ 70.8<br />
NewYork .......................... 131.5<br />
North Carolina ....................... 97.8<br />
North Dakota ........................ 138.0<br />
Ohio ............................. 140.9<br />
Oklahoma .......................... 55.9<br />
Oregon ........................... 90.1<br />
Pennsylvania ........................ 111.7<br />
South Carolina ....................... 108.6<br />
Rhode Isl<strong>and</strong> ........................ 107.3<br />
South Dakota ....................... 89.9<br />
Tennessee ......................... 88.3<br />
Texas ............................ 73.3<br />
Utah ............................. 81.7<br />
Vermont ........................... 84.2<br />
Virginia ........................... 86.4<br />
Washington ......................... 68.0<br />
West Virginia ........................ 93.4<br />
Wisconsin .......................... 106.9<br />
Wyoming .......................... *<br />
17
Table 6. Number of triplet <strong>and</strong> other higher order multiple <strong>births</strong> <strong>and</strong> singleton <strong>births</strong> by period of gestation <strong>and</strong> percent distribution by<br />
birthweight according to period of gestation <strong>and</strong> race of mother: United States, 1992–94 total<br />
Period of gestation <strong>and</strong> birthweight<br />
All races 1 White Black<br />
<strong>Triplet</strong>s 2 Singletons <strong>Triplet</strong>s 2 Singletons <strong>Triplet</strong>s 2 Singletons<br />
All gestations Number<br />
Live <strong>births</strong>3,4 ....................... 12,645 1,171,695 11,319 9,237,688 1,046 1,912,339<br />
Percent distribution<br />
Total ............................ 100.0 100.0 100.0 100.0 100.0 100.0<br />
Less than 500 grams .................. 3.4 0.1 3.2 0.1 6.1 0.3<br />
500–999 grams. ..................... 11.6 0.4 11.0 0.3 19.2 1.1<br />
1,000–1,499 grams ................... 20.0 0.5 20.0 0.4 20.0 1.1<br />
1,500–1,999 grams ................... 31.1 1.1 31.1 0.8 28.9 2.1<br />
2,000–2,499 grams ................... 26.1 3.9 26.7 3.2 19.3 7.1<br />
2,500–2,999 grams ................... 6.7 15.9 6.9 14.1 4.8 23.4<br />
3,000–3,499 grams ................... 0.9 37.4 0.9 36.9 1.1 38.6<br />
3,500–3,999 grams ................... 0.2 29.9 0.2 32.0 * 20.8<br />
4,000 grams or more .................. * 10.8 * 12.1 * 5.4<br />
Less than 1,500 grams ................. 35.0 1.1 34.1 0.8 45.4 2.5<br />
Less than 2,500 grams ................. 92.1 6.0 92.0 4.8 93.6 11.7<br />
Mean birthweight. .................... 1,698 3,358 1,712 3,409 1,537 3,132<br />
Less than 28 weeks Number<br />
Live <strong>births</strong>3,4 ....................... 1,673 70,448 1,421 37,195 231 30,999<br />
Percent distribution<br />
Total ............................ 100.0 100.0 100.0 100.0 100.0 100.0<br />
Less than 500 grams .................. 24.6 17.4 24.5 16.5 25.7 18.5<br />
500–999 grams. ..................... 60.1 53.6 60.0 55.2 61.9 51.8<br />
1,000–1,499 grams ................... 12.8 14.9 13.4 15.6 * 14.1<br />
1,500–1,999 grams ................... 1.7 4.7 1.6 4.1 * 5.3<br />
2,000–2,499 grams ................... * 3.7 * 3.1 * 4.2<br />
2,500–2,999 grams ................... * 5.8 * 5.4 * 6.1<br />
3,000–3,499 grams ................... * * * * * *<br />
3,500–3,999 grams ................... * * * * * *<br />
4,000 grams or more .................. * * * * * *<br />
Less than 1,500 grams ................. 97.5 85.9 97.9 87.3 96.0 84.4<br />
Less than 2,500 grams ................. 99.8 94.2 99.9 94.6 99.6 93.9<br />
Mean birthweight. .................... 731 961 730 947 720 973<br />
28–36 weeks Number<br />
Live <strong>births</strong>3,4 ....................... 9,733 1,069,436 8,847 724,182 677 293,243<br />
Percent distribution<br />
Total ............................ 100.0 100.0 100.0 100.0 100.0 100.0<br />
Less than 500 grams .................. * 0.0 * 0.0 * 0.1<br />
500–999 grams. ..................... 4.5 1.1 4.2 1.0 8.3 1.4<br />
1,000–1,499 grams ................... 22.5 4.3 22.2 3.9 25.6 5.5<br />
1,500–1,999 grams ................... 37.3 8.9 37.1 8.3 38.6 10.7<br />
2,000–2,499 grams ................... 29.0 19.1 29.6 18.3 22.7 21.2<br />
2,500–2,999 grams ................... 6.0 28.7 6.2 28.7 3.8 28.6<br />
3,000–3,499 grams ................... 0.5 24.7 0.5 25.3 * 22.8<br />
3,500–3,999 grams ................... * 10.6 0.1 11.5 * 8.1<br />
4,000 grams or more .................. * 2.6 * 3.0 * 1.6<br />
Less than 1,500 grams ................. 27.1 5.4 26.5 4.9 34.1 7.0<br />
Less than 2,500 grams ................. 93.4 33.4 93.2 31.5 95.4 38.9<br />
Mean birthweight. .................... 1,801 2,749 1,810 2,786 1,698 2,646<br />
See footnotes at end of table.<br />
18
Table 6. Number of triplet <strong>and</strong> other higher order multiple <strong>births</strong> <strong>and</strong> singleton <strong>births</strong> by period of gestation <strong>and</strong> percent distribution by<br />
birthweight according to period of gestation <strong>and</strong> race of mother: United States, 1992–94 total—Con.<br />
Period of gestation <strong>and</strong> birthweight<br />
All races 1 White Black<br />
<strong>Triplet</strong>s 2 Singletons <strong>Triplet</strong>s 2 Singletons <strong>Triplet</strong>s 2 Singletons<br />
37–47 weeks Number<br />
Live <strong>births</strong>3,4 ....................... 1,108 10,467,811 946 8,394,930 122 1,570,294<br />
Percent distribution<br />
Total ............................ 100.0 100.0 100.0 100.0 100.0 100.0<br />
Less than 500 grams .................. * * * * * *<br />
500–999 grams. ..................... 2.3 0.0 2.4 0.0 * 0.0<br />
1,000–1,499 grams ................... 9.3 0.0 9.1 0.0 * 0.1<br />
1,500–1,999 grams ................... 19.4 0.2 18.7 0.2 25.4 0.5<br />
2,000–2,499 grams ................... 38.1 2.3 38.6 1.9 32.8 4.5<br />
2,500–2,999 grams ................... 22.2 14.7 22.8 12.9 18.0 22.8<br />
3,000–3,499 grams ................... 6.0 39.0 6.1 38.1 * 42.3<br />
3,500–3,999 grams ................... * 32.0 * 33.9 * 23.5<br />
4,000 grams or more .................. * 11.7 * 13.0 * 6.3<br />
Less than 1,500 grams ................. 12.0 0.0 11.8 0.0 * 0.1<br />
Less than 2,500 grams ................. 69.5 2.6 69.1 2.1 72.1 5.1<br />
Mean birthweight. .................... 2,223 3,437 2,231 3,475 2,158 3,266<br />
* Figure does not meet st<strong>and</strong>ards of reliability or precision.<br />
0.0 Quantity more than 0 but less than 0.5.<br />
1<br />
Includes races other than white <strong>and</strong> black.<br />
2<br />
Includes <strong>births</strong> in quadruplet <strong>and</strong> quintuplet <strong>and</strong> other higher order multiple deliveries.<br />
3<br />
Includes <strong>births</strong> with period of gestation not stated.<br />
4<br />
Includes <strong>births</strong> with birthweight not stated.<br />
Table 7. Infant mortality rates <strong>for</strong> triplet <strong>and</strong> other higher order multiple <strong>births</strong> <strong>and</strong> singleton <strong>births</strong> by race of mother:<br />
United States, 1983–91 birth cohorts<br />
[Rates are per 1,000 live <strong>births</strong> in specified group]<br />
Year<br />
All races 1 White Black<br />
<strong>Triplet</strong>s 2 Singletons <strong>Triplet</strong>s 2 Singletons <strong>Triplet</strong>s 2 Singletons<br />
1991 ........................... 93.7 7.8 79.1 6.4 209.2 15.1<br />
1990 ........................... 102.4 8.0 100.8 6.6 134.0 15.4<br />
1989 ........................... 101.5 8.7 97.1 7.1 160.3 16.2<br />
1988 ........................... 112.8 8.7 108.9 7.3 139.9 16.2<br />
1987 ........................... 136.0 8.9 130.9 7.4 157.7 16.3<br />
1986 ........................... 113.6 9.2 123.2 7.7 45.7 16.7<br />
1985 ........................... 159.7 9.5 138.9 8.0 302.5 17.0<br />
1984 ........................... 125.9 10.4 119.1 8.8 156.4 17.9<br />
1983 ........................... 156.1 10.9 148.5 9.3 215.7 19.0<br />
1 Includes races other than white <strong>and</strong> black.<br />
2 Includes <strong>births</strong> in quadruplet <strong>and</strong> quintuplet <strong>and</strong> other higher order deliveries.<br />
19
Table 8. Infant mortality rates <strong>for</strong> triplet <strong>and</strong> other higher order multiple <strong>births</strong> <strong>and</strong> <strong>for</strong> singleton <strong>births</strong> by birthweight: United States,<br />
birth cohorts 1987–91 total<br />
[Rates are per 1,000 live <strong>births</strong> in specified group]<br />
Birthweight <strong>Triplet</strong>s 1 Singletons Percent difference<br />
499 grams or less .................................. 934.1 882.0 5.9<br />
500–999 grams .................................... 449.2 451.5 –0.5<br />
1,000–1,499 grams. ................................. 47.4 112.7 –57.9<br />
1,500–1,999 grams. ................................. 15.2 50.4 –69.8<br />
2,000–2,499 grams. ................................. 7.3 19.0 –61.6<br />
2,500 or more grams ................................ * 3.7 *<br />
*Figure does not meet st<strong>and</strong>ards of reliability or precision.<br />
1 Includes <strong>births</strong> in quadruplet <strong>and</strong> quintuplet <strong>and</strong> other higher order multiple deliveries.<br />
Table 9. Infant mortality rates <strong>for</strong> triplet <strong>and</strong> other higher order multiple <strong>births</strong> <strong>and</strong> <strong>for</strong> singleton <strong>births</strong> by period of gestation: United<br />
States, birth cohorts 1987–91 total<br />
[Rates are per 1,000 live <strong>births</strong> in specified group]<br />
Period of gestation 1 <strong>Triplet</strong>s 2 Singletons Percent difference<br />
Under 28 weeks ................................... 628.8 402.1 56.4<br />
28–31 weeks ..................................... 64.8 66.9 –3.1<br />
32–33 weeks ..................................... 17.9 26.8 –33.2<br />
34–36 weeks ..................................... 12.7 11.9 6.7<br />
37 weeks or more .................................. 21.5 4.0 437.5<br />
1 Completed weeks of gestation.<br />
2 Includes <strong>births</strong> in quaduplet <strong>and</strong> quintuplet <strong>and</strong> other higher order multiple deliveries.<br />
Table 10. Infant mortality rates <strong>for</strong> the 5 leading causes of death <strong>for</strong> triplet <strong>and</strong> other higher order multiple <strong>births</strong> <strong>and</strong> singleton <strong>births</strong>:<br />
United States, birth cohorts 1987–91 total<br />
[Rates are per 100,000 live <strong>births</strong> in specified group]<br />
Cause of death<br />
<strong>Triplet</strong>s 1 Singletons<br />
Rank Rate Rank Rate<br />
Newborn affected by maternal complications of pregnancy ............ (761) 1 2,810.2 5 17.2<br />
Respiratory distress syndrome ............................. (769) 2 1,824.8 4 60.2<br />
Disorders relating to short gestation <strong>and</strong> unspecified low birthweight ...... (765) 3 729.9 3 84.2<br />
Congenital anomalies ................................ (740–759) 4 700.7 1 189.0<br />
Sudden infant death syndrome ............................ (798.0) 5 255.5 2 129.4<br />
1 Includes <strong>births</strong> in quadruplet <strong>and</strong> quintuplet <strong>and</strong> other higher order multiple deliveries.<br />
20
Vital <strong>and</strong> Health Statistics<br />
series descriptions<br />
SERIES 1. Programs <strong>and</strong> Collection Procedures—These reports<br />
describe the data collection programs of the National Center<br />
<strong>for</strong> Health Statistics. They include descriptions of the methods<br />
used to collect <strong>and</strong> process the data, definitions, <strong>and</strong> other<br />
material necessary <strong>for</strong> underst<strong>and</strong>ing the data.<br />
SERIES 2. Data Evaluation <strong>and</strong> Methods Research—These reports<br />
are studies of new statistical methods <strong>and</strong> include analytical<br />
techniques, objective evaluations of reliability of collected<br />
data, <strong>and</strong> contributions to statistical theory. These studies also<br />
include experimental tests of new survey methods <strong>and</strong><br />
comparisons of U.S. methodology with those of other<br />
countries.<br />
SERIES 3. Analytical <strong>and</strong> Epidemiological Studies—These reports<br />
present analytical or interpretive studies based on vital <strong>and</strong><br />
health statistics. These reports carry the analyses further than<br />
the expository types of reports in the other series.<br />
SERIES 4. Documents <strong>and</strong> Committee Reports—These are final<br />
reports of major committees concerned with vital <strong>and</strong> health<br />
statistics <strong>and</strong> documents such as recommended model vital<br />
registration laws <strong>and</strong> revised birth <strong>and</strong> death certificates.<br />
SERIES 5. International Vital <strong>and</strong> Health Statistics Reports—These<br />
reports are analytical or descriptive reports that compare U.S.<br />
vital <strong>and</strong> health statistics with those of other countries or<br />
present other international data of relevance to the health<br />
statistics system of the United States.<br />
SERIES 6. Cognition <strong>and</strong> Survey Measurement—These reports are<br />
from the National Laboratory <strong>for</strong> Collaborative Research in<br />
Cognition <strong>and</strong> Survey Measurement. They use methods of<br />
cognitive science to design, evaluate, <strong>and</strong> test survey<br />
instruments.<br />
SERIES 10. Data From the National Health Interview Survey—These<br />
reports contain statistics on illness; unintentional injuries;<br />
disability; use of hospital, medical, <strong>and</strong> other health services;<br />
<strong>and</strong> a wide range of special current health topics covering<br />
many aspects of health behaviors, health status, <strong>and</strong> health<br />
care utilization. They are based on data collected in a<br />
continuing national household interview survey.<br />
SERIES 11. Data From the National Health Examination Survey, the<br />
National Health <strong>and</strong> Nutrition Examination Surveys, <strong>and</strong><br />
the Hispanic Health <strong>and</strong> Nutrition Examination Survey—<br />
Data from direct examination, testing, <strong>and</strong> measurement on<br />
representative samples of the civilian noninstitutionalized<br />
population provide the basis <strong>for</strong> (1) medically defined total<br />
prevalence of specific diseases or conditions in the United<br />
States <strong>and</strong> the distributions of the population with respect to<br />
physical, physiological, <strong>and</strong> psychological characteristics, <strong>and</strong><br />
(2) analyses of trends <strong>and</strong> relationships among various<br />
measurements <strong>and</strong> between survey periods.<br />
SERIES 12. Data From the Institutionalized Population Surveys—<br />
Discontinued in 1975. Reports from these surveys are<br />
included in Series 13.<br />
SERIES 13. Data From the National Health Care Survey—These<br />
reports contain statistics on health resources <strong>and</strong> the public’s<br />
use of health care resources including ambulatory, hospital,<br />
<strong>and</strong> long-term care services based on data collected directly<br />
from health care providers <strong>and</strong> provider records.<br />
SERIES 14. Data on Health Resources: Manpower <strong>and</strong> Facilities—<br />
Discontinued in 1990. Reports on the numbers, geographic<br />
distribution, <strong>and</strong> characteristics of health resources are now<br />
included in Series 13.<br />
SERIES 15. Data From Special Surveys—These reports contain<br />
statistics on health <strong>and</strong> health-related topics collected in<br />
special surveys that are not part of the continuing data<br />
systems of the National Center <strong>for</strong> Health Statistics.<br />
SERIES 16. Compilations of Advance Data From Vital <strong>and</strong> Health<br />
Statistics—Advance Data Reports provide early release of<br />
in<strong>for</strong>mation from the National Center <strong>for</strong> Health Statistics’<br />
health <strong>and</strong> demographic surveys. They are compiled in the<br />
order in which they are published. Some of these releases<br />
may be followed by detailed reports in Series 10–13.<br />
SERIES 20. Data on Mortality—These reports contain statistics on<br />
mortality that are not included in regular, annual, or monthly<br />
reports. Special analyses by cause of death, age, other<br />
demographic variables, <strong>and</strong> geographic <strong>and</strong> trend analyses<br />
are included.<br />
SERIES 21. Data on Natality, Marriage, <strong>and</strong> Divorce—These reports<br />
contain statistics on natality, marriage, <strong>and</strong> divorce that are<br />
not included in regular, annual, or monthly reports. Special<br />
analyses by health <strong>and</strong> demographic variables <strong>and</strong><br />
geographic <strong>and</strong> trend analyses are included.<br />
SERIES 22. Data From the National Mortality <strong>and</strong> Natality Surveys—<br />
Discontinued in 1975. Reports from these sample surveys,<br />
based on vital records, are now published in Series 20 or 21.<br />
SERIES 23. Data From the National Survey of Family Growth—<br />
These reports contain statistics on factors that affect birth<br />
rates, including contraception, infertility, cohabitation,<br />
marriage, divorce, <strong>and</strong> remarriage; adoption; use of medical<br />
care <strong>for</strong> family planning <strong>and</strong> infertility; <strong>and</strong> related maternal<br />
<strong>and</strong> infant health topics. These statistics are based on<br />
national surveys of women of childbearing age.<br />
SERIES 24. Compilations of Data on Natality, Mortality, Marriage,<br />
Divorce, <strong>and</strong> Induced Terminations of Pregnancy—<br />
These include advance reports of <strong>births</strong>, deaths, marriages,<br />
<strong>and</strong> divorces based on final data from the National Vital<br />
Statistics System that were published as supplements to the<br />
Monthly Vital Statistics Report (MVSR). These reports provide<br />
highlights <strong>and</strong> summaries of detailed data subsequently<br />
published in Vital Statistics of the United States. Other<br />
supplements to the MVSR published here provide selected<br />
findings based on final data from the National Vital Statistics<br />
System <strong>and</strong> may be followed by detailed reports in Series 20<br />
or 21.<br />
For answers to questions about this report or <strong>for</strong> a list of reports published<br />
in these series, contact:<br />
Data Dissemination Branch<br />
National Center <strong>for</strong> Health Statistics<br />
<strong>Centers</strong> <strong>for</strong> <strong>Disease</strong> <strong>Control</strong> <strong>and</strong> <strong>Prevention</strong><br />
Public Health Service<br />
6525 Belcrest Road, Room 1064<br />
Hyattsville, MD 20782<br />
(301) 436–8500<br />
E-mail: nchsquery@nch10a.em.cdc.gov<br />
Internet: http://www.cdc.gov/nchswww/nchshome.htm
DEPARTMENT OF<br />
HEALTH & HUMAN SERVICES<br />
Public Health Service<br />
<strong>Centers</strong> <strong>for</strong> <strong>Disease</strong> <strong>Control</strong> <strong>and</strong> <strong>Prevention</strong><br />
National Center <strong>for</strong> Health Statistics<br />
6525 Belcrest Road<br />
Hyattsville, Maryl<strong>and</strong> 20782<br />
OFFICIAL BUSINESS<br />
PENALTY FOR PRIVATE USE, $300<br />
DHHS Publication No. (PHS) 97-1933, Series 21, No. 55<br />
7-0100 (1/97)<br />
STANDARD MAIL (A)<br />
POSTAGE & FEES PAID<br />
PHS/NCHS<br />
PERMIT NO. G-281