SEMIANNUAL REPORT - USAA.com
SEMIANNUAL REPORT - USAA.com
SEMIANNUAL REPORT - USAA.com

You also want an ePaper? Increase the reach of your titles
YUMPU automatically turns print PDFs into web optimized ePapers that Google loves.
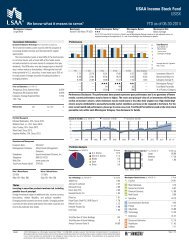
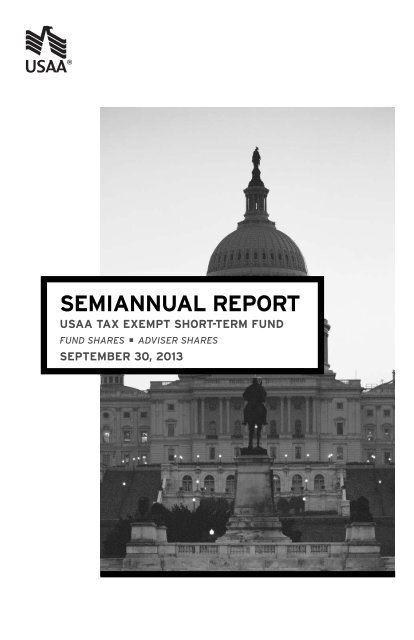
<strong>SEMIANNUAL</strong> <strong>REPORT</strong><br />
<strong>USAA</strong> TAX EXEMPT SHORT-TERM FUND<br />
FUND SHARES ■ ADVISER SHARES<br />
SEPTEMBER 30, 2013
PRESIDENT’S<br />
MESSAGE<br />
“Because of the inverse relationship between<br />
bond prices and yields, lower prices mean<br />
investors may have the opportunity to<br />
reinvest at higher rates and potentially<br />
earn more on any new investments.”<br />
September 2013<br />
Would it or wouldn’t it? Would the U.S. Federal Reserve (the Fed) begin to<br />
reduce its bond-buying programs? Or would it continue purchasing bonds at<br />
the same pace? And if the Fed decided to taper, when would the reductions<br />
begin and how much would they be? The guessing game, which got underway<br />
in June after remarks by Fed Chairman Ben Bernanke, continued through<br />
the end of the reporting period. As I’ve discussed in the past, the Fed is<br />
supporting the economy by purchasing approximately $85 billion in<br />
mortgage-backed securities and long-term U.S. Treasury securities every<br />
month. (This is <strong>com</strong>monly known as “quantitative easing” or “QE”). In<br />
response to QE, long-term interest rates have fallen and the stock and bond<br />
markets have rallied.<br />
Most people acknowledge that QE can’t go on forever, but the idea the Fed<br />
would restrain a still fragile economy gave the markets pause. Interest rates<br />
rose sharply (bond prices, which move in the opposite direction, declined).<br />
By August, many investors had convinced themselves that the tapering<br />
announcement would be made at the Fed’s September policy meeting.<br />
Instead, the Fed backed away from its prior guidance, saying it would continue<br />
buying the same amount of bonds every month. In response, interest rates<br />
trended down slightly as the markets began to price in the risks of a fiscal<br />
impasse in Washington, D.C.<br />
During the reporting period, our <strong>USAA</strong> tax-exempt portfolios appeared to<br />
benefit from our bench of independent credit analysts. Because of their<br />
diligence, many of our mutual funds have avoided headline defaults and<br />
Chapter 9 bankruptcies such as Detroit; Jefferson County, Alabama; and<br />
Stockton, San Bernardino, Vallejo and Orange County, California. While<br />
headline events like these are likely to occur (unfunded pensions remain<br />
a long-term concern of ours), overall municipal credit quality appears to
emain solid. We continue to expect the default rate among municipal<br />
issuers to remain extremely low. Meanwhile, our <strong>USAA</strong> tax-exempt money<br />
market funds are yielding almost zero at the present time.<br />
For fixed-in<strong>com</strong>e investors, the prospect of gradually rising interest rates<br />
remains a mixed blessing. Higher rates mean a decrease in principal value.<br />
However, because of the inverse relationship between bond prices and yields,<br />
lower prices mean investors may have the opportunity to reinvest at higher<br />
rates and potentially earn more on any new investments. Furthermore,<br />
fixed-in<strong>com</strong>e investing is not an all or none scenario, and bonds continue<br />
to have a place in a diversified portfolio. Lastly, people often forget the<br />
bond market is not one market but is actually a market of many different<br />
types of bonds. While investors tend to focus on U.S. Treasuries, there are<br />
other segments of the bond market and they have performed differently<br />
(some better, some worse) during the reporting period. Investors should<br />
take a diversified approach to their fixed-in<strong>com</strong>e holdings.<br />
If you think you might be over-allocated to fixed-in<strong>com</strong>e securities, you<br />
want to reassess your investment risk and if necessary, rebalance your<br />
portfolio. Regular rebalancing can potentially help you protect your gains<br />
and prepare for what happens next. Shareholders should always remain<br />
disciplined and follow an investment plan based on their objectives, risk<br />
tolerance and time horizon. If you have questions or would like assistance,<br />
<strong>USAA</strong> advisors stand ready to help you, free of charge.<br />
In closing, I want to acknowledge the challenges that many people faced as<br />
a result of the federal government shutdown. We are glad the impasse has<br />
been temporarily resolved as of the time of this message. Rest assured, we<br />
will continue to monitor events in Washington, D.C. and any other factors<br />
that may affect your investments.<br />
Thank you for your confidence in us.<br />
Sincerely,<br />
Daniel S. McNamara<br />
President<br />
<strong>USAA</strong> Investment Management Company<br />
Past performance is no guarantee of future results. • As interest rates rise, bond prices fall • Diversification<br />
is a technique to help reduce risk and does not guarantee a profit or prevent a loss. • Financial advice<br />
provided by <strong>USAA</strong> Financial Planning Services Insurance Agency, Inc. (known as <strong>USAA</strong> Financial Insurance<br />
Agency in California, License # 0E36312), and <strong>USAA</strong> Financial Advisors, Inc., a registered broker dealer.
TABLE OF CONTENTS<br />
Fund Objective 1<br />
Managers’ Commentary 2<br />
Investment Overview 6<br />
Financial Information<br />
Portfolio of Investments 16<br />
Notes to Portfolio of Investments 32<br />
Financial Statements 33<br />
Notes to Financial Statements 36<br />
Expense Example 49<br />
Advisory Agreement 51<br />
This report is for the information of the shareholders and others who have received a copy<br />
of the currently effective prospectus of the Fund, managed by <strong>USAA</strong> Asset Management<br />
Company. It may be used as sales literature only when preceded or ac<strong>com</strong>panied by a current<br />
prospectus, which provides further details about the Fund.<br />
©2013, <strong>USAA</strong>. All rights reserved.
FUND OBJECTIVE<br />
The <strong>USAA</strong> Tax Exempt Short-Term Fund (the Fund) provides<br />
investors with interest in<strong>com</strong>e that is exempt from federal in<strong>com</strong>e<br />
tax.<br />
Types of Investments<br />
The Fund invests primarily in investment-grade securities, the interest<br />
from which is exempt from federal in<strong>com</strong>e tax. During normal market<br />
conditions, at least 80% of the Fund’s net assets will consist of tax-exempt<br />
securities. The Fund’s dollar-weighted average portfolio maturity is three<br />
years or less.<br />
IRA DISTRIBUTION WITHHOLDING DISCLOSURE<br />
We generally must withhold federal in<strong>com</strong>e tax at a rate of 10% of the taxable<br />
portion of your distribution and, if you live in a state that requires state in<strong>com</strong>e tax<br />
withholding, at your state’s set rate. However, you may elect not to have withholding<br />
apply or to have in<strong>com</strong>e tax withheld at a higher rate. If you wish to make such an<br />
election, please call <strong>USAA</strong> Asset Management Company at (800) 531-<strong>USAA</strong> (8722).<br />
If you must pay estimated taxes, you may be subject to estimated tax penalties if<br />
your estimated tax payments are not sufficient and sufficient tax is not withheld<br />
from your distribution.<br />
For more specific information, please consult your tax adviser.<br />
Fund Objective | 1
MANAGERS’ COMMENTARY<br />
ON THE FUND<br />
Regina Shafer, CPA, CFA<br />
<strong>USAA</strong> Asset<br />
Management Company<br />
Diederik Olijslager<br />
<strong>USAA</strong> Asset<br />
Management Company<br />
■<br />
How did the <strong>USAA</strong> Tax Exempt Short-Term Fund (the<br />
Fund Shares) perform during the reporting period?<br />
The Fund Shares provided a total return of –0.28% versus an average<br />
return of –0.39% amongst the funds in the Lipper Short Municipal<br />
Debt Funds category. This <strong>com</strong>pares to returns of –0.27% for the<br />
Lipper Short Municipal Debt Funds Index and –3.15% for the Barclays<br />
Municipal Bond Index. The Fund Shares’ tax-exempt distributions over<br />
the prior 12 months produced a dividend yield of 1.96%, <strong>com</strong>pared to<br />
the Lipper category average of 0.86%.<br />
■<br />
What were the market conditions during the reporting<br />
period?<br />
In April, when the reporting period began, tax-exempt bonds posted<br />
gains, benefiting from supportive supply and demand conditions and<br />
the strong performance of U.S. Treasuries, which municipals tend to<br />
follow over time. In early May, yields began to rise on speculation the<br />
U.S. Federal Reserve (the Fed) might start scaling back its quantitative<br />
easing measures sooner than expected. Bond prices, which move in<br />
the opposite direction of interest rates, declined. Yields surged in June<br />
Refer to pages 9 and 10 for benchmark definitions.<br />
Past performance is no guarantee of future results.<br />
2 | <strong>USAA</strong> Tax Exempt Short-Term Fund
after Fed Chairman Ben Bernanke suggested tapering could start later<br />
in 2013. Investors, fearful that Fed tapering would lead to higher interest<br />
rates, shifted assets away from bonds. The large amount of redemptions<br />
from the municipal market drove down tax-exempt bond prices further,<br />
fueling more selling. After the Fed reiterated that any tapering would<br />
be data-dependent, municipal prices retraced some of their losses in<br />
late June.<br />
Municipal bond prices resumed their decline in July as investors<br />
sought to divine the Fed’s intentions. Yields increased, rising most in<br />
the longer maturities. Also in July, the City of Detroit filed for<br />
bankruptcy protection. Though widely anticipated, the bankruptcy<br />
likely contributed to overall market volatility. By August, it was widely<br />
believed the Fed would announce a reduction in its asset purchases<br />
following its September policy meeting. Instead, the Fed surprised the<br />
markets, announcing in September that it would make no changes to<br />
its bond-buying programs. U.S. Treasuries and equities rallied on the<br />
news that the Fed would continue its easy monetary policies at least<br />
in the near term. The tax-exempt market followed suit. As municipal<br />
bond prices stabilized, redemptions slowed.<br />
Shorter-term municipal yields increased during the reporting period<br />
overall. The yield on a three-year AAA-rated municipal, which was<br />
0.47% on March 29, 2013, hit a high of 0.91% on September 5, 2013,<br />
and ended the reporting period at 0.65%.<br />
Tax-exempt supply decreased over the course of the reporting<br />
period. Early on, many of the bonds issued were refunding bonds —<br />
wherein issuers replaced higher-yielding bonds with debt issued at<br />
lower interest rates — and as a result, the net amount of tax-exempt<br />
supply in the market remained relatively stable. As yields increased,<br />
bond issuance slowed. On the demand side, as tax-exempt investors<br />
reduced their positions, “crossover buyers” entered the market.<br />
During the reporting period, long-term municipal yields were higher<br />
than the yields of U.S. Treasuries and <strong>com</strong>parably rated corporate<br />
bonds on an absolute basis (not adjusting for the tax exemption).<br />
This was attractive to crossover buyers, who typically do not buy<br />
Managers’ Commentary on the Fund | 3
municipal debt but who purchased it opportunistically to take<br />
advantage of the attractive yields. Low supply and improving<br />
demand helped stabilize municipal bond prices.<br />
■<br />
How did you manage volatility in the Fund’s price?<br />
We continued to invest a portion of the portfolio in variable rate<br />
demand notes (VRDNs). Because they tend to remain at par (100%<br />
of face value) as interest rates move, the VRDNs owned by the Fund<br />
help us reduce share price volatility. They also possess a “demand”<br />
feature that allows the holder to sell the bond back to issue at par<br />
with notice of seven days or less. This provides us with the flexibility<br />
to act when we find attractive opportunities. Furthermore, VRDNs<br />
can generate in<strong>com</strong>e for the Fund when short-term interest rates<br />
rise because they have rates that adjust weekly. In addition to<br />
VRDNs, we invest in shorter-term bonds, which are generally less<br />
volatile than longer-term bonds.<br />
■<br />
What other strategies did you employ during the<br />
reporting period?<br />
In keeping with our investment approach, we continued to focus on<br />
in<strong>com</strong>e generation. The portfolio’s long-term in<strong>com</strong>e distribution<br />
contributes the majority of its total returns (see page 7). In recent<br />
years, the Fund’s in<strong>com</strong>e has declined as tax-exempt bonds rallied<br />
and yields fell. The increase in tax-exempt yields during the reporting<br />
period gave us the opportunity to purchase bonds with higher yields.<br />
Our experienced credit analysts continued to evaluate the bonds we<br />
consider for purchase and continuously monitored the holdings in<br />
the Fund. They have a <strong>com</strong>prehensive approach to credit analysis,<br />
which includes a focus on both an issuer’s willingness and its ability<br />
to repay its debt — an approach that has served the Fund well. We<br />
believe events such as the Detroit bankruptcy filing demonstrate the<br />
value of credit research in the municipal market.<br />
4 | <strong>USAA</strong> Tax Exempt Short-Term Fund
During the reporting period, we continued to maintain a diversified<br />
portfolio of more than 300 longer-term, primarily investment-grade<br />
municipal bonds. We continue to avoid bonds subject to the federal<br />
alternative minimum tax for individuals.<br />
■<br />
What is your outlook?<br />
Looking ahead, we expect the U.S. economy to continue its “muddle<br />
through” recovery with slow growth and low inflation in the near term.<br />
According to consensus estimates, the 2013 gross domestic product<br />
growth may remain below long-term averages. The Fed’s decision not<br />
to taper its asset purchase programs demonstrates that U.S. central<br />
bankers remain concerned about the strength of economic growth<br />
and the level of unemployment. Indeed, Fed Chairman Bernanke<br />
pointed to both issues in the press conference that followed the Fed’s<br />
September meeting.<br />
As the economy continues to improve, and the market tries to<br />
anticipate when the Fed will end its quantitative easing program, we<br />
expect to see continued volatility in interest rates. Going forward, we<br />
expect the tax-exempt market to take some of its direction from U.S<br />
Treasuries. If U.S. Treasury yields rise, municipal yields are likely to<br />
follow, but the attractiveness of municipals relative to U.S. Treasuries<br />
should help support municipal prices.<br />
Though some state and local governments continue to face budgetary<br />
challenges, we have confidence that they will continue working to<br />
maintain fiscal balance. We do not expect a material change in the<br />
longstanding debt repayment record of municipal issuers. Given the<br />
size and diversity of the tax-exempt market, occasional one-off credit<br />
problems will likely continue, but we expect them to remain the<br />
exception, not the rule.<br />
Thank you for allowing us to serve your investment needs. We<br />
appreciate your confidence in us.<br />
As interest rates rise, existing bond prices fall. • Diversification is a technique to help reduce risk<br />
and does not guarantee a profit or prevent a loss. • Some in<strong>com</strong>e may be subject to state or local<br />
taxes but not the alternative minimum tax.<br />
Managers’ Commentary on the Fund | 5
INVESTMENT OVERVIEW<br />
<strong>USAA</strong> TAX EXEMPT SHORT-TERM FUND SHARES<br />
(FUND SHARES) (Ticker Symbol: USSTX)<br />
9/30/13 3/31/13<br />
Net Assets $2,141.0 Million $2,185.7 Million<br />
Net Asset Value Per Share $10.71 $10.84<br />
Last 12 Months<br />
Tax-Exempt Dividends Per Share $0.210 $0.219<br />
Capital Gain Distributions Per Share – –<br />
Dollar-Weighted Average<br />
Portfolio Maturity † 2.0 Years 2.1 Years<br />
† Dollar-weighted average portfolio maturity is obtained by multiplying the dollar value of each investment<br />
by the number of days left to its maturity, adding those figures together, and dividing them by the total<br />
dollar value of the Fund’s portfolio.<br />
AVERAGE ANNUAL TOTAL RETURNS AS OF 9/30/13<br />
3/31/13-9/30/13 * 1 Year 5 Years 10 Years<br />
–0.28% 0.64% 3.26% 2.88%<br />
30-DAY SEC YIELD AS OF 9/30/13 ** EXPENSE RATIO AS OF 3/31/13 ***<br />
0.86% 0.55%<br />
The performance data quoted represents past performance and is no guarantee<br />
of future results. Current performance may be higher or lower than the<br />
performance data quoted. The return and principal value of an investment will<br />
fluctuate, so that an investor’s shares, when redeemed, may be worth more or<br />
less than their original cost. For performance data current to the most recent<br />
month-end, visit usaa.<strong>com</strong>.<br />
*Total returns for periods of less than one year are not annualized. This six-month return is cumulative.<br />
**Calculated as prescribed by the Securities and Exchange Commission.<br />
***The expense ratio represents the total annual operating expenses, before reductions of any expenses<br />
paid indirectly and including any acquired fund fees and expenses, as reported in the Fund’s prospectus<br />
dated August 1, 2013, and is calculated as a percentage of average net assets. This expense ratio may<br />
differ from the expense ratio disclosed in the Financial Highlights, which excludes acquired fund fees and<br />
expenses.<br />
No adjustment has been made for taxes payable by shareholders on their reinvested net investment<br />
in<strong>com</strong>e and realized capital gain distributions.<br />
6 | <strong>USAA</strong> Tax Exempt Short-Term Fund
Average Annual Compounded Returns with Reinvestment of<br />
Dividends — Periods Ended September 30, 2013<br />
Total Return = Dividend Return + Price Change<br />
10 Years 2.88% = 3.05% + (0.17)%<br />
5 Years 3.26% = 2.73% + 0.53%<br />
1 Year 0.64% = 1.93% + (1.29)%<br />
The performance data quoted represents past performance and is no guarantee<br />
of future results. Current performance may be higher or lower than the<br />
performance data quoted. The return and principal value of an investment will<br />
fluctuate, so that an investor’s shares, when redeemed, may be worth more or<br />
less than their original cost. For performance data current to the most recent<br />
month-end, visit usaa.<strong>com</strong>.<br />
Annual Total Returns and Compounded Dividend Returns<br />
for the One-Year Periods Ended September 30, 2004–<br />
September 30, 2013<br />
8<br />
Total Return<br />
Dividend Return<br />
Change in Share Price<br />
6<br />
4<br />
% Return<br />
2<br />
0<br />
-2<br />
-4<br />
-6<br />
04 05 06 07 08 09 10 11 12 13 04 05 06 07 08 09 10 11 12 13 04 05 06 07 08 09 10 11 12 13<br />
Note the role that dividend returns play in the Fund Shares’ total return<br />
over time. While share prices tend to vary, dividend returns generally are<br />
a relatively stable <strong>com</strong>ponent of total returns.<br />
Total return equals dividend return plus share price change and assumes reinvestment of all net<br />
investment in<strong>com</strong>e and realized capital gain distributions. Dividend return is the net investment in<strong>com</strong>e<br />
dividends received over the period, assuming reinvestment of all dividends. Share price change is the<br />
change in net asset value over the period adjusted for realized capital gain distributions. The total returns<br />
quoted do not reflect adjustments made to the enclosed financial statements in accordance with U.S.<br />
generally accepted accounting principles or the deduction of taxes that a shareholder would pay on<br />
distributions or the redemption of shares.<br />
Investment Overview | 7
Taxable Equivalent Illustration<br />
To match the Fund Shares’ Dividend Return for the period ended 9/30/13,<br />
and assuming marginal federal tax<br />
rates of: 28.00% 36.80%* 38.80%* 43.40%*<br />
A fully taxable investment must pay the following:<br />
Period Dividend Return<br />
10 Years 3.05% 4.23% 4.82% 4.98% 5.39%<br />
5 Years 2.73% 3.79% 4.32% 4.46% 4.83%<br />
1 Year 1.93% 2.69% 3.06% 3.16% 3.42%<br />
To match the Fund Shares’ closing 30-day SEC Yield of 0.86% on 9/30/13,<br />
A fully taxable investment must pay: 1.19% 1.35% 1.40% 1.51%<br />
This table is based on a hypothetical investment calculated for illustrative<br />
purposes only. It is not an indication of performance for any of the <strong>USAA</strong><br />
family of funds. Taxable equivalent returns or yields will vary depending on<br />
applicable tax rates.<br />
Some in<strong>com</strong>e may be subject to federal, state, or local taxes, but not the alternative minimum tax. Based<br />
on 2013 tax rates or rates in effect as of the issuance of this report.<br />
*The above marginal rates assume in<strong>com</strong>e exceeds $250,000 and investment in<strong>com</strong>e is subject to the<br />
3.80% medicare tax which is applied for in<strong>com</strong>e over a specific level, depending on the federal in<strong>com</strong>e tax<br />
filing status.<br />
8 | <strong>USAA</strong> Tax Exempt Short-Term Fund
■ CUMULATIVE PERFORMANCE COMPARISON ■<br />
$17,000<br />
$16,000<br />
$15,000<br />
$14,000<br />
$13,000<br />
$12,000<br />
$15,377<br />
$13,287<br />
$12,221<br />
$11,000<br />
$10,000<br />
$9,000<br />
9/03<br />
9/04<br />
9/05<br />
9/06<br />
9/07<br />
9/08<br />
9/09<br />
9/10<br />
9/11<br />
9/12<br />
9/13<br />
Barclays Municipal Bond Index $15,377<br />
<strong>USAA</strong> Tax Exempt Short-Term Fund Shares $13,287<br />
Lipper Short Municipal Bond Funds Index $12,221<br />
Data from 9/30/03 through 9/30/13.<br />
The graph illustrates the <strong>com</strong>parison of a $10,000 hypothetical investment in<br />
the <strong>USAA</strong> Tax Exempt Short-Term Fund Shares to the following benchmarks:<br />
■ The unmanaged, broad-based Barclays Municipal Bond Index tracks<br />
total return performance for the long-term, investment-grade, taxexempt<br />
bond market. All tax-exempt bond funds will find it difficult to<br />
outperform the Index because the Index does not reflect any<br />
deduction for fees, expenses, or taxes.<br />
■ The unmanaged Lipper Short Municipal Bond Funds Index tracks the<br />
total return performance of the 10 largest funds within the Lipper Short<br />
Municipal Debt Funds category.<br />
Past performance is no guarantee of future results, and the cumulative performance quoted does not reflect<br />
the deduction of taxes that a shareholder would pay on distributions or the redemption of shares. Indexes<br />
are unmanaged and you cannot invest directly in an index.<br />
Investment Overview | 9
■ 12-MONTH DIVIDEND YIELD COMPARISON ■<br />
5.0%<br />
4.0%<br />
3.0%<br />
2.0%<br />
1.0%<br />
0.0%<br />
2004 2005 2006 2007 2008 2009 2010 2011 2012 2013<br />
<strong>USAA</strong> Tax Exempt Short-Term Fund Shares<br />
Lipper Short Municipal Debt Funds Average<br />
The 12-month dividend yield is <strong>com</strong>puted by dividing net investment in<strong>com</strong>e dividends paid during the<br />
previous 12 months by the latest adjusted month-end net asset value. The net asset value is adjusted<br />
for a portion of the capital gains distributed during the previous nine months. The graph represents<br />
data for periods ending 9/30/04 to 9/30/13.<br />
The Lipper Short Municipal Debt Funds Average is an average performance level of all short-term<br />
municipal debt funds, reported by Lipper Inc., an independent organization that monitors the<br />
performance of mutual funds.<br />
10 | <strong>USAA</strong> Tax Exempt Short-Term Fund
<strong>USAA</strong> TAX EXEMPT SHORT-TERM FUND ADVISER SHARES<br />
(ADVISER SHARES) (Ticker Symbol: UTESX)<br />
9/30/13 3/31/13<br />
Net Assets $9.4 Million $6.6 Million<br />
Net Asset Value Per Share $10.71 $10.84<br />
Last 12 Months<br />
Tax-Exempt Dividends Per Share $0.183 $0.191<br />
Capital Gain Distributions Per Share – –<br />
AVERAGE ANNUAL TOTAL RETURNS AS OF 9/30/13<br />
3/31/13-9/30/13 * 1 Year Since Inception 8/01/10<br />
–0.40% 0.39% 2.07%<br />
30-DAY SEC YIELD AS OF 9/30/13 **<br />
Subsidized 0.59% Unsubsidized 0.22%<br />
EXPENSE RATIOS AS OF 3/31/13 ***<br />
Before Reimbursement 1.17% After Reimbursement 0.80%<br />
The performance data quoted represents past performance and is no guarantee<br />
of future results. Current performance may be higher or lower than the<br />
performance data quoted. The return and principal value of an investment will<br />
fluctuate, so that an investor’s shares, when redeemed, may be worth more or<br />
less than their original cost. For performance data current to the most recent<br />
month-end, visit usaa.<strong>com</strong>.<br />
*Total returns for periods of less than one year are not annualized. This six-month return is cumulative.<br />
**Calculated as prescribed by the Securities and Exchange Commission.<br />
***The expense ratios represent the total annual operating expenses, before reductions of any expenses<br />
paid indirectly and including any acquired fund fees and expenses, as reported in the Fund’s prospectus<br />
dated August 1, 2013, and is calculated as a percentage of average net assets. <strong>USAA</strong> Asset Management<br />
Company (the Manager) has agreed, through August 1, 2014, to make payments or waive management,<br />
administration, and other fees so that the total expenses of the Adviser Shares (exclusive of <strong>com</strong>mission<br />
recapture, expense offset arrangements, acquired fund fees and expenses, and extraordinary expenses)<br />
do not exceed an annual rate of 0.80% of the Adviser Shares’ average net assets. This reimbursement<br />
arrangement may not be changed or terminated during this time period without approval of the Trust’s<br />
Board of Trustees and may be changed or terminated by the Manager at any time after August 1, 2014.<br />
These expense ratios may differ from the expense ratios disclosed in the Financial Highlights, which<br />
excludes acquired fund fees and expenses.<br />
No adjustment has been made for taxes payable by shareholders on their reinvested net investment<br />
in<strong>com</strong>e and realized capital gain distributions.<br />
Investment Overview | 11
Taxable Equivalent Illustration<br />
To match the Adviser Shares’ closing 30-day SEC Yield of 0.59% on 9/30/13,<br />
and assuming marginal federal tax<br />
rates of: 28.00% 36.80%* 38.80%* 43.40%*<br />
A fully taxable investment must pay: 0.82% 0.93% 0.96% 1.04%<br />
This table is based on a hypothetical investment calculated for illustrative<br />
purposes only. It is not an indication of performance for any of the <strong>USAA</strong><br />
family of funds. Taxable equivalent returns or yields will vary depending<br />
on applicable tax rates.<br />
Some in<strong>com</strong>e may be subject to federal, state, or local taxes, but not the alternative minimum tax.<br />
Based on 2013 tax rates or rates in effect as of the issuance of this report.<br />
*The above marginal rates assume in<strong>com</strong>e exceeds $250,000 and investment in<strong>com</strong>e is subject to the<br />
3.80% medicare tax which is applied for in<strong>com</strong>e over a specific level, depending on the federal in<strong>com</strong>e<br />
tax filing status.<br />
12 | <strong>USAA</strong> Tax Exempt Short-Term Fund
■ CUMULATIVE PERFORMANCE COMPARISON ■<br />
$12,000<br />
$11,500<br />
$11,237<br />
$11,000<br />
$10,500<br />
$10,669<br />
$10,413<br />
$10,000<br />
$9,500<br />
7/10 11/10<br />
3/11 7/11<br />
11/11<br />
3/12<br />
7/12 11/12 3/13 7/13 9/13<br />
Barclays Municipal Bond Index $11,237<br />
<strong>USAA</strong> Tax Exempt Short-Term Fund Adviser Shares $10,669<br />
Lipper Short Municipal Bond Funds Index $10,413<br />
Data from 7/31/10 through 9/30/13.*<br />
See page 9 for benchmark definitions.<br />
The graph illustrates the <strong>com</strong>parison of a $10,000 hypothetical investment<br />
in the <strong>USAA</strong> Tax Exempt Short-Term Fund Adviser Shares to the benchmarks.<br />
*The performance of the Barclays Municipal Bond Index and the Lipper Short Municipal Bond Funds<br />
Index is calculated from the end of the month, July 31, 2010, while the Adviser Shares’ inception date is<br />
August 1, 2010. There may be a slight variation of performance numbers because of this difference.<br />
Past performance is no guarantee of future results, and the cumulative performance quoted does not reflect<br />
the deduction of taxes that a shareholder would pay on distributions or the redemption of shares. Indexes<br />
are unmanaged and you cannot invest directly in an index.<br />
Investment Overview | 13
■ TOP 10 INDUSTRIES ■<br />
AS OF 9/30/13<br />
(% of Net Assets)<br />
Hospital 19.8%<br />
- - - - - - - - - - - - - - - - - - - - - - - - - - - - - - - - - - - - - - - - - - - - - - - - - - - - - - - - - - - - - - - - - - - - - - - - - - - - - - - - - - - - - - - - -<br />
General Obligation 19.5%<br />
- - - - - - - - - - - - - - - - - - - - - - - - - - - - - - - - - - - - - - - - - - - - - - - - - - - - - - - - - - - - - - - -<br />
Electric Utilities 12.4%<br />
- - - - - - - - - - - - - - - - - - - - - - - - - - - - - - - - - - - - - - - - - - - - - - - - - - - - - - - - - - - - - - - - - - - - - - -<br />
Appropriated Debt<br />
- - - - - - - - - - - - - - - - - - - - - - - - - - - - - - - - - - - - - - - - - - - - - - - - - - - - - - - - - - - - - - - -<br />
8.2%<br />
Special Assessment/Tax/Fee<br />
- - - - - - - - - - - - - - - - - - - - - - - - - - - - - - - - - - - - - - - - - -<br />
5.9%<br />
Education<br />
- - - - - - - - - - - - - - - - - - - - - - - - - - - - - - - - - - - - - - - - - - - - - - - - - - - - - - - - - - - - - - - - - - - - - - - - - - - - - - - - - - - - -<br />
5.2%<br />
Toll Roads<br />
- - - - - - - - - - - - - - - - - - - - - - - - - - - - - - - - - - - - - - - - - - - - - - - - - - - - - - - - - - - - - - - - - - - - - - - - - - - - - - - - - - - -<br />
3.4%<br />
Nursing/CCRC<br />
- - - - - - - - - - - - - - - - - - - - - - - - - - - - - - - - - - - - - - - - - - - - - - - - - - - - - - - - - - - - - - - - - - - - - - - - - - -<br />
3.2%<br />
Environmental & Facilities Services<br />
- - - - - - - - - - - - - - - - - - - - - - - - - - -<br />
3.1%<br />
Sales Tax<br />
- - - - - - - - - - - - - - - - - - - - - - - - - - - - - - - - - - - - - - - - - - - - - - - - - - - - - - - - - - - - - - - - - - - - - - - - - - - - - - - - - - - - - -<br />
2.8%<br />
You will find a <strong>com</strong>plete list of securities that the Fund owns on pages 18–31.<br />
14 | <strong>USAA</strong> Tax Exempt Short-Term Fund
■ PORTFOLIO RATINGS MIX — 9/30/13 ■<br />
BBB<br />
20.3%<br />
A<br />
28.0%<br />
AA<br />
18.2%<br />
AAA<br />
0.3%<br />
Unrated<br />
7.4%<br />
Below<br />
Investment-Grade<br />
0.2%<br />
Short-Term<br />
Investment-Grade<br />
25.6%<br />
The four highest long-term credit ratings, in descending order of credit quality,<br />
are AAA, AA, A, and BBB. These categories represent investment-grade quality.<br />
This chart reflects the highest rating of a Nationally Recognized Statistical<br />
Rating Organization (NRSRO). Any of the Fund’s securities that are not rated<br />
by these agencies appear in the chart above as “Unrated”, but are monitored<br />
and evaluated by <strong>USAA</strong> Asset Management Company on an ongoing basis.<br />
Government securities that are issued or guaranteed as to principal and interest<br />
by the U.S. government are not rated but are treated as AAA for credit quality<br />
purposes. Securities within the Short-Term Investment-Grade category are<br />
those that are ranked in the top two short-term credit ratings for the<br />
respective rating agency (which are A-1 and A-2 for S&P and P-1 and P-2 for<br />
Moody’s, F1 and F2 for Fitch, and R-1 and R-2 for Dominion). Short-term<br />
ratings are generally assigned to those obligations considered short-term;<br />
such obligations generally have an original maturity not exceeding 13 months,<br />
unless explicitly noted. The Below Investment-Grade category includes both<br />
long-term and short-term securities.<br />
Percentages are of the total market value of the Fund’s investments.<br />
You will find a <strong>com</strong>plete list of securities that the Fund owns on pages 18-31.<br />
Investment Overview | 15
PORTFOLIO OF INVESTMENTS<br />
September 30, 2013 (unaudited)<br />
■ CATEGORIES AND DEFINITIONS<br />
Fixed-rate instruments — consist of municipal bonds, notes, and<br />
<strong>com</strong>mercial paper. The interest rate is constant to maturity. Prior<br />
to maturity, the market price of a fixed-rate instrument generally<br />
varies inversely to the movement of interest rates.<br />
Put bonds — provide the right to sell the bond at face value at specific<br />
tender dates prior to final maturity. The put feature shortens the<br />
effective maturity of the security.<br />
Variable-rate demand notes (VRDNs) — provide the right to sell the<br />
security at face value on either that day or within the rate-reset period.<br />
The interest rate is adjusted at a stipulated daily, weekly, monthly,<br />
quarterly, or other specified time interval to reflect current market<br />
conditions. VRDNs will normally trade as if the maturity is the earlier<br />
put date, even though stated maturity is longer.<br />
Adjustable-rate notes — similar to VRDNs in the fact that the interest<br />
rate is adjusted periodically to reflect current market conditions.<br />
These interest rates are adjusted at a given time, such as monthly<br />
or quarterly. However, these securities do not offer the right to sell<br />
the security at face value prior to maturity.<br />
Credit enhancements — add the financial strength of the provider of<br />
the enhancement to support the issuer’s ability to repay the principal<br />
and interest payments when due. The enhancement may be provided<br />
by a high-quality bank, insurance <strong>com</strong>pany or other corporation, or<br />
a collateral trust. The enhancements do not guarantee the market<br />
values of the securities.<br />
(INS)<br />
Principal and interest payments are insured by one of the<br />
following: ACA Financial Guaranty Corp., Assured Guaranty<br />
16 | <strong>USAA</strong> Tax Exempt Short-Term Fund
Corp., Assured Guaranty Municipal Corp., Financial Guaranty<br />
Insurance Co., National Public Finance Guarantee Corp.,<br />
Radian Asset Assurance, Inc., or XL Capital Assurance.<br />
Although bond insurance reduces the risk of loss due to<br />
default by an issuer, such bonds remain subject to the risk<br />
that value may fluctuate for other reasons, and there is no<br />
assurance that the insurance <strong>com</strong>pany will meet its<br />
obligations.<br />
(LIQ)<br />
(LOC)<br />
(NBGA)<br />
Liquidity enhancement that may, under certain<br />
circumstances, provide for repayment of principal and<br />
interest upon demand from one of the following: Bank of<br />
America, N.A., Bank of New York Mellon, Citibank, N.A.,<br />
DEPFA Bank plc, Deutsche Postbank, Dexia Credit Local,<br />
JPMorgan Chase Bank, N.A., Key Bank, N.A., or Wells Fargo<br />
Bank, N.A.<br />
Principal and interest payments are guaranteed by a bank<br />
letter of credit or other bank credit agreement.<br />
Principal and interest payments or, under certain<br />
circumstances, underlying mortgages are guaranteed by a<br />
nonbank guarantee agreement from one of the following:<br />
Duke Realty Corp., Fannie Mae, or Texas Permanent School<br />
Fund.<br />
■ PORTFOLIO ABBREVIATION(S) AND DESCRIPTION(S)<br />
CSD<br />
EDA<br />
EDC<br />
ETM<br />
IDA<br />
IDB<br />
ISD<br />
MTA<br />
PRE<br />
USD<br />
Central School District<br />
Economic Development Authority<br />
Economic Development Corp.<br />
Escrowed to final maturity<br />
Industrial Development Authority/Agency<br />
Industrial Development Board<br />
Independent School District<br />
Metropolitan Transportation Authority<br />
Prerefunded to a date prior to maturity<br />
Unified School District<br />
Portfolio of Investments | 17
INVESTMENTS<br />
Principal<br />
Market<br />
Amount Coupon Final Value<br />
(000) Security Rate Maturity (000)<br />
FIXED-RATE INSTRUMENTS (47.6%)<br />
Alabama (0.3%)<br />
$ 1,200 Montgomery Medical Clinic Board 4.50% 3/01/2014 $ 1,218<br />
2,480 Montgomery Medical Clinic Board 4.50 3/01/2015 2,594<br />
2,595 Montgomery Medical Clinic Board 4.50 3/01/2016 2,775<br />
6,587<br />
Arizona (0.5%)<br />
1,000 Pinal County Correctional Facilities IDA (INS) 5.25 10/01/2013 1,000<br />
1,710 Pinal County Correctional Facilities IDA (INS) 5.25 10/01/2014 1,765<br />
5,365 State (INS) 5.00 10/01/2015 5,803<br />
1,000 Yavapai County IDA 5.00 8/01/2019 1,097<br />
1,105 Yavapai County IDA 5.00 8/01/2020 1,212<br />
10,877<br />
California (3.9%)<br />
5,000 Golden State Tobacco Securitization Corp. 5.00 6/01/2015 5,252<br />
7,000 Golden State Tobacco Securitization Corp. 5.00 6/01/2016 7,535<br />
3,000 Golden State Tobacco Securitization Corp. 5.00 6/01/2017 3,291<br />
1,125 Irvine 5.00 9/02/2021 1,230<br />
5,000 Irvine USD Community Facilities District (INS) 5.00 9/01/2014 5,193<br />
3,730 Irvine USD Community Facilities District (INS) 5.00 9/01/2015 4,008<br />
5,885 Irvine USD Community Facilities District (INS) 5.00 9/01/2016 6,482<br />
500 Los Angeles County 5.00 3/01/2021 578<br />
1,000 Los Angeles County 5.00 9/01/2021 1,158<br />
3,785 Lynwood USD 1.10 (a) 8/01/2014 3,767<br />
14,785 Public Works Board 5.00 10/01/2015 16,143<br />
2,000 Public Works Board 5.00 4/01/2019 2,335<br />
2,700 Public Works Board 5.00 11/01/2019 3,174<br />
1,000 Public Works Board 5.00 4/01/2020 1,172<br />
1,500 Public Works Board 5.00 4/01/2021 1,738<br />
2,000 Salinas USD (INS) 4.21 (a) 6/01/2014 1,995<br />
1,000 Salinas USD (INS) 4.21 (a) 10/01/2014 995<br />
15,000 State 5.00 10/01/2017 17,323<br />
83,369<br />
Colorado (0.7%)<br />
125 Beacon Point Metropolitan District<br />
(LOC - Compass Bank) 4.38 12/01/2015 125<br />
1,865 Denver Health and Hospital Auth. 5.00 12/01/2014 1,943<br />
1,000 Denver Health and Hospital Auth. 5.00 12/01/2015 1,073<br />
1,475 Denver Health and Hospital Auth. 5.00 12/01/2016 1,617<br />
18 | <strong>USAA</strong> Tax Exempt Short-Term Fund
Principal<br />
Market<br />
Amount Coupon Final Value<br />
(000) Security Rate Maturity (000)<br />
$ 2,000 Health Facilities Auth. 5.00% 6/01/2015 $ 2,133<br />
110 Health Facilities Auth. (ETM) 5.00 11/15/2015 121<br />
1,890 Health Facilities Auth. 5.00 11/15/2015 2,062<br />
2,840 Health Facilities Auth. 5.00 11/15/2016 3,187<br />
160 Health Facilities Auth. (ETM) 5.00 11/15/2016 182<br />
1,605 High Plains Metropolitan District<br />
(LOC - Compass Bank) 4.38 12/01/2015 1,652<br />
14,095<br />
Connecticut (0.1%)<br />
500 West Haven 4.00 8/01/2014 511<br />
2,235 West Haven (INS) 5.00 8/01/2020 2,462<br />
2,973<br />
District of Columbia (0.1%)<br />
2,245 Community Academy (INS) 4.50 5/01/2017 2,252<br />
Florida (3.7%)<br />
4,500 Gulf Breeze 3.10 12/01/2020 4,545<br />
1,385 Higher Educational Facilities Financing Auth. 5.00 4/01/2021 1,536<br />
1,000 Highlands County Health Facilities 5.00 11/15/2014 1,052<br />
1,000 Highlands County Health Facilities 5.00 11/15/2015 1,091<br />
1,235 Highlands County Health Facilities 5.00 11/15/2016 1,386<br />
3,500 Highlands County Health Facilities 5.00 11/15/2016 3,935<br />
10,000 Hurricane Catastrophe Fund Finance Corp. 5.00 7/01/2014 10,361<br />
1,000 Jacksonville 5.00 10/01/2019 1,160<br />
4,580 Jacksonville 5.00 10/01/2020 5,340<br />
1,720 Lee County IDA 3.75 10/01/2017 1,677<br />
3,165 Lee County IDA 4.75 10/01/2022 3,061<br />
1,775 Miami Beach Health Facilities Auth. 5.00 11/15/2019 1,981<br />
1,250 Miami Beach Health Facilities Auth. 5.00 11/15/2020 1,370<br />
7,500 Miami-Dade County IDA 3.75 12/01/2018 7,637<br />
2,000 Orange County Health Facilities Auth. 5.00 10/01/2013 2,000<br />
1,200 Orange County Health Facilities Auth. 5.00 10/01/2016 1,330<br />
2,000 Palm Beach County School Board (INS) 5.00 8/01/2015 2,159<br />
3,290 Palm Beach County School Board 5.50 8/01/2015 3,582<br />
2,820 Pinellas County Educational Facilities Auth. 4.00 10/01/2020 2,863<br />
10,000 Sunshine State Governmental Financing Commission 5.00 9/01/2017 11,393<br />
8,975 Sunshine State Governmental Financing Commission 5.00 9/01/2018 10,218<br />
79,677<br />
Georgia (0.8%)<br />
3,000 Fulton County Dev. Auth. (ETM) 4.00 11/15/2016 3,306<br />
3,000 Municipal Electric Auth. 5.00 1/01/2016 3,286<br />
3,415 Private Colleges and Universities Auth. 5.00 10/01/2018 3,762<br />
1,265 Private Colleges and Universities Auth. 5.00 10/01/2019 1,397<br />
Portfolio of Investments | 19
Principal<br />
Market<br />
Amount Coupon Final Value<br />
(000) Security Rate Maturity (000)<br />
$ 1,255 Private Colleges and Universities Auth. 5.00% 10/01/2019 $ 1,385<br />
3,770 Private Colleges and Universities Auth. 5.00 10/01/2020 4,165<br />
17,301<br />
Guam (0.2%)<br />
1,000 Education Financing Foundation 4.00 10/01/2013 1,000<br />
760 Education Financing Foundation 5.00 10/01/2014 772<br />
1,000 Power Auth. 5.00 10/01/2019 1,148<br />
1,500 Power Auth. 5.00 10/01/2020 1,728<br />
4,648<br />
Illinois (4.0%)<br />
20,000 Chicago (INS) 3.18 (a) 1/01/2018 17,321<br />
15,000 Chicago Board of Education (INS) 2.54 (a) 12/01/2013 14,983<br />
7,140 Finance Auth. 4.50 2/15/2016 7,563<br />
3,720 Finance Auth. 5.25 5/01/2016 4,027<br />
5,940 Finance Auth. 4.50 2/15/2017 6,359<br />
1,000 Finance Auth. 5.00 7/01/2018 1,090<br />
2,410 Finance Auth. 5.00 8/15/2018 2,716<br />
1,000 Finance Auth. 5.00 7/01/2019 1,079<br />
1,420 Finance Auth. 5.00 7/01/2020 1,524<br />
490 Housing Dev. Auth. 4.15 1/01/2014 493<br />
130 Housing Dev. Auth. 4.20 1/01/2014 131<br />
450 Housing Dev. Auth. 4.15 7/01/2014 458<br />
565 Housing Dev. Auth. 4.20 7/01/2015 584<br />
305 Housing Dev. Auth. 4.30 1/01/2016 317<br />
140 Housing Dev. Auth. 4.35 1/01/2016 146<br />
5,000 Railsplitter Tobacco Settlement Auth. 5.00 6/01/2016 5,486<br />
6,500 Railsplitter Tobacco Settlement Auth. 5.00 6/01/2018 7,315<br />
4,160 Railsplitter Tobacco Settlement Auth. 5.25 6/01/2020 4,724<br />
1,090 Railsplitter Tobacco Settlement Auth. 5.25 6/01/2021 1,230<br />
3,000 State (INS) 5.00 1/01/2016 3,238<br />
5,000 State 4.50 6/15/2016 5,475<br />
86,259<br />
Indiana (2.5%)<br />
10,000 Finance Auth. 4.90 1/01/2016 10,750<br />
10,000 Finance Auth. 2.20 2/01/2016 10,036<br />
20,000 Jasper County (INS) 5.60 11/01/2016 22,122<br />
10,000 Whiting Environmental Facilities 5.00 7/01/2017 11,333<br />
54,241<br />
Iowa (0.5%)<br />
10,000 Finance Auth. (INS) 5.00 7/01/2014 10,327<br />
20 | <strong>USAA</strong> Tax Exempt Short-Term Fund
Principal<br />
Market<br />
Amount Coupon Final Value<br />
(000) Security Rate Maturity (000)<br />
Kansas (0.1%)<br />
$ 2,000 La Cygne (INS) 4.05% 3/01/2015 $ 2,100<br />
Louisiana (0.5%)<br />
1,500 Office Facilities Corp. 5.00 3/01/2016 1,646<br />
3,455 Public Facilities Auth. 2.88 11/01/2015 3,548<br />
5,000 Tobacco Settlement Financing Corp. 5.00 5/15/2022 5,564<br />
10,758<br />
Maine (0.1%)<br />
2,500 Jay 4.85 5/01/2019 2,564<br />
Maryland (0.5%)<br />
10,000 Anne Arundel County 4.10 7/01/2014 10,069<br />
Massachusetts (0.9%)<br />
11,500 Dev. Finance Agency 2.88 10/01/2014 11,811<br />
600 Dev. Finance Agency 5.00 1/01/2015 626<br />
630 Dev. Finance Agency 5.00 1/01/2016 674<br />
835 Dev. Finance Agency 5.00 1/01/2017 907<br />
1,065 Dev. Finance Agency 5.00 1/01/2018 1,175<br />
1,395 Dev. Finance Agency 5.00 1/01/2019 1,533<br />
2,015 Health and Educational Facilities Auth. 5.00 7/01/2016 2,189<br />
18,915<br />
Michigan (1.9%)<br />
25,000 Dickinson County EDC 4.80 11/01/2018 25,721<br />
2,165 Grand Traverse County Hospital Finance Auth. 5.00 7/01/2018 2,481<br />
2,625 Grand Traverse County Hospital Finance Auth. 5.00 7/01/2019 3,019<br />
1,000 Hospital Finance Auth. 5.00 11/15/2014 1,038<br />
1,000 Hospital Finance Auth. 5.00 11/15/2015 1,068<br />
6,440 Housing Dev. Auth. 1.00 10/01/2014 6,451<br />
39,778<br />
Minnesota (0.4%)<br />
5,000 Agricultural and Economic Development Board (b) 4.75 2/15/2015 5,040<br />
1,335 Agricultural and Economic Development Board (INS) 5.00 2/15/2015 1,410<br />
565 Agricultural and Economic Development Board (INS) 5.00 2/15/2016 616<br />
1,000 Higher Education Facilities Auth. 4.00 4/01/2015 1,053<br />
250 St. Paul Housing and Redevelopment Auth. 5.00 5/15/2014 257<br />
250 St. Paul Housing and Redevelopment Auth. 5.00 5/15/2015 266<br />
300 St. Paul Housing and Redevelopment Auth. 5.00 5/15/2016 328<br />
325 St. Paul Housing and Redevelopment Auth. 5.25 5/15/2017 360<br />
9,330<br />
Portfolio of Investments | 21
Principal<br />
Market<br />
Amount Coupon Final Value<br />
(000) Security Rate Maturity (000)<br />
Mississippi (0.4%)<br />
$ 2,280 Hospital Equipment and Facilities Auth. 5.00% 8/15/2014 $ 2,363<br />
2,960 Hospital Equipment and Facilities Auth. 5.00 12/01/2014 3,070<br />
1,000 Hospital Equipment and Facilities Auth. 5.00 8/15/2015 1,071<br />
2,000 Hospital Equipment and Facilities Auth. 5.00 8/15/2016 2,197<br />
8,701<br />
Missouri (0.3%)<br />
1,135 Cape Girardeau County IDA 5.00 6/01/2014 1,158<br />
1,000 Cape Girardeau County IDA 5.00 6/01/2017 1,078<br />
1,055 Joint Municipal Electric Utility Commission (INS) 5.00 1/01/2015 1,100<br />
3,630 Riverside IDA (INS) 4.50 5/01/2016 3,838<br />
7,174<br />
New Jersey (7.1%)<br />
12,800 Atlantic City 1.50 2/04/2014 12,813<br />
6,000 Berkeley Township 1.50 12/19/2013 6,009<br />
8,064 Bridgeton 1.50 2/28/2014 8,083<br />
2,219 East Rutherford 2.00 3/20/2014 2,226<br />
10,000 EDA 5.25 9/01/2019 11,662<br />
5,000 EDA 5.00 6/15/2020 5,533<br />
7,000 EDA 5.00 6/15/2021 7,691<br />
5,055 Health Care Facilities Financing Auth. 4.00 11/15/2016 5,415<br />
2,000 Health Care Facilities Financing Auth. 5.00 7/01/2018 2,270<br />
2,000 Health Care Facilities Financing Auth. 5.00 7/01/2019 2,273<br />
2,000 Health Care Facilities Financing Auth. 5.00 7/01/2020 2,279<br />
17,580 Jersey City 1.50 12/13/2013 17,619<br />
5,965 Jersey City 2.00 12/13/2013 5,976<br />
1,500 Lyndhurst Township 1.50 2/14/2014 1,503<br />
3,320 Lyndhurst Township 1.75 3/20/2014 3,334<br />
5,000 Newark 2.00 12/11/2013 5,010<br />
1,080 Newark 2.00 12/11/2013 1,082<br />
6,000 Newark 1.50 2/20/2014 6,005<br />
5,000 Seaside Heights 2.00 12/19/2013 5,008<br />
9,745 Tobacco Settlement Financing Corp. 5.00 6/01/2014 9,957<br />
9,640 Transportation Trust Fund Auth. 5.75 9/15/2014 9,684<br />
15,000 Transportation Trust Fund Auth. (PRE) 5.25 12/15/2017 16,605<br />
4,400 Wall Township 1.50 4/11/2014 4,414<br />
152,451<br />
New Mexico (0.0%)<br />
900 Sandoval County 4.00 6/01/2015 922<br />
New York (7.4%)<br />
1,000 Albany IDA 5.50 11/15/2013 1,007<br />
3,500 Albany IDA 4.25 11/15/2014 3,647<br />
22 | <strong>USAA</strong> Tax Exempt Short-Term Fund
Principal<br />
Market<br />
Amount Coupon Final Value<br />
(000) Security Rate Maturity (000)<br />
$ 4,480 Albany IDA 5.00% 11/15/2015 $ 4,877<br />
3,030 Corning Town 1.25 8/20/2014 3,037<br />
3,010 Dormitory Auth. 5.00 7/01/2014 3,117<br />
1,865 Dormitory Auth. 5.00 7/01/2014 1,911<br />
5,000 Dormitory Auth. 5.20 2/15/2015 5,021<br />
3,145 Dormitory Auth. 5.00 7/01/2015 3,390<br />
4,095 Dormitory Auth. 5.00 7/01/2015 4,411<br />
2,000 Dormitory Auth. 4.00 8/15/2015 2,127<br />
720 Dormitory Auth. 4.00 2/15/2016 774<br />
3,295 Dormitory Auth. 5.00 7/01/2016 3,649<br />
2,000 Dormitory Auth. 5.00 7/01/2016 2,144<br />
4,430 East Ramapo CSD 1.75 10/25/2013 4,432<br />
2,000 Environmental Facilities Corp. 2.75 7/01/2017 2,022<br />
3,786 Glen Cove 2.50 10/24/2013 3,787<br />
7,203 Glen Cove 2.50 1/10/2014 7,218<br />
3,020 Long Beach 3.00 12/20/2013 3,027<br />
3,000 Long Island Power Auth. 5.25 6/01/2014 3,094<br />
20,000 New York City 5.00 8/01/2016 22,426<br />
1,510 Newburgh 3.50 8/07/2014 1,513<br />
10,000 Rockland County 2.25 3/14/2014 10,033<br />
180 Rockland County 2.00 4/09/2014 180<br />
2,350 Rockland County 2.00 6/05/2014 2,358<br />
10,000 Rockland County 1.75 6/27/2014 10,004<br />
500 Rockland County 4.00 12/15/2015 525<br />
1,345 Rockland County 3.50 10/01/2016 1,409<br />
550 Rockland County 5.00 12/15/2016 602<br />
1,410 Rockland County 3.50 10/01/2017 1,471<br />
550 Rockland County 5.00 12/15/2017 607<br />
1,475 Rockland County 3.50 10/01/2018 1,510<br />
550 Rockland County 5.00 12/15/2018 602<br />
1,520 Rockland County 3.50 10/01/2019 1,540<br />
1,575 Rockland County 3.50 10/01/2020 1,571<br />
6,500 Solvay 1.50 2/06/2014 6,511<br />
2,000 St. Lawrence County 1.50 8/29/2014 2,009<br />
2,500 Suffolk County EDC 5.00 7/01/2019 2,813<br />
2,640 Suffolk County EDC 5.00 7/01/2020 2,973<br />
8,654 Utica 1.50 5/08/2014 8,686<br />
3,000 Westchester County Health Care Corp. 5.00 11/01/2015 3,246<br />
3,930 Yonkers 5.00 10/01/2017 4,392<br />
7,310 Yonkers 5.00 10/01/2018 8,229<br />
157,902<br />
North Carolina (0.4%)<br />
2,000 Eastern Municipal Power Agency 5.00 1/01/2016 2,193<br />
2,100 Medical Care Commission 4.38 7/01/2017 2,232<br />
Portfolio of Investments | 23
Principal<br />
Market<br />
Amount Coupon Final Value<br />
(000) Security Rate Maturity (000)<br />
$ 3,855 Medical Care Commission 5.00% 7/01/2018 $ 4,404<br />
8,829<br />
Ohio (0.9%)<br />
4,515 American Municipal Power, Inc. 5.00 2/15/2017 5,080<br />
4,500 Buckeye Tobacco Settlement Financing Auth. 5.00 6/01/2015 4,726<br />
5,300 Coventry Local School District 1.75 1/15/2014 5,312<br />
1,530 Hancock County 4.00 12/01/2016 1,640<br />
1,875 Hancock County 4.25 12/01/2017 2,044<br />
18,802<br />
Oklahoma (0.1%)<br />
1,580 Cherokee Nation (INS) (b) 4.30 12/01/2016 1,675<br />
1,090 Norman Regional Hospital Auth. (INS) 5.00 9/01/2014 1,107<br />
2,782<br />
Pennsylvania (2.4%)<br />
12,250 Allegheny County Hospital Dev. Auth. 5.00 5/15/2016 13,543<br />
7,975 Coatesville School District 3.46 (a) 8/15/2018 6,784<br />
1,165 Coatesville School District 3.86 (a) 8/15/2019 942<br />
5,305 Coatesville School District 4.13 (a) 8/15/2020 4,055<br />
1,980 Cumberland County Municipal Auth. 3.25 12/01/2022 1,867<br />
1,065 Delaware County 4.00 10/01/2015 1,109<br />
1,110 Delaware County 4.00 10/01/2016 1,168<br />
1,155 Delaware County 5.00 10/01/2017 1,257<br />
1,195 Delaware County 5.00 10/01/2018 1,301<br />
3,740 Higher Educational Facilities Auth. 5.00 5/15/2016 4,135<br />
1,500 Montgomery County IDA 5.00 11/15/2016 1,643<br />
2,000 Montgomery County IDA 5.00 11/15/2017 2,169<br />
5,175 St. Mary Hospital Auth. 4.00 11/15/2016 5,578<br />
5,170 St. Mary Hospital Auth. 4.00 11/15/2016 5,573<br />
51,124<br />
Puerto Rico (0.8%)<br />
14,000 Government Dev. Bank (INS) 4.75 12/01/2015 13,770<br />
2,000 Industrial, Tourist, Educational, Medical and<br />
Environmental Control Facilities Financing Auth. 5.00 4/01/2017 1,979<br />
1,000 Industrial, Tourist, Educational, Medical and<br />
Environmental Control Facilities Financing Auth. 5.00 4/01/2019 959<br />
700 Industrial, Tourist, Educational, Medical and<br />
Environmental Control Facilities Financing Auth. 4.00 4/01/2020 622<br />
17,330<br />
South Carolina (1.8%)<br />
1,485 Association of Governmental Organizations<br />
Educational Facilities Corp. (INS) 4.00 12/01/2016 1,576<br />
24 | <strong>USAA</strong> Tax Exempt Short-Term Fund
Principal<br />
Market<br />
Amount Coupon Final Value<br />
(000) Security Rate Maturity (000)<br />
$23,000 Berkeley County 4.88% 10/01/2014 $ 23,752<br />
1,000 Lexington County Health Services District, Inc. 5.00 11/01/2014 1,045<br />
3,950 Piedmont Municipal Power Agency 5.00 1/01/2015 4,170<br />
7,715 Piedmont Municipal Power Agency 5.00 1/01/2016 8,426<br />
38,969<br />
Tennessee (0.1%)<br />
2,750 Shelby County Health, Educational, and Housing<br />
Facility Board 5.00 9/01/2014 2,864<br />
Texas (2.9%)<br />
5,170 Brazos River Auth. 4.90 10/01/2015 5,493<br />
3,000 Dallas Fort Worth International Airport 5.00 11/01/2016 3,361<br />
1,335 Gregg County Health Facilities Dev. Corp. 5.00 10/01/2015 1,421<br />
2,105 Gregg County Health Facilities Dev. Corp. 5.00 10/01/2016 2,289<br />
6,035 Harris County Cultural Education Facilities 5.00 2/15/2015 6,386<br />
4,500 Harris County Cultural Education Facilities 5.00 2/15/2016 4,914<br />
535 Midlothian Dev. Auth. (INS) 5.00 11/15/2013 536<br />
560 Midlothian Dev. Auth. (INS) 5.00 11/15/2014 571<br />
390 Midlothian Dev. Auth. (INS) 5.00 11/15/2015 401<br />
1,000 Northwest ISD (NBGA) 4.07 (a) 2/15/2014 999<br />
7,175 Red River Auth. 4.45 6/01/2020 7,664<br />
1,000 San Leanna Education Facilities Corp. 5.00 6/01/2015 1,058<br />
1,585 San Leanna Education Facilities Corp. 5.00 6/01/2017 1,745<br />
1,220 Tarrant County Cultural Education Facilities<br />
Finance Corp. 5.00 11/15/2013 1,226<br />
1,100 Tarrant County Cultural Education Facilities<br />
Finance Corp. 5.25 11/15/2013 1,103<br />
595 Tarrant County Cultural Education Facilities<br />
Finance Corp. 4.63 11/15/2014 609<br />
1,265 Tarrant County Cultural Education Facilities<br />
Finance Corp. 5.25 11/15/2014 1,288<br />
1,470 Tarrant County Cultural Education Facilities<br />
Finance Corp. 5.00 5/15/2015 1,527<br />
1,250 Tarrant County Cultural Education Facilities<br />
Finance Corp. 5.75 11/15/2015 1,279<br />
1,000 Tarrant County Cultural Education Facilities<br />
Finance Corp. 5.00 11/15/2017 1,094<br />
2,810 Tyler Health Facilities Dev. Corp. 5.00 11/01/2013 2,820<br />
4,575 Tyler Health Facilities Dev. Corp. 5.00 11/01/2014 4,767<br />
3,360 Tyler Health Facilities Dev. Corp. 5.00 11/01/2015 3,606<br />
6,155 Tyler Health Facilities Dev. Corp. 5.25 11/01/2016 6,798<br />
62,955<br />
Portfolio of Investments | 25
Principal<br />
Market<br />
Amount Coupon Final Value<br />
(000) Security Rate Maturity (000)<br />
U.S. Virgin Islands (0.2%)<br />
$ 2,250 Water and Power Auth. 4.75% 7/01/2015 $ 2,290<br />
2,700 Water and Power Auth. 4.75 7/01/2016 2,761<br />
5,051<br />
Virginia (0.5%)<br />
3,200 Housing Dev. Auth. 3.05 3/01/2018 3,345<br />
3,200 Housing Dev. Auth. 3.05 9/01/2018 3,344<br />
3,506 Marquis Community Dev. Auth., acquired<br />
3/01/2012; cost $2,736 (b),(c) 5.10 9/01/2036 2,641<br />
5,111 Marquis Community Dev. Auth., acquired<br />
3/01/2012; cost $444 (b),(c) 5.63 (a) 9/01/2041 484<br />
9,814<br />
West Virginia (0.5%)<br />
10,000 EDA 3.25 5/01/2019 10,132<br />
Wisconsin (0.1%)<br />
1,200 Health and Educational Facilities Auth. 5.00 8/15/2021 1,353<br />
Total Fixed-Rate Instruments (cost: $989,389) 1,023,275<br />
PUT BONDS (24.3%)<br />
Alabama (0.2%)<br />
5,000 Mobile IDB 5.00 6/01/2034 5,306<br />
Arizona (3.3%)<br />
16,000 Health Facilities Auth. 1.92 (d) 2/01/2048 15,601<br />
20,000 Health Facilities Auth. 1.92 (d) 2/01/2048 19,398<br />
20,400 Maricopa County Pollution Control Corp. 4.00 6/01/2043 21,166<br />
15,000 Navajo County 5.50 6/01/2034 15,462<br />
71,627<br />
California (4.2%)<br />
5,000 Bay Area Toll Auth. 0.98 (d) 4/01/2045 4,993<br />
15,000 Bay Area Toll Auth. 0.77 (d) 4/01/2047 14,990<br />
4,000 Contra Costa Transportation Auth. 0.49 (d) 3/01/2034 3,988<br />
5,585 Economic Recovery 4.00 7/01/2023 5,739<br />
11,875 Economic Recovery 5.00 7/01/2023 12,301<br />
5,000 Health Facilities Financing Auth. 5.00 7/01/2027 5,169<br />
20,000 Hemet USD 0.92 (d) 10/01/2036 20,000<br />
5,000 Municipal Finance Auth. 0.70 2/01/2039 4,979<br />
3,750 Pollution Control Financing Auth. (b) 0.70 8/01/2024 3,750<br />
6,925 Sacramento USD (INS) 3.07 (d) 3/01/2040 6,954<br />
4,000 Twin Rivers USD (INS) 3.20 6/01/2027 4,000<br />
4,000 Twin Rivers USD (INS) 3.20 6/01/2035 4,000<br />
90,863<br />
26 | <strong>USAA</strong> Tax Exempt Short-Term Fund
Principal<br />
Market<br />
Amount Coupon Final Value<br />
(000) Security Rate Maturity (000)<br />
Colorado (1.1%)<br />
$ 3,000 E-470 Public Highway Auth. 1.82% (d) 9/01/2039 $ 3,001<br />
10,000 E-470 Public Highway Auth. 2.79 (d) 9/01/2039 10,028<br />
10,500 Health Facilities Auth. 4.00 10/01/2040 11,253<br />
24,282<br />
Florida (0.7%)<br />
5,000 Miami-Dade County IDA 4.00 10/01/2018 5,154<br />
6,000 Miami-Dade County School Board 5.00 5/01/2032 6,613<br />
2,500 Palm Beach County School Board 5.00 8/01/2032 2,780<br />
14,547<br />
Georgia (0.7%)<br />
10,000 Appling County Dev. Auth 2.40 1/01/2038 9,668<br />
5,000 Monroe County Dev. Auth. 2.00 9/01/2037 4,955<br />
14,623<br />
Illinois (0.9%)<br />
15,000 Chicago Board of Education 0.90 (d) 3/01/2036 15,068<br />
1,250 Educational Facilities Auth. 4.13 3/01/2030 1,332<br />
2,500 Educational Facilities Auth. 3.40 11/01/2036 2,620<br />
19,020<br />
Indiana (0.4%)<br />
3,460 Plainfield (NBGA) 4.88 2/01/2035 3,483<br />
5,000 Whiting Environmental Facilities 2.80 6/01/2044 5,076<br />
8,559<br />
Louisiana (0.7%)<br />
10,000 De Soto Parish 3.25 1/01/2019 10,219<br />
4,000 St. Charles Parish 4.00 12/01/2040 3,997<br />
14,216<br />
Massachusetts (0.2%)<br />
5,000 Dev. Finance Agency 0.65 (d) 10/01/2040 4,993<br />
Michigan (0.9%)<br />
10,000 Hospital Finance Auth. 5.50 12/01/2034 10,090<br />
8,000 Strategic Fund Ltd. 5.25 8/01/2029 8,318<br />
18,408<br />
New Jersey (0.7%)<br />
5,000 EDA (PRE) 5.00 9/01/2029 5,446<br />
10,000 Turnpike Auth. 0.75 (d) 1/01/2024 9,904<br />
15,350<br />
New Mexico (0.6%)<br />
11,600 Farmington 2.88 4/01/2029 11,952<br />
Portfolio of Investments | 27
Principal<br />
Market<br />
Amount Coupon Final Value<br />
(000) Security Rate Maturity (000)<br />
New York (0.6%)<br />
$10,000 MTA 0.96% (d) 11/01/2030 $ 10,008<br />
2,000 New York City 0.62 (d) 8/01/2025 1,996<br />
12,004<br />
Ohio (1.0%)<br />
9,000 Air Quality Dev. Auth. 2.25 8/01/2029 8,820<br />
4,000 Air Quality Dev. Auth. 3.88 12/01/2038 4,070<br />
9,405 Water Dev. Auth. 3.38 7/01/2033 9,479<br />
22,369<br />
Pennsylvania (2.9%)<br />
10,000 Beaver County IDA 4.75 8/01/2020 10,984<br />
7,000 Beaver County IDA 2.20 1/01/2035 6,864<br />
5,100 Beaver County IDA 2.70 4/01/2035 4,921<br />
7,575 Berks County Municipal Auth. 1.57 (d) 11/01/2039 7,493<br />
2,000 Economic Dev. Financing Auth. 1.75 12/01/2033 1,993<br />
17,500 Economic Dev. Financing Auth. 3.00 12/01/2038 18,027<br />
3,000 Economic Dev. Financing Auth. 3.00 12/01/2038 3,090<br />
2,000 Economic Dev. Financing Auth. 3.38 12/01/2040 2,069<br />
7,000 Northampton County General Purpose Auth. 1.47 (d) 8/15/2043 6,873<br />
62,314<br />
Texas (3.4%)<br />
5,095 Gateway Public Facility Corp. (NBGA) 4.55 7/01/2034 5,246<br />
10,000 Harris County Cultural Education Facilities<br />
Finance Corp. 1.12 (d) 11/15/2045 10,027<br />
40,000 Mission EDC 0.85 1/01/2020 40,000<br />
12,000 North Texas Tollway Auth. 5.75 1/01/2038 13,245<br />
5,000 Transportation Commission 1.25 8/15/2042 5,019<br />
73,537<br />
Virginia (0.4%)<br />
8,000 Louisa IDA 5.38 11/01/2035 8,071<br />
West Virginia (0.2%)<br />
5,000 EDA 3.13 3/01/2043 5,128<br />
Wisconsin (1.2%)<br />
10,000 Health and Educational Facilities Auth. 4.75 8/15/2025 10,321<br />
14,350 Health and Educational Facilities Auth. 5.13 8/15/2027 15,779<br />
26,100<br />
Total Put Bonds (cost: $515,174) 523,269<br />
28 | <strong>USAA</strong> Tax Exempt Short-Term Fund
Principal<br />
Market<br />
Amount Coupon Final Value<br />
(000) Security Rate Maturity (000)<br />
ADJUSTABLE-RATE NOTES (0.8%)<br />
Pennsylvania (0.6%)<br />
$ 6,000 Turnpike Commission 1.22% 12/01/2019 $ 5,995<br />
6,000 Turnpike Commission 1.34 12/01/2020 5,990<br />
11,985<br />
Texas (0.2%)<br />
1,750 Harris County Cultural Education Facilities<br />
Finance Corp. 0.67 6/01/2018 1,749<br />
2,250 Harris County Cultural Education Facilities<br />
Finance Corp. 0.77 6/01/2019 2,246<br />
3,995<br />
Total Adjustable-Rate Notes (cost: $16,000) 15,980<br />
VARIABLE-RATE DEMAND NOTES (27.9%)<br />
Arizona (0.9%)<br />
9,295 Pima County IDA (LIQ) (b) 0.22 7/01/2033 9,295<br />
11,000 Verrado Western Overlay Community<br />
Facilities District (LOC - Compass Bank) 1.50 7/01/2029 11,000<br />
20,295<br />
California (5.8%)<br />
26,050 Golden State Tobacco Securitization Corp.<br />
(INS)(LIQ) (b) 0.47 6/01/2045 26,050<br />
8,515 Hacienda La Puente USD (LIQ)(LOC - Dexia<br />
Credit Local) (b) 0.51 8/01/2024 8,515<br />
9,465 Inglewood USD (LIQ)(LOC - Dexia Credit Local) (b) 0.51 10/15/2023 9,465<br />
26,760 State (LIQ)(LOC - Dexia Credit Local) (b) 0.50 8/01/2027 26,760<br />
17,900 State (LIQ)(LOC - Dexia Credit Local) (b) 0.50 8/01/2027 17,900<br />
1,300 Statewide Communities Dev. Auth. (LIQ)<br />
(LOC - Citibank, N.A.) (b) 0.57 12/14/2016 1,300<br />
23,800 Statewide Communities Dev. Auth. (LIQ)<br />
(LOC - Citibank, N.A.) (b) 0.57 9/06/2035 23,800<br />
11,445 Victorville Joint Powers Financing Auth.<br />
(LOC - BNP Paribas) 1.57 5/01/2040 11,445<br />
125,235<br />
Colorado (0.4%)<br />
8,915 Arista Metropolitan District (LOC - Compass Bank) 1.50 12/01/2030 8,915<br />
Florida (0.5%)<br />
10,000 Miami-Dade County School Board (INS)(LIQ) (b) 0.32 5/01/2016 10,000<br />
Portfolio of Investments | 29
Principal<br />
Market<br />
Amount Coupon Final Value<br />
(000) Security Rate Maturity (000)<br />
Georgia (0.5%)<br />
$10,550 Atlanta (INS)(LIQ) (b) 0.37% 11/01/2043 $ 10,550<br />
Idaho (0.9%)<br />
19,885 American Falls Reservoir District 0.50 2/01/2025 19,885<br />
Illinois (2.5%)<br />
19,570 Chicago (LIQ) (b) 0.27 1/01/2015 19,570<br />
34,100 State (LIQ) 2.00 10/01/2033 34,100<br />
53,670<br />
Kentucky (0.9%)<br />
15,000 Economic Dev. Finance Auth. (INS)(LIQ) (b) 0.32 6/01/2016 15,000<br />
4,060 Economic Dev. Finance Auth. (INS)(LIQ) 0.32 8/01/2018 4,060<br />
19,060<br />
Louisiana (3.8%)<br />
28,000 St. James Parish (LOC - Natixis S.A.) 0.43 11/01/2039 28,000<br />
29,000 St. James Parish 0.34 11/01/2040 29,000<br />
25,000 St. James Parish 0.35 11/01/2040 25,000<br />
82,000<br />
Maine (1.1%)<br />
23,285 Health & Higher Educational Facilities<br />
Auth. (INS)(LIQ) 0.35 7/01/2036 23,285<br />
New Jersey (3.5%)<br />
28,015 EDA (LIQ)(LOC - Dexia Credit Local) (b) 0.47 9/01/2022 28,015<br />
10,550 EDA (LIQ)(LOC - Dexia Credit Local) (b) 0.47 9/01/2025 10,550<br />
2,600 EDA (LOC - Valley National Bank) 0.75 3/01/2031 2,600<br />
7,135 EDA (LOC - Valley National Bank) 0.42 11/01/2031 7,135<br />
6,435 EDA (LOC - Sovereign Bank) 0.75 5/15/2033 6,435<br />
9,275 EDA (LOC - Valley National Bank) 0.30 11/01/2040 9,275<br />
12,465 EDA (LOC - Valley National Bank) 0.30 11/01/2040 12,465<br />
76,475<br />
New York (0.2%)<br />
4,745 Ulster County IDA (LOC - Sovereign Bank) 0.75 9/15/2037 4,745<br />
Pennsylvania (4.4%)<br />
11,000 Butler County General Auth. (INS)(LIQ) 0.30 9/01/2027 11,000<br />
10,000 Delaware Valley Regional Finance Auth.<br />
(LOC - Bayerische Landesbank) 0.31 12/01/2020 10,000<br />
13,750 Delaware Valley Regional Finance Auth.<br />
(LOC - Bayerische Landesbank) 0.29 6/01/2042 13,750<br />
39,600 Emmaus General Auth. (INS)(LIQ) 0.35 12/01/2028 39,600<br />
20,000 Luzerne County (INS)(LIQ) 0.65 11/15/2026 20,000<br />
94,350<br />
30 | <strong>USAA</strong> Tax Exempt Short-Term Fund
Principal<br />
Market<br />
Amount Coupon Final Value<br />
(000) Security Rate Maturity (000)<br />
Texas (0.8%)<br />
$ 4,095 Weslaco Health Facilities Dev. Corp.<br />
(LOC - Compass Bank) 0.72% 6/01/2031 $ 4,095<br />
12,220 Weslaco Health Facilities Dev. Corp.<br />
(LOC - Compass Bank) 0.72 6/01/2038 12,220<br />
16,315<br />
Washington (1.7%)<br />
35,765 Health Care Facilities Auth. (INS)(LIQ) 0.45 12/01/2036 35,765<br />
Total Variable-Rate Demand Notes (cost: $600,545) 600,545<br />
Total Investments (cost: $2,121,108) $2,163,069<br />
($ in 000s) VALUATION HIERARCHY<br />
(LEVEL 1) (LEVEL 2) (LEVEL 3)<br />
Quoted Prices Other Significant Significant<br />
in Active Markets Observable Unobservable<br />
Assets for Identical Assets Inputs Inputs Total<br />
Fixed-Rate Instruments $– $1,023,275 $– $1,023,275<br />
Put Bonds – 523,269 – 523,269<br />
Adjustable-Rate Notes – 15,980 – 15,980<br />
Variable-Rate Demand Notes – 600,545 – 600,545<br />
Total $– $2,163,069 $– $2,163,069<br />
For the period of April 1, 2013, through September 30, 2013, there were no<br />
transfers of securities between levels. The Fund’s policy is to recognize<br />
any transfers into and out of the levels as of the beginning of the period<br />
in which the event or circumstance that caused the transfer occurred.<br />
Portfolio of Investments | 31
NOTES TO PORTFOLIO<br />
OF INVESTMENTS<br />
September 30, 2013 (unaudited)<br />
■ GENERAL NOTES<br />
Market values of securities are determined by procedures and<br />
practices discussed in Note 1 to the financial statements.<br />
The portfolio of investments category percentages shown represent<br />
the percentages of the investments to net assets, and, in total, may<br />
not equal 100%. A category percentage of 0.0% represents less<br />
than 0.1% of net assets.<br />
■ SPECIFIC NOTES<br />
(a) Zero-coupon security. Rate represents the effective yield at the<br />
date of purchase.<br />
(b) Restricted security that is not registered under the Securities<br />
Act of 1933. A resale of this security in the United States may<br />
occur in an exempt transaction to a qualified institutional buyer<br />
as defined by Rule 144A, and as such has been deemed liquid by<br />
<strong>USAA</strong> Asset Management Company (the Manager) under liquidity<br />
guidelines approved by the Trust’s Board of Trustees (the Board),<br />
unless otherwise noted as illiquid.<br />
(c) Security deemed illiquid by the Manager, under liquidity<br />
guidelines approved by the Board. The aggregate market value<br />
of these securities at September 30, 2013, was $3,125,000, which<br />
represented 0.1% of the Fund’s net assets.<br />
(d) Variable-rate or floating-rate security — interest rate is adjusted<br />
periodically. The interest rate disclosed represents the current<br />
rate at September 30, 2013.<br />
See ac<strong>com</strong>panying notes to financial statements.<br />
32 | <strong>USAA</strong> Tax Exempt Short-Term Fund
STATEMENT OF ASSETS AND LIABILITIES<br />
(IN THOUSANDS)<br />
September 30, 2013 (unaudited)<br />
ASSETS<br />
Investments in securities, at market value (cost of $2,121,108) $2,163,069<br />
Cash 1,978<br />
Receivables:<br />
Capital shares sold 3,125<br />
Interest 16,780<br />
Total assets 2,184,952<br />
LIABILITIES<br />
Payables:<br />
Securities purchased 30,000<br />
Capital shares redeemed 3,478<br />
Dividends on capital shares 472<br />
Accrued management fees 578<br />
Accrued transfer agent’s fees 30<br />
Other accrued expenses and payables 54<br />
Total liabilities 34,612<br />
Net assets applicable to capital shares outstanding $2,150,340<br />
NET ASSETS CONSIST OF:<br />
Paid-in capital $2,128,225<br />
Accumulated undistributed net investment in<strong>com</strong>e 2<br />
Accumulated net realized loss on investments (19,848)<br />
Net unrealized appreciation of investments 41,961<br />
Net assets applicable to capital shares outstanding $2,150,340<br />
Net asset value, redemption price, and offering price per share:<br />
Fund Shares (net assets of $2,140,956/199,951<br />
shares outstanding) $ 10.71<br />
Adviser Shares (net assets of $9,384/877 shares outstanding) $ 10.71<br />
See ac<strong>com</strong>panying notes to financial statements.<br />
Financial Statements | 33
STATEMENT OF OPERATIONS<br />
(IN THOUSANDS)<br />
Six-month period ended September 30, 2013 (unaudited)<br />
INVESTMENT INCOME<br />
Interest in<strong>com</strong>e $ 26,285<br />
EXPENSES<br />
Management fees 3,629<br />
Administration and servicing fees:<br />
Fund Shares 1,627<br />
Adviser Shares 6<br />
Transfer agent’s fees:<br />
Fund Shares 425<br />
Distribution and service fees (Note 6E):<br />
Adviser Shares 11<br />
Custody and accounting fees:<br />
Fund Shares 127<br />
Postage:<br />
Fund Shares 16<br />
Shareholder reporting fees:<br />
Fund Shares 16<br />
Trustees’ fees 7<br />
Registration fees:<br />
Fund Shares 21<br />
Adviser Shares 14<br />
Professional fees 61<br />
Other 16<br />
Total expenses 5,976<br />
Expenses reimbursed:<br />
Adviser Shares (12)<br />
Net expenses 5,964<br />
NET INVESTMENT INCOME 20,321<br />
NET REALIZED AND UNREALIZED LOSS ON INVESTMENTS<br />
Net realized loss (223)<br />
Change in net unrealized appreciation/depreciation (26,190)<br />
Net realized and unrealized loss (26,413)<br />
Decrease in net assets resulting from operations $ (6,092)<br />
See ac<strong>com</strong>panying notes to financial statements.<br />
34 | <strong>USAA</strong> Tax Exempt Short-Term Fund
STATEMENTS OF CHANGES IN NET ASSETS<br />
(IN THOUSANDS)<br />
Six-month period ended September 30, 2013 (unaudited), and year ended March 31, 2013<br />
9/30/2013 3/31/2013<br />
FROM OPERATIONS<br />
Net investment in<strong>com</strong>e $ 20,321 $ 44,326<br />
Net realized gain (loss) on investments (223) 376<br />
Change in net unrealized appreciation/depreciation of<br />
investments (26,190) 6,322<br />
Increase (decrease) in net assets resulting<br />
from operations (6,092) 51,024<br />
DISTRIBUTIONS TO SHAREHOLDERS FROM:<br />
Net investment in<strong>com</strong>e:<br />
Fund Shares (20,117) (44,079)<br />
Adviser Shares (67) (115)<br />
Distributions to shareholders (20,184) (44,194)<br />
NET INCREASE (DECREASE) IN NET ASSETS<br />
FROM CAPITAL SHARE TRANSACTIONS (NOTE 5)<br />
Fund Shares (18,612) 54,810<br />
Adviser Shares 2,883 574<br />
Total net increase (decrease) in net assets<br />
from capital share transactions (15,729) 55,384<br />
Net increase (decrease) in net assets (42,005) 62,214<br />
NET ASSETS<br />
Beginning of period 2,192,345 2,130,131<br />
End of period $2,150,340 $2,192,345<br />
Accumulated undistributed (overdistribution of) net<br />
investment in<strong>com</strong>e:<br />
End of period $ 2 $ (135)<br />
See ac<strong>com</strong>panying notes to financial statements.<br />
Financial Statements | 35
NOTES TO FINANCIAL<br />
STATEMENTS<br />
September 30, 2013 (unaudited)<br />
(1) SUMMARY OF SIGNIFICANT ACCOUNTING POLICIES<br />
<strong>USAA</strong> MUTUAL FUNDS TRUST (the Trust), registered under the Investment<br />
Company Act of 1940, as amended (the 1940 Act), is an open-end<br />
management investment <strong>com</strong>pany organized as a Delaware statutory<br />
trust consisting of 52 separate funds. The information presented in this<br />
semiannual report pertains only to the <strong>USAA</strong> Tax Exempt Short-Term<br />
Fund (the Fund), which is classified as diversified under the 1940 Act.<br />
The Fund’s investment objective is to provide investors with interest<br />
in<strong>com</strong>e that is exempt from federal in<strong>com</strong>e tax.<br />
The Fund consists of two classes of shares: Tax Exempt Short-Term Fund<br />
Shares (Fund Shares) and Tax Exempt Short-Term Fund Adviser Shares<br />
(Adviser Shares). Each class of shares has equal rights to assets and<br />
earnings, except that each class bears certain class-related expenses<br />
specific to the particular class. These expenses include administration and<br />
servicing fees, transfer agent fees, postage, shareholder reporting fees,<br />
distribution and service (12b-1) fees, and certain registration and custodian<br />
fees. Expenses not attributable to a specific class, in<strong>com</strong>e, and realized<br />
gains or losses on investments are allocated to each class of shares based<br />
on each class’s relative net assets. Each class has exclusive voting rights<br />
on matters related solely to that class and separate voting rights on matters<br />
that relate to both classes. The Adviser Shares permit investors to purchase<br />
shares through financial intermediaries, banks, broker-dealers, insurance<br />
<strong>com</strong>panies, investment advisers, plan sponsors, and financial professionals<br />
that provide various administrative and distribution services.<br />
A. Security valuation — The Trust’s Board of Trustees (the Board) has<br />
established the Valuation Committee (the Committee), and subject to<br />
Board oversight, the Committee administers and oversees the Fund’s<br />
36 | <strong>USAA</strong> Tax Exempt Short-Term Fund
valuation policies and procedures which are approved by the Board.<br />
Among other things, these policies and procedures allow the Fund to<br />
utilize independent pricing services, quotations from securities dealers,<br />
and a wide variety of sources and information to establish and adjust<br />
the fair value of securities as events occur and circumstances warrant.<br />
The Committee reports to the Board on a quarterly basis and makes<br />
re<strong>com</strong>mendations to the Board as to pricing methodologies and<br />
services used by the Fund and presents additional information to the<br />
Board regarding application of the pricing and fair valuation policies<br />
and procedures during the preceding quarter.<br />
The Committee meets as often as necessary to make pricing and fair<br />
value determinations. In addition, the Committee holds regular monthly<br />
meetings to review prior actions taken by the Committee and <strong>USAA</strong><br />
Asset Management Company (the Manager). Among other things, these<br />
monthly meetings include a review and analysis of back testing reports,<br />
pricing service quotation <strong>com</strong>parisons, illiquid securities and fair value<br />
determinations, pricing movements, and daily stale price monitoring.<br />
The value of each security is determined (as of the close of trading<br />
on the New York Stock Exchange (NYSE) on each business day the<br />
NYSE is open) as set forth below:<br />
1. Debt securities with maturities greater than 60 days are valued<br />
each business day by a pricing service (the Service) approved by<br />
the Board. The Service uses an evaluated mean between quoted<br />
bid and asked prices or the last sales price to price securities<br />
when, in the Service’s judgment, these prices are readily available<br />
and are representative of the securities’ market values. For many<br />
securities, such prices are not readily available. The Service<br />
generally prices these securities based on methods that include<br />
consideration of yields or prices of tax-exempt securities of<br />
<strong>com</strong>parable quality, coupon, maturity, and type; indications as to<br />
values from dealers in securities; and general market conditions.<br />
2. Debt securities purchased with original or remaining maturities<br />
of 60 days or less may be valued at amortized cost, which<br />
approximates market value.<br />
Notes to Financial Statements | 37
3. Securities for which market quotations are not readily available<br />
or are considered unreliable, or whose values have been materially<br />
affected by events occurring after the close of their primary<br />
markets but before the pricing of the Fund, are valued in good<br />
faith at fair value, using methods determined by the Manager, an<br />
affiliate of the Fund, under valuation procedures approved by the<br />
Board. The effect of fair value pricing is that securities may not<br />
be priced on the basis of quotations from the primary market in<br />
which they are traded and the actual price realized from the sale<br />
of a security may differ materially from the fair value price.<br />
Valuing these securities at fair value is intended to cause the<br />
Fund’s net asset value (NAV) to be more reliable than it<br />
otherwise would be.<br />
Fair value methods used by the Manager include, but are not<br />
limited to, obtaining market quotations from secondary pricing<br />
services, broker-dealers, or widely used quotation systems.<br />
General factors considered in determining the fair value of<br />
securities include fundamental analytical data, the nature and<br />
duration of any restrictions on disposition of the securities, and<br />
an evaluation of the forces that influenced the market in which<br />
the securities are purchased and sold.<br />
B. Fair value measurements — Fair value is defined as the price that<br />
would be received to sell an asset or paid to transfer a liability in an<br />
orderly transaction between market participants at the measurement<br />
date. The three-level valuation hierarchy disclosed in the portfolio of<br />
investments is based upon the transparency of inputs to the valuation<br />
of an asset or liability as of the measurement date. The three levels<br />
are defined as follows:<br />
Level 1 — inputs to the valuation methodology are quoted prices<br />
(unadjusted) in active markets for identical securities.<br />
Level 2 — inputs to the valuation methodology are other significant<br />
observable inputs, including quoted prices for similar securities, inputs<br />
38 | <strong>USAA</strong> Tax Exempt Short-Term Fund
that are observable for the securities, either directly or indirectly,<br />
and market-corroborated inputs such as market indices. Level 2<br />
securities include variable-rate demand notes which are valued at<br />
amortized cost. All other level 2 securities are valued based on<br />
methods discussed in Note 1A1.<br />
Level 3 — inputs to the valuation methodology are unobservable and<br />
significant to the fair value measurement, including the Manager’s<br />
own assumptions in determining the fair value.<br />
The inputs or methodologies used for valuing securities are not<br />
necessarily an indication of the risks associated with investing in<br />
those securities.<br />
C. Federal taxes — The Fund’s policy is to <strong>com</strong>ply with the requirements<br />
of the Internal Revenue Code applicable to regulated investment<br />
<strong>com</strong>panies and to distribute substantially all of its in<strong>com</strong>e to its<br />
shareholders. Therefore, no federal in<strong>com</strong>e tax provision is required.<br />
D. Investments in securities — Security transactions are accounted for<br />
on the date the securities are purchased or sold (trade date). Gains<br />
or losses from sales of investment securities are <strong>com</strong>puted on the<br />
identified cost basis. Interest in<strong>com</strong>e is recorded daily on the accrual<br />
basis. Premiums and discounts are amortized over the life of the<br />
respective securities, using the effective yield method for long-term<br />
securities and the straight-line method for short-term securities.<br />
E. Securities purchased on a delayed-delivery or when-issued basis —<br />
Delivery and payment for securities that have been purchased by the<br />
Fund on a delayed-delivery or when-issued basis can take place a month<br />
or more after the trade date. During the period prior to settlement,<br />
these securities do not earn interest, are subject to market fluctuation,<br />
and may increase or decrease in value prior to their delivery. The<br />
Fund maintains segregated assets with a market value equal to or<br />
greater than the amount of its purchase <strong>com</strong>mitments. The purchase<br />
of securities on a delayed-delivery or when-issued basis may increase<br />
Notes to Financial Statements | 39
the volatility of the Fund’s NAV to the extent that the Fund makes<br />
such purchases while remaining substantially fully invested.<br />
F. Expenses paid indirectly — Through arrangements with the Fund’s<br />
custodian and other banks utilized by the Fund for cash management<br />
purposes, realized credits, if any, generated from cash balances in<br />
the Fund’s bank accounts may be used to directly reduce the Fund’s<br />
expenses. For the six-month period ended September 30, 2013, there<br />
were no custodian and other bank credits.<br />
G. Indemnifications — Under the Trust’s organizational documents, its<br />
officers and trustees are indemnified against certain liabilities arising<br />
out of the performance of their duties to the Trust. In addition, in the<br />
normal course of business, the Trust enters into contracts that contain<br />
a variety of representations and warranties that provide general<br />
indemnifications. The Trust’s maximum exposure under these<br />
arrangements is unknown, as this would involve future claims that<br />
may be made against the Trust that have not yet occurred. However,<br />
the Trust expects the risk of loss to be remote.<br />
H. Use of estimates — The preparation of financial statements in<br />
conformity with U.S. generally accepted accounting principles requires<br />
management to make estimates and assumptions that may affect<br />
the reported amounts in the financial statements.<br />
(2) LINE OF CREDIT<br />
The Fund participates in a joint, short-term, revolving, <strong>com</strong>mitted loan<br />
agreement of $500 million with <strong>USAA</strong> Capital Corporation (CAPCO),<br />
an affiliate of the Manager. The purpose of the agreement is to meet<br />
temporary or emergency cash needs, including redemption requests<br />
that might otherwise require the untimely disposition of securities.<br />
Subject to availability, the Fund may borrow from CAPCO an amount<br />
up to 5% of the Fund’s total assets at an interest rate based on the<br />
London Interbank Offered Rate (LIBOR).<br />
The <strong>USAA</strong> Funds that are party to the loan agreement are assessed<br />
facility fees by CAPCO in the amount of 7.0 basis points of the amount of<br />
40 | <strong>USAA</strong> Tax Exempt Short-Term Fund
the <strong>com</strong>mitted loan agreement. The facility fee rate remains unchanged<br />
from September 30, 2012, to September 30, 2013. The facility fees are<br />
allocated among the Funds based on their respective average net assets<br />
for the period.<br />
For the six-month period ended September 30, 2013, the Fund paid<br />
CAPCO facility fees of $6,000, which represents 3.5% of the total fees<br />
paid to CAPCO by the <strong>USAA</strong> Funds. The Fund had no borrowings under<br />
this agreement during the six-month period ended September 30, 2013.<br />
(3) DISTRIBUTIONS<br />
The tax basis of distributions and accumulated undistributed net<br />
investment in<strong>com</strong>e will be determined based upon the Fund’s tax<br />
year-end of March 31, 2014, in accordance with applicable tax law.<br />
Net investment in<strong>com</strong>e is accrued daily as dividends and distributed to<br />
shareholders monthly. Distributions of realized gains from security<br />
transactions not offset by capital losses are made annually in the<br />
succeeding fiscal year or as otherwise required to avoid the payment of<br />
federal taxes.<br />
Under the Regulated Investment Company Modernization Act of 2010<br />
(the Act) a fund is permitted to carry forward net capital losses indefinitely.<br />
Additionally, such capital losses that are carried forward will retain their<br />
character as short-term and or long-term capital losses. Post-enactment<br />
capital loss carryforwards must be used before pre-enactment capital<br />
loss carryforwards. As a result, pre-enactment capital loss carryforwards<br />
may be more likely to expire unused.<br />
At March 31, 2013, the Fund had pre-enactment capital loss carryforwards<br />
of $2,687,000 and post-enactment long-term capital loss carryforwards<br />
of $16,938,000, for federal in<strong>com</strong>e tax purposes. If not offset by subsequent<br />
capital gains, the pre-enactment capital loss carryforwards will expire<br />
between 2014 and 2016, as shown below. It is unlikely that the Board will<br />
authorize a distribution of capital gains realized in the future until the<br />
capital loss carryforwards have been used or expire.<br />
Notes to Financial Statements | 41
Pre-Enactment Capital Loss Carryforwards<br />
Expires<br />
Balance<br />
2014 $ 265,000<br />
2015 2,326,000<br />
2016 96,000<br />
Total $2,687,000<br />
For the six-month period ended September 30, 2013, the Fund did not<br />
incur any in<strong>com</strong>e tax, interest, or penalties, and has recorded no liability<br />
for net unrecognized tax benefits relating to uncertain in<strong>com</strong>e tax positions.<br />
On an ongoing basis the Manager will monitor its tax positions to determine<br />
if adjustments to this conclusion are necessary. The statute of limitations<br />
on the Fund’s tax return filings generally remain open for the three<br />
preceding fiscal reporting year ends and remain subject to examination<br />
by the Internal Revenue Service and state taxing authorities.<br />
(4) INVESTMENT TRANSACTIONS<br />
Cost of purchases and proceeds from sales/maturities of securities,<br />
excluding short-term securities, for the six-month period ended<br />
September 30, 2013, were $26,986,000 and $128,467,000, respectively.<br />
As of September 30, 2013, the cost of securities, including short-term<br />
securities, for federal in<strong>com</strong>e tax purposes, was approximately the same<br />
as that reported in the financial statements.<br />
Gross unrealized appreciation and depreciation of investments as of<br />
September 30, 2013, were $45,930,000 and $3,969,000, respectively,<br />
resulting in net unrealized appreciation of $41,961,000.<br />
(5) CAPITAL SHARE TRANSACTIONS<br />
At September 30, 2013, there were an unlimited number of shares of<br />
capital stock at no par value authorized for the Fund.<br />
42 | <strong>USAA</strong> Tax Exempt Short-Term Fund
Capital share transactions for all classes were as follows, in thousands:<br />
Six Month Period Ended<br />
Year Ended<br />
September 30, 2013 March 31, 2013<br />
Shares Amount Shares Amount<br />
Fund Shares:<br />
Shares sold 38,248 $ 411,961 69,674 $ 754,914<br />
Shares issued from reinvested<br />
dividends 1,590 17,100 3,520 38,154<br />
Shares redeemed (41,584) (447,673) (68,122) (738,258)<br />
Net increase (decrease) from<br />
capital share transactions (1,746) $ (18,612) 5,072 $ 54,810<br />
Adviser Shares:<br />
Shares sold 382 $ 4,112 135 $ 1,459<br />
Shares issued from reinvested<br />
dividends 2 24 2 26<br />
Shares redeemed (117) (1,253) (84) (911)<br />
Net increase from capital<br />
share transactions 267 $ 2,883 53 $ 574<br />
(6) TRANSACTIONS WITH MANAGER<br />
A. Management fees — The Manager carries out the Fund’s investment<br />
policies and manages the Fund’s portfolio pursuant to an Advisory<br />
Agreement. The investment management fee for the Fund is <strong>com</strong>posed<br />
of a base investment management fee and a performance adjustment.<br />
The Fund’s base investment management fee is accrued daily and paid<br />
monthly at an annualized rate of 0.28% of the Fund’s average net<br />
assets for the fiscal year.<br />
The performance adjustment is calculated separately for each<br />
share class on a monthly basis by <strong>com</strong>paring each class’s performance<br />
to that of the Lipper Short Municipal Debt Funds Index over the<br />
performance period. The Lipper Short Municipal Debt Funds Index<br />
tracks the total return performance of the 10 largest funds in the<br />
Lipper Short Municipal Debt Funds category. The performance<br />
period for each class consists of the current month plus the previous<br />
35 months.<br />
Notes to Financial Statements | 43
The following table is utilized to determine the extent of the<br />
performance adjustment:<br />
Over/Under Performance<br />
Annual Adjustment Rate<br />
Relative to Index 1 as a % of the Fund’s Average Net Assets 1<br />
+/– 0.20% to 0.50% +/– 0.04%<br />
+/– 0.51% to 1.00% +/– 0.05%<br />
+/– 1.01% and greater +/– 0.06%<br />
1<br />
Based on the difference between average annual performance of the relevant share class of the<br />
Fund and its relevant index, rounded to the nearest basis point (0.01%). Average net assets of the<br />
share class are calculated over a rolling 36-month period.<br />
Each class’s annual performance adjustment rate is multiplied by the<br />
average net assets of each respective class over the entire performance<br />
period, which is then multiplied by a fraction, the numerator of which<br />
is the number of days in the month and the denominator of which<br />
is 365 (366 in leap years). The resulting amount is the performance<br />
adjustment; a positive adjustment in the case of overperformance, or<br />
a negative adjustment in the case of underperformance.<br />
Under the performance fee arrangement, each class will pay a positive<br />
performance fee adjustment for a performance period whenever the<br />
class outperforms the Lipper Short Municipal Debt Funds Index over<br />
that period, even if the class had overall negative returns during the<br />
performance period.<br />
For the six-month period ended September 30, 2013, the Fund incurred<br />
total management fees, paid or payable to the Manager, of $3,629,000,<br />
which included a performance adjustment for the Fund Shares and<br />
Adviser Shares of $579,000 and $1,000, respectively. For the Fund<br />
Shares and Adviser Shares, the performance adjustments were 0.05%<br />
and 0.03%, respectively.<br />
B. Administration and servicing fees — The Manager provides certain<br />
administration and servicing functions for the Fund. For such<br />
services, the Manager receives a fee accrued daily and paid monthly<br />
at an annualized rate of 0.15% of average net assets for both the<br />
Fund Shares and Adviser Shares. For the six-month period ended<br />
44 | <strong>USAA</strong> Tax Exempt Short-Term Fund
September 30, 2013, the Fund Shares and Adviser Shares incurred<br />
administration and servicing fees, paid or payable to the Manager,<br />
of $1,627,000 and $6,000, respectively.<br />
In addition to the services provided under its Administration and<br />
Servicing Agreement with the Fund, the Manager also provides<br />
certain <strong>com</strong>pliance and legal services for the benefit of the Fund.<br />
The Board has approved the reimbursement of a portion of these<br />
expenses incurred by the Manager. For the six-month period ended<br />
September 30, 2013, the Fund reimbursed the Manager $31,000 for<br />
these <strong>com</strong>pliance and legal services. These expenses are included in<br />
the professional fees on the Fund’s statement of operations.<br />
C. Expense limitation — The Manager has agreed, through August 1,<br />
2014, to limit the annual expenses of the Adviser Shares to 0.80% of<br />
its average net assets, excluding extraordinary expenses and before<br />
reductions of any expenses paid indirectly, and will reimburse the<br />
Adviser Shares for all expenses in excess of that amount. This expense<br />
limitation arrangement may not be changed or terminated through<br />
August 1, 2014, without approval of the Board, and may be changed<br />
or terminated by the Manager at any time after that date. For the<br />
six-month period ended September 30, 2013, the Adviser Shares<br />
incurred reimbursable expenses of $12,000, of which less than $500<br />
was receivable from the Manager.<br />
D. Transfer agent’s fees — <strong>USAA</strong> Transfer Agency Company, d/b/a <strong>USAA</strong><br />
Shareholder Account Services (SAS), an affiliate of the Manager,<br />
provides transfer agent services to the Fund. Transfer agent’s fees for<br />
both the Fund Shares and Adviser Shares are paid monthly based on an<br />
annual charge of $25.50 per shareholder account plus out-of-pocket<br />
expenses. Each class also pays SAS fees that are related to the<br />
administration and servicing of accounts that are traded on an omnibus<br />
basis. For the six-month period ended September 30, 2013, the Fund<br />
Shares and Adviser Shares incurred transfer agent’s fees, paid or<br />
payable to SAS, of $425,000 and less than $500, respectively.<br />
E. Distribution and service (12b-1) fees — The Fund has adopted a<br />
plan pursuant to Rule 12b-1 under the 1940 Act with respect to the<br />
Notes to Financial Statements | 45
Adviser Shares. Under the plan, the Adviser Shares pay fees to <strong>USAA</strong><br />
Investment Management Company, the distributor, for distribution and<br />
shareholder services. <strong>USAA</strong> Investment Management Company pays<br />
all or a portion of such fees to intermediaries that make the Adviser<br />
Shares available for investment by their customers. The fee is accrued<br />
daily and paid monthly at an annual rate of 0.25% of the Adviser<br />
Shares’ average net assets. Adviser Shares are offered and sold<br />
without imposition of an initial sales charge or a contingent deferred<br />
sales charge. For the six-month period ended September 30, 2013, the<br />
Adviser Shares incurred distribution and service (12b-1) fees of $11,000.<br />
F. Underwriting services — <strong>USAA</strong> Investment Management Company<br />
provides exclusive underwriting and distribution of the Fund’s shares<br />
on a continuing best-efforts basis and receives no <strong>com</strong>missions or<br />
fees for this service.<br />
(7) TRANSACTIONS WITH AFFILIATES<br />
The Manager is indirectly wholly owned by United Services Automobile<br />
Association (<strong>USAA</strong>), a large, diversified financial services institution. At<br />
September 30, 2013, <strong>USAA</strong> and its affiliates owned 465,000 shares,<br />
which represent 53.0% of the Adviser Shares and 0.2% of the Fund.<br />
Certain trustees and officers of the Fund are also directors, officers,<br />
and/or employees of the Manager. None of the affiliated trustees or Fund<br />
officers received any <strong>com</strong>pensation from the Fund.<br />
(8) SECURITY TRANSACTIONS WITH AFFILIATED FUNDS<br />
During the six-month period ended September 30, 2013, in accordance<br />
with affiliated transaction procedures approved by the Board, purchases<br />
and sales of security transactions were executed between the Fund and<br />
the following affiliated <strong>USAA</strong> Fund at the then-current market price with<br />
no brokerage <strong>com</strong>missions incurred.<br />
Cost to<br />
Net Realized<br />
Seller Purchaser Purchaser Gain to Seller<br />
<strong>USAA</strong> Tax Exempt <strong>USAA</strong> Tax Exempt<br />
Intermediate-Term Fund Short-Term Fund $25,751,000 $713,000<br />
46 | <strong>USAA</strong> Tax Exempt Short-Term Fund
(9) FINANCIAL HIGHLIGHTS — FUND SHARES<br />
Per share operating performance for a share outstanding throughout<br />
each period is as follows:<br />
Six-Month<br />
Period Ended<br />
September 30, Year Ended March 31,<br />
2013 2013 2012 2011 2010 2009<br />
Net asset value at<br />
beginning of period $ 10.84 $ 10.80 $ 10.61 $ 10.62 $ 10.38 $ 10.59<br />
In<strong>com</strong>e (loss) from<br />
investment operations:<br />
Net investment in<strong>com</strong>e .10 .22 .27 .29 .32 .45<br />
Net realized and<br />
unrealized gain (loss) (.13) .04 .19 (.01) .24 (.20)<br />
Total from investment<br />
operations (.03) .26 .46 .28 .56 .25<br />
Less distributions from:<br />
Net investment in<strong>com</strong>e (.10) (.22) (.27) (.29) (.32) (.46)<br />
Net asset value at<br />
end of period $ 10.71 $ 10.84 $ 10.80 $ 10.61 $ 10.62 $ 10.38<br />
Total return (%)* (.28) 2.41 4.40 2.62 5.46 (a) 2.38<br />
Net assets at<br />
end of period (000) $2,140,956 $2,185,741 $2,124,120 $1,860,300 $1,752,698 $1,211,460<br />
Ratios to average<br />
net assets:**<br />
Expenses (%) (b) .55 (c) .55 .55 .54 .55 (a) .56<br />
Net investment in<strong>com</strong>e (%) 1.87 (c) 2.02 2.54 2.69 3.01 4.36<br />
Portfolio turnover (%) 2 3 16 10 16 24<br />
* Assumes reinvestment of all net investment in<strong>com</strong>e and realized capital gain distributions, if any,<br />
during the period. Includes adjustments in accordance with U.S. generally accepted accounting<br />
principles and could differ from the Lipper reported return. Total returns for periods of less than<br />
one year are not annualized.<br />
** For the six-month period ended September 30, 2013, average net assets were $2,162,812,000.<br />
(a) During the year ended March 31, 2010, SAS reimbursed the Fund Shares $47,000 for<br />
corrections in fees paid for the administration and servicing of certain accounts. The effect of this<br />
reimbursement on the Fund Shares’ total return was less than 0.01%. The reimbursement<br />
decreased the Fund Shares’ expense ratios by less than 0.01%. This decrease is excluded from<br />
the expense ratios in the Financial Highlights table.<br />
(b) Reflects total operating expenses of the Fund Shares before reductions of any expenses paid<br />
indirectly. The Fund Shares’ expenses paid indirectly decreased the expense ratios by less than<br />
0.01%.<br />
(c) Annualized. The ratio is not necessarily indicative of 12 months of operations.<br />
Notes to Financial Statements | 47
(9) FINANCIAL HIGHLIGHTS (continued) —<br />
ADVISER SHARES<br />
Per share operating performance for a share outstanding throughout<br />
each period is as follows:<br />
Six-Month<br />
Period Ended<br />
Period Ended<br />
September 30, Year Ended March 31, March 31,<br />
2013 2013 2012 2011***<br />
Net asset value at<br />
beginning of period $10.84 $10.80 $10.61 $10.71<br />
In<strong>com</strong>e (loss) from<br />
investment operations:<br />
Net investment in<strong>com</strong>e .09 .19 .25 .17<br />
Net realized and<br />
unrealized gain (loss) (.13) .04 .19 (.10)<br />
Total from investment operations (.04) .23 .44 .07<br />
Less distributions from:<br />
Net investment in<strong>com</strong>e (.09) (.19) (.25) (.17)<br />
Net asset value at end of period $10.71 $10.84 $10.80 $10.61<br />
Total return (%)* (.40) 2.16 4.14 .69<br />
Net assets at end of period (000) $9,384 $6,604 $6,011 $4,940<br />
Ratios to average net assets:**<br />
Expenses (%) (a) .80 (b) .80 .80 .80 (b)<br />
Expenses, excluding<br />
reimbursements (%) (a) 1.07 (b) 1.17 1.30 1.53 (b)<br />
Net investment in<strong>com</strong>e (%) 1.61 (b) 1.77 2.28 2.47 (b)<br />
Portfolio turnover (%) 2 3 16 10<br />
* Assumes reinvestment of all net investment in<strong>com</strong>e and realized capital gain distributions, if any,<br />
during the period. Includes adjustments in accordance with U.S. generally accepted accounting<br />
principles and could differ from the Lipper reported return. Total returns for periods of less than<br />
one year are not annualized.<br />
** For the six-month period ended September 30, 2013, average net assets were $8,429,000.<br />
*** Adviser Shares were initiated on August 1, 2010.<br />
(a) Reflects total operating expenses of the Adviser Shares before reductions of any expenses paid<br />
indirectly. The Adviser Shares’ expenses paid indirectly decreased the expense ratios by less<br />
than 0.01%.<br />
(b) Annualized. The ratio is not necessarily indicative of 12 months of operations.<br />
48 | <strong>USAA</strong> Tax Exempt Short-Term Fund
EXPENSE EXAMPLE<br />
September 30, 2013 (unaudited)<br />
EXAMPLE<br />
As a shareholder of the Fund, you incur two types of costs: direct costs,<br />
such as wire fees, redemption fees, and low balance fees; and indirect<br />
costs, including management fees, transfer agency fees, distribution and<br />
service (12b-1) fees, and other Fund operating expenses. This example is<br />
intended to help you understand your indirect costs, also referred to as<br />
“ongoing costs” (in dollars), of investing in the Fund and to <strong>com</strong>pare<br />
these costs with the ongoing costs of investing in other mutual funds.<br />
The example is based on an investment of $1,000 invested at the<br />
beginning of the period and held for the entire six-month period of<br />
April 1, 2013, through September 30, 2013.<br />
ACTUAL EXPENSES<br />
The line labeled “actual” under each share class in the table on the<br />
next page provides information about actual account values and actual<br />
expenses. You may use the information in this line, together with the<br />
amount you invested at the beginning of the period, to estimate the<br />
expenses that you paid over the period. Simply divide your account<br />
value by $1,000 (for example, an $8,600 account value divided by<br />
$1,000 = 8.6), then multiply the result by the number for your share<br />
class in the “actual” line under the heading “Expenses Paid During<br />
Period” to estimate the expenses you paid on your account during<br />
this period.<br />
HYPOTHETICAL EXAMPLE FOR COMPARISON PURPOSES<br />
The line labeled “hypothetical” under each share class in the table provides<br />
information about hypothetical account values and hypothetical expenses<br />
based on the Fund’s actual expense ratios for each class and an assumed<br />
rate of return of 5% per year before expenses, which is not the Fund’s<br />
Expense Example | 49
actual return. The hypothetical account values and expenses may not be<br />
used to estimate the actual ending account balance or expenses you paid<br />
for the period. You may use this information to <strong>com</strong>pare the ongoing<br />
costs of investing in the Fund and other funds. To do so, <strong>com</strong>pare this 5%<br />
hypothetical example with the 5% hypothetical examples that appear in<br />
the shareholder reports of other funds.<br />
Please note that the expenses shown in the table are meant to highlight<br />
your ongoing costs only and do not reflect any direct costs, such as wire<br />
fees, redemption fees, or low balance fees. Therefore, the line labeled<br />
“hypothetical” is useful in <strong>com</strong>paring ongoing costs only, and will not<br />
help you determine the relative total costs of owning different funds. In<br />
addition, if these direct costs were included, your costs would have been<br />
higher.<br />
Expenses Paid<br />
Beginning Ending During Period*<br />
Account Value Account Value April 1, 2013 –<br />
April 1, 2013 September 30, 2013 September 30, 2013<br />
Fund Shares<br />
Actual $1,000.00 $ 997.20 $2.75<br />
Hypothetical<br />
(5% return before expenses) 1,000.00 1,022.31 2.79<br />
Adviser Shares<br />
Actual 1,000.00 996.00 4.00<br />
Hypothetical<br />
(5% return before expenses) 1,000.00 1,021.06 4.05<br />
* Expenses are equal to the annualized expense ratio of 0.55% for Fund Shares and 0.80% for Adviser<br />
Shares, which are net of any reimbursements and expenses paid indirectly, multiplied by the average<br />
account value over the period, multiplied by 183 days/365 days (to reflect the one-half-year period).<br />
The Fund’s actual ending account values are based on its actual total returns of (0.28)% for Fund Shares<br />
and (0.40)% for Adviser Shares for the six-month period of April 1, 2013, through September 30, 2013.<br />
50 | <strong>USAA</strong> Tax Exempt Short-Term Fund
ADVISORY AGREEMENT<br />
September 30, 2013 (unaudited)<br />
At a meeting of the Board of Trustees (the Board) held on April 30, 2013,<br />
the Board, including the Trustees who are not “interested persons” of<br />
the Trust (the Independent Trustees), approved for an annual period the<br />
continuance of the Advisory Agreement between the Trust and the<br />
Manager with respect to the Fund.<br />
In advance of the meeting, the Trustees received and considered a variety<br />
of information relating to the Advisory Agreement and the Manager and<br />
were given the opportunity to ask questions and request additional<br />
information from management. The information provided to the Board<br />
included, among other things: (i) a separate report prepared by an<br />
independent third party, which provided a statistical analysis <strong>com</strong>paring<br />
the Fund’s investment performance, expenses, and fees to <strong>com</strong>parable<br />
investment <strong>com</strong>panies; (ii) information concerning the services rendered<br />
to the Fund, as well as information regarding the Manager’s revenues and<br />
costs of providing services to the Fund and <strong>com</strong>pensation paid to affiliates<br />
of the Manager; and (iii) information about the Manager’s operations<br />
and personnel. Prior to voting, the Independent Trustees reviewed the<br />
proposed continuation of the Advisory Agreement with management<br />
and with experienced independent counsel and received materials from<br />
such counsel discussing the legal standards for their consideration of the<br />
proposed continuation of the Advisory Agreement with respect to the Fund.<br />
The Independent Trustees also reviewed the proposed continuation of<br />
the Advisory Agreement with respect to the Fund in private sessions with<br />
their counsel at which no representatives of management were present.<br />
At each regularly scheduled meeting of the Board and its <strong>com</strong>mittees, the<br />
Board receives and reviews, among other things, information concerning<br />
the Fund’s performance and related services provided by the Manager.<br />
At the meeting at which the renewal of the Advisory Agreement is<br />
considered, particular focus is given to information concerning Fund<br />
performance, <strong>com</strong>parability of fees and total expenses, and profitability.<br />
Advisory Agreement | 51
However, the Board noted that the evaluation process with respect to the<br />
Manager is an ongoing one. In this regard, the Board’s and its <strong>com</strong>mittees’<br />
consideration of the Advisory Agreement included information previously<br />
received at such meetings.<br />
ADVISORY AGREEMENT<br />
After full consideration of a variety of factors, the Board, including<br />
the Independent Trustees, voted to approve the Advisory Agreement.<br />
In approving the Advisory Agreement, the Trustees did not identify<br />
any single factor as controlling, and each Trustee may have attributed<br />
different weights to various factors. Throughout their deliberations,<br />
the Independent Trustees were represented and assisted by<br />
independent counsel.<br />
Nature, Extent, and Quality of Services — In considering the nature, extent,<br />
and quality of the services provided by the Manager under the Advisory<br />
Agreement, the Board reviewed information provided by the Manager<br />
relating to its operations and personnel. The Board also took into<br />
account its knowledge of the Manager’s management and the quality of<br />
the performance of its duties through Board meetings, discussions, and<br />
reports during the preceding year. The Board considered the fees paid<br />
to the Manager and the services provided to the Fund by the Manager<br />
under the Advisory Agreement, as well as other services provided by the<br />
Manager and its affiliates under other agreements, and the personnel<br />
who provide these services. In addition to the investment advisory services<br />
provided to the Fund, the Manager and its affiliates provide administrative<br />
services, stockholder services, oversight of Fund accounting, marketing<br />
services, assistance in meeting legal and regulatory requirements, and<br />
other services necessary for the operation of the Fund and the Trust.<br />
The Board considered the Manager’s management style and the<br />
performance of its duties under the Advisory Agreement. The Board<br />
considered the level and depth of knowledge of the Manager, including<br />
the professional experience and qualifications of its senior and investment<br />
personnel, as well as current staffing levels. The allocation of the Fund’s<br />
brokerage, including the Manager’s process for monitoring “best execution,”<br />
also was considered. The Manager’s role in coordinating the activities of<br />
52 | <strong>USAA</strong> Tax Exempt Short-Term Fund
the Fund’s other service providers also was considered. The Board also<br />
considered the Manager’s risk management processes. The Board<br />
considered the Manager’s financial condition and that it had the financial<br />
wherewithal to continue to provide the same scope and high quality of<br />
services under the Advisory Agreement. In reviewing the Advisory<br />
Agreement, the Board focused on the experience, resources, and<br />
strengths of the Manager and its affiliates in managing the Fund, as well<br />
as the other funds in the Trust.<br />
The Board also reviewed the <strong>com</strong>pliance and administrative services<br />
provided to the Fund by the Manager and its affiliates, including the<br />
Manager’s oversight of the Fund’s day-to-day operations and oversight<br />
of Fund accounting. The Trustees, guided also by information obtained<br />
from their experiences as trustees of the Trust also focused on the<br />
quality of the Manager’s <strong>com</strong>pliance and administrative staff.<br />
Expenses and Performance — In connection with its consideration of the<br />
Advisory Agreement, the Board evaluated the Fund’s advisory fees and<br />
total expense ratio as <strong>com</strong>pared to other open-end investment <strong>com</strong>panies<br />
deemed to be <strong>com</strong>parable to the Fund as determined by the independent<br />
third party in its report. The Fund’s expenses were <strong>com</strong>pared to (i) a group<br />
of investment <strong>com</strong>panies chosen by the independent third party to be<br />
<strong>com</strong>parable to the Fund based upon certain factors, including fund type,<br />
<strong>com</strong>parability of investment objectives and classifications, sales load<br />
type (in this case, investment <strong>com</strong>panies with front-end loads or with no<br />
sales loads), asset size, and expense <strong>com</strong>ponents (the “expense group”)<br />
and (ii) a larger group of investment <strong>com</strong>panies that includes all no-load<br />
and front-end load retail open-end investment <strong>com</strong>panies in similar<br />
investment classifications/objectives as the Fund regardless of asset<br />
size, excluding outliers (the “expense universe”). Among other data, the<br />
Board noted that the Fund’s management fee rate — which includes<br />
advisory and administrative services and the effects of any performance<br />
adjustment — was above the median of its expense group and was the<br />
median of its expense universe. The data indicated that the Fund’s total<br />
expense ratio was below the median of its expense group and its expense<br />
universe. The Board took into account the various services provided to<br />
the Fund by the Manager and its affiliates, including the high quality of<br />
Advisory Agreement | 53
services provided by the Manager. The Board also noted the level and<br />
method of <strong>com</strong>puting the management fee, including any performance<br />
adjustment to such fee.<br />
In considering the Fund’s performance, the Board noted that it reviews<br />
at its regularly scheduled meetings information about the Fund’s<br />
performance results. The Trustees also reviewed various <strong>com</strong>parative<br />
data provided to them in connection with their consideration of the<br />
approval of the Advisory Agreement, including, among other information,<br />
a <strong>com</strong>parison of the Fund’s average annual total return with its Lipper<br />
index and with that of other mutual funds deemed to be in its peer<br />
group by the independent third party in its report (the “performance<br />
universe”). The Fund’s performance universe consisted of the Fund and<br />
all retail and institutional open-end investment <strong>com</strong>panies with the same<br />
classification/objective as the Fund regardless of asset size or primary<br />
channel of distribution. This <strong>com</strong>parison indicated that, among other<br />
data, the Fund’s performance was above the average of its performance<br />
universe and its Lipper index for the one-, three-, and five-year periods<br />
ended December 31, 2012. The Board also noted that the Fund’s percentile<br />
performance ranking was in the top 10% of its performance universe for<br />
the one-year period ended December 31, 2012, and was in the top 5% of<br />
its performance universe for the three- and five-year periods ended<br />
December 31, 2012.<br />
Compensation and Profitability — The Board took into consideration the<br />
level and method of <strong>com</strong>puting the management fee. The information<br />
considered by the Board included operating profit margin information<br />
for the Manager’s business as a whole. The Board also received and<br />
considered profitability information related to the management revenues<br />
from the Fund. This information included a review of the methodology<br />
used in the allocation of certain costs to the Fund. The Trustees reviewed<br />
the profitability of the Manager’s relationship with the Fund before tax<br />
expenses. In reviewing the overall profitability of the management fee to<br />
the Manager, the Board also considered the fact that affiliates provide<br />
shareholder servicing and administrative services to the Fund for which<br />
they receive <strong>com</strong>pensation. The Board also considered the possible<br />
direct and indirect benefits to the Manager from its relationship with the<br />
54 | <strong>USAA</strong> Tax Exempt Short-Term Fund
Trust, including that the Manager may derive reputational and other<br />
benefits from its association with the Fund. The Board also took into<br />
account the high quality of services received by the Fund from the<br />
Manager. The Trustees recognized that the Manager should be entitled<br />
to earn a reasonable level of profits in exchange for the level of services<br />
it provides to the Fund and the entrepreneurial risk that it assumes as<br />
Manager.<br />
Economies of Scale — The Board considered whether there should be<br />
changes in the management fee rate or structure in order to enable the<br />
Fund to participate in any economies of scale. The Board took into<br />
account management’s discussion of the current advisory fee structure.<br />
The Board also considered the effect of the Fund’s growth and size on its<br />
performance and fees, noting that if the Fund’s assets increase over<br />
time, the Fund may realize other economies of scale if assets increase<br />
proportionally more than some expenses. The Board determined that<br />
the current investment management fee structure was reasonable.<br />
Conclusions — The Board reached the following conclusions regarding<br />
the Fund’s Advisory Agreement with the Manager, among others: (i) the<br />
Manager has demonstrated that it possesses the capability and resources<br />
to perform the duties required of it under the Advisory Agreement;<br />
(ii) the Manager maintains an appropriate <strong>com</strong>pliance program; (iii) the<br />
performance of the Fund is reasonable in relation to the performance of<br />
funds with similar investment objectives and to relevant indices; (iv) the<br />
Fund’s advisory expenses are reasonable in relation to those of similar<br />
funds and to the services to be provided by the Manager; and (v) the<br />
Manager’s level of profitability from its relationship with the Fund is<br />
reasonable in light of the nature and high quality of the services provided<br />
by the Manager and the type of fund. Based on its conclusions, the<br />
Board determined that continuation of the Advisory Agreement would<br />
be in the best interests of the Fund and its shareholders.<br />
Advisory Agreement | 55
Trustees<br />
Daniel S. McNamara<br />
Robert L. Mason, Ph.D.<br />
Barbara B. Ostdiek, Ph.D.<br />
Michael F. Reimherr<br />
Paul L. McNamara<br />
Jefferson C. Boyce<br />
Administrator and <strong>USAA</strong> Asset Management Company<br />
Investment Adviser P.O. Box 659453<br />
San Antonio, Texas 78265-9825<br />
Underwriter and <strong>USAA</strong> Investment Management Company<br />
Distributor P.O. Box 659453<br />
San Antonio, Texas 78265-9825<br />
Transfer Agent<br />
<strong>USAA</strong> Shareholder Account Services<br />
9800 Fredericksburg Road<br />
San Antonio, Texas 78288<br />
Custodian and State Street Bank and Trust Company<br />
Accounting Agent P.O. Box 1713<br />
Boston, Massachusetts 02105<br />
Independent<br />
Ernst & Young LLP<br />
Registered Public 100 West Houston St., Suite 1800<br />
Accounting Firm San Antonio, Texas 78205<br />
Mutual Fund<br />
Under “My Accounts” on<br />
Self-Service 24/7 usaa.<strong>com</strong> select “Investments,”<br />
at usaa.<strong>com</strong><br />
then “Mutual Funds“<br />
Or call<br />
Under “Investments” view<br />
(800) 531-<strong>USAA</strong> account balances, or click<br />
(8722) “I want to…,” and select<br />
the desired action.<br />
Copies of the Manager’s proxy voting policies and procedures, approved by the Trust’s Board of<br />
Trustees for use in voting proxies on behalf of the Fund, are available without charge (i) by calling<br />
(800) 531-<strong>USAA</strong> (8722); (ii) at usaa.<strong>com</strong>; and (iii) in summary within the Statement of Additional<br />
Information on the SEC’s website at http://www.sec.gov. Information regarding how the Fund voted<br />
proxies relating to portfolio securities during the most recent 12-month period ended June 30 is<br />
available without charge (i) at usaa.<strong>com</strong>; and (ii) on the SEC’s website at http://www.sec.gov.<br />
The Fund files its <strong>com</strong>plete schedule of portfolio holdings with the SEC for the first and third<br />
quarters of each fiscal year on Form N-Q. These Forms N-Q are available at no charge (i) by calling<br />
(800) 531-<strong>USAA</strong> (8722); (ii) at usaa.<strong>com</strong>; and (iii) on the SEC’s website at http://www.sec.gov. These<br />
Forms N-Q also may be reviewed and copied at the SEC’s Public Reference Room in Washington, D.C.<br />
Information on the operation of the Public Reference Room may be obtained by calling (800) 732-0330.<br />
39592-1113 ©2013, <strong>USAA</strong>. All rights reserved.