z/VSE: 45 Years of Progress - z/VM - IBM
z/VSE: 45 Years of Progress - z/VM - IBM
z/VSE: 45 Years of Progress - z/VM - IBM

You also want an ePaper? Increase the reach of your titles
YUMPU automatically turns print PDFs into web optimized ePapers that Google loves.
The<br />
operational<br />
processes<br />
for<br />
addressing<br />
CICS-related<br />
application<br />
quickly as they could be and this has a<br />
negative effect on the overall service<br />
provided.<br />
Occasionally, there will be something<br />
obviously amiss in the CICS<br />
regions involved and the traditional<br />
CICS monitors, in situ, may provide the<br />
insight needed to begin the investigation<br />
and recovery. Just as <strong>of</strong>ten, the traditional<br />
CICS monitors <strong>of</strong>fer no<br />
immediate clues. Even with a starting<br />
point, it can take time to understand the<br />
flow and use <strong>of</strong> CICS resources involved<br />
in the problem application.<br />
Where problems regularly occur, the<br />
CICS support areas may start to keep<br />
some informal notes about what to look<br />
for in relation to a given application<br />
name. However, these notes must be<br />
referenced quickly and by the whole<br />
team, not just the individual who made<br />
them. It’s vital that the CICS support<br />
area, the application support team, and<br />
anyone else who is expected to support<br />
CICS-based business applications, know<br />
exactly what to look at when calls come<br />
in about a problem with an application.<br />
That knowledge <strong>of</strong>ten resides in informally<br />
held knowledge bases that individuals<br />
use.<br />
What’s needed is a complete guide to<br />
the resources a given application uses<br />
and the ability to observe individual<br />
components using a CICS monitor solution.<br />
Ideally, an automated means <strong>of</strong><br />
presenting this information should be<br />
available—one that can show the status<br />
<strong>of</strong> all aspects <strong>of</strong> the infrastructure in<br />
one easy-to-use view.<br />
Tools available to the support staff<br />
should collect and display applicationspecific<br />
monitoring data for immediate<br />
use where it’s needed. The traditional<br />
monitors in use at most sites are only<br />
able to associate a user-chosen or application<br />
name with transaction response<br />
time type data. This is inadequate, but<br />
may at least provide a crude starting<br />
point, though typically the systems programmer<br />
needs to log on to the specific<br />
monitor that will provide this information<br />
and visibility may only be provided<br />
on one specific CICS region even<br />
though the resources may be spread<br />
across multiple CICS regions.<br />
In summary, the operational processes<br />
for addressing CICS-related<br />
application issues are suboptimal at<br />
many sites. In the heat <strong>of</strong> an incident,<br />
support personnel don’t know and can’t<br />
visualize the entire CICS footprint <strong>of</strong><br />
the named application reported to be<br />
having problems. Time is wasted and<br />
service-impacting incidents are prolonged.<br />
Z<br />
Stephen Mitchell has worked in the <strong>IBM</strong> mainframe<br />
arena for 26 years, most <strong>of</strong> that time as a CICS systems<br />
programmer. He is now the managing director <strong>of</strong> Matter<br />
<strong>of</strong> Fact S<strong>of</strong>tware; the company developed PlexSpy<br />
Application Status Monitor to streamline the support processes<br />
surrounding CICS.<br />
Email: stephen.mitchell@matter<strong>of</strong>facts<strong>of</strong>tware.com<br />
Website: www.plexspy.com<br />
issues are<br />
suboptimal<br />
at many<br />
sites.<br />
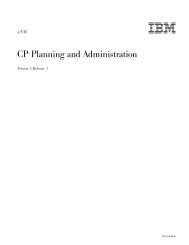
Figure 1: An Example <strong>of</strong> a Scalable CICS Application Infrastructure<br />
5 6 • z / J o u r n a l • O c t o b e r / N o v e m b e r 2 0 1 0