EnvironmEnt rEport - Great Lakes Council - NSW Government
EnvironmEnt rEport - Great Lakes Council - NSW Government
EnvironmEnt rEport - Great Lakes Council - NSW Government

You also want an ePaper? Increase the reach of your titles
YUMPU automatically turns print PDFs into web optimized ePapers that Google loves.
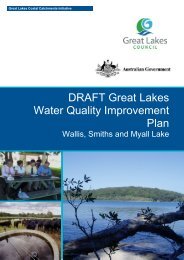
<strong>Great</strong> <strong>Lakes</strong> <strong>Council</strong><br />
2011<br />
State of the<br />
Environment<br />
R e p o r t<br />
<strong>Great</strong> <strong>Lakes</strong> <strong>Council</strong> 2011 State of the Environment Report<br />
i
<strong>Great</strong> <strong>Lakes</strong> <strong>Council</strong> 2011 State of the Environment Report<br />
Prepared by:<br />
<strong>Great</strong> <strong>Lakes</strong> <strong>Council</strong><br />
Natural Systems and Estuaries Section<br />
Enquires should be directed to:<br />
<strong>Great</strong> <strong>Lakes</strong> <strong>Council</strong><br />
PO Box 450<br />
Forster <strong>NSW</strong> 2428<br />
telephone: (02) 6591 7222<br />
fax: (02) 6591 7221<br />
email: council@greatlakes.nsw.gov.au<br />
© 2011 <strong>Great</strong> <strong>Lakes</strong> <strong>Council</strong>
Contents<br />
1 Executive Summary........................................................................................................ 1<br />
2 Introduction..................................................................................................................10<br />
Contents<br />
3 Water..............................................................................................................................14<br />
3.1 Water quality............................................................................................................................................................14<br />
Wallis Lake...........................................................................................................................................................22<br />
Mid Wallamba Estuary....................................................................................................................................24<br />
Pipers Creek........................................................................................................................................................26<br />
Wallis Lake...........................................................................................................................................................28<br />
Charlotte Bay.....................................................................................................................................................30<br />
Smiths Lake........................................................................................................................................................32<br />
Myall <strong>Lakes</strong>.........................................................................................................................................................34<br />
Bombah Broadwater.......................................................................................................................................36<br />
Lower Myall Estuary - Tea Gardens.............................................................................................................38<br />
3.2 Water Usage.............................................................................................................................................................43<br />
3.3 Fish Kills......................................................................................................................................................................45<br />
3.4 Stormwater Pollution............................................................................................................................................46<br />
3.5 Fish Passage Barriers.............................................................................................................................................47<br />
4 Biodiversity....................................................................................................................49<br />
4.1 Native vegetation...................................................................................................................................................49<br />
4.2 Conserved Land......................................................................................................................................................54<br />
4.3 Corridors....................................................................................................................................................................57<br />
4.4 Noxious and environmental weeds.................................................................................................................59<br />
4.5 Seagrass.....................................................................................................................................................................66<br />
4.6 Recovery and threat abatement plans...........................................................................................................68<br />
5 Waste and toxic hazards...............................................................................................75<br />
5.1 Waste..........................................................................................................................................................................75<br />
5.2 Sewage treatment and disposal......................................................................................................................78<br />
5.3 Toxic spills.................................................................................................................................................................80<br />
<strong>Great</strong> <strong>Lakes</strong> <strong>Council</strong> 2011 State of the Environment Report<br />
iii
Contents<br />
6 Land................................................................................................................................81<br />
6.1 Development pressures.......................................................................................................................................81<br />
6.2 Open space...............................................................................................................................................................87<br />
6.3 Roads..........................................................................................................................................................................88<br />
7 Air...................................................................................................................................90<br />
7.1 Electricity usage and green house gas emissions......................................................................................90<br />
8 Noise...............................................................................................................................92<br />
9 Heritage.........................................................................................................................92<br />
9.1 Non-Aboriginal heritage......................................................................................................................................92<br />
9.2 Aboriginal heritage................................................................................................................................................94<br />
10 Community Involvement..............................................................................................96<br />
10.1 Community volunteers........................................................................................................................................96<br />
11 Environmental Plans and Strategies.........................................................................101<br />
12 Acronyms & Abbreviations.........................................................................................103<br />
13 Appendix 1..................................................................................................................104<br />
iv<br />
<strong>Great</strong> <strong>Lakes</strong> <strong>Council</strong> 2011 State of the Environment Report
1 Executive Summary<br />
Located on the lower Mid North Coast of New South Wales the <strong>Great</strong> <strong>Lakes</strong> Local <strong>Government</strong> Area (LGA) of<br />
3,373 km 2 in size supports a rapidly expanding population of approximately 35,000 residents. Containing a<br />
unique environment of immense natural, social and economic value the region relies heavily on the health<br />
of its natural surroundings and landscapes.<br />
The integrity and management of our natural environment is threatened by numerous human impacts and<br />
without adequate protection we risk losing the uniqueness that makes this region a great place to live, work<br />
and play. The growing and widespread recognition during recent years of the potential consequences of<br />
global warming clearly demonstrates the link between the integrity of the environment and our economy<br />
and lifestyle.<br />
Exectuive Summary<br />
Continuation of damaging land uses combined with significant growth in residential and visitor<br />
populations, as well as associated infrastructure provisions remain the greatest threat to the quality of our<br />
environment. As such water deterioration, land degradation and loss of biodiversity are amongst the major<br />
environmental issues facing the region. Appropriate management of these threats is required in order to<br />
avoid a continuing decline in the health of the local environment. Deterioration of the environment will<br />
inevitably impact on our economy, our way of life and the general aesthetics of the LGA.<br />
This State of the Environment report forms the second of four annual reporting and data collection periods.<br />
This second report provides further baseline data to enable monitoring of the health of the region’s<br />
environment over the four year period.<br />
This is the final year that GLC will produce an SoE report in this format. Next years, and proceeding SoE’s will<br />
follow a new template based on the updated Local <strong>Government</strong> Act. The information in this and previous<br />
SoE’s will however influence the new format.<br />
For monitoring purposes, <strong>Council</strong> has established set indicators to assist with determining changes and<br />
trends within the environment. In line with current legislation these indicators fall under several themes<br />
which are Water, Biodiversity, Waste and Toxic Hazards, Land, Air, Noise and Heritage. For this report data<br />
for these themes has been collected from a number of stakeholder organisations which are <strong>Great</strong> <strong>Lakes</strong><br />
<strong>Council</strong>, Mid Coast Water, Industry and Investment (Fisheries), <strong>NSW</strong> Fire Brigade, Country Energy, and the<br />
Department of Environment, Climate Change and Water.<br />
<strong>Great</strong> <strong>Lakes</strong> <strong>Council</strong> 2011 State of the Environment Report 1
Table 1.1<br />
Summary of issues, pressures and responses associated with environmental indicators<br />
Indicator Issues and pressures <strong>Council</strong>’s response<br />
Community response<br />
What you can do<br />
Water quality<br />
Water usage<br />
• Deterioration of water<br />
quality impacts on<br />
environmental and<br />
human health as well<br />
as our economy and<br />
society<br />
• Water pollution occurs<br />
through point-source<br />
or diffuse-source<br />
pollutants entering<br />
stormwater systems<br />
and water ways.<br />
• Removal/disturbance<br />
of vegetation,<br />
increased use of<br />
impervious surfaces<br />
(e.g. roads and<br />
carparks), application<br />
of chemicals (e.g.<br />
fertilisers), disturbance<br />
of acid soils and<br />
disposal of treated<br />
human wastes are all<br />
activities that result in<br />
increased pollutants in<br />
our waterways<br />
• Increasing population<br />
can place greater<br />
pressure on limited<br />
water resources<br />
• Damming/ diverting<br />
of rivers can have<br />
detrimental effects<br />
on the downstream<br />
environment and<br />
therefore, needs to be<br />
limited<br />
• New technologies<br />
have allowed the<br />
more efficient use of<br />
water and their use<br />
can reduce some of<br />
the pressure on water<br />
resources<br />
Water<br />
• Wallis Lake Catchment<br />
Management Plan<br />
• Wallis Lake, Smiths Lake<br />
and Port Stephens/<br />
Myall <strong>Lakes</strong> Estuary<br />
Management Plans<br />
• Water Quality<br />
Improvement Plan<br />
for Wallis, Smiths &<br />
Myall <strong>Lakes</strong> - Coastal<br />
Catchments Initiative<br />
• Healthy <strong>Lakes</strong> Program<br />
• Darawakh Frogalla<br />
Wetlands Management<br />
Plan<br />
• WaterWatch community<br />
program<br />
• Structural stormwater<br />
Solutions (e.g. Gross<br />
Pollutant Traps)<br />
• Development<br />
Assessment and Strategic<br />
Planning<br />
• Sustainable Farming<br />
programs<br />
• Review Forster<br />
Stormwater Plan<br />
• Wallis Lake Wetland<br />
Strategy<br />
• MidCoast Water<br />
is undertaking a<br />
Sustainable Water Cycle<br />
Management project,<br />
investigating options<br />
for improving water<br />
supply and educating the<br />
community through the<br />
WaterWise program<br />
• In cooperation with<br />
GLC, Midcoast Water is<br />
introducing a recycled<br />
water scheme in the<br />
<strong>Great</strong> <strong>Lakes</strong>, including<br />
the Forster/Tuncurry Golf<br />
Course and Tuncurry<br />
Playing fields.<br />
• Avoid putting any<br />
substance down stormwater<br />
drains<br />
• Wash cars on lawn<br />
• Limit chemical & fertiliser<br />
use in the garden/farm<br />
• Pick up after your pets<br />
• Dispose of waste and litter<br />
in bins<br />
• Sweep leaves and debris<br />
away from stormwater<br />
drains and dispose of or<br />
mulch<br />
• Become involved in<br />
<strong>Council</strong>’s WaterWatch<br />
program<br />
• Plant native plants to help<br />
stabilize soil and filter<br />
pollutants<br />
• Prevent stock from entering<br />
waterways<br />
• Undertake sustainable<br />
grazing including managing<br />
groundwater<br />
• Protect and enhance<br />
riparian vegetation and<br />
vegetation on steep slopes<br />
• Fix leaking taps<br />
• Install a rainwater tank<br />
• Invest in water efficient<br />
showerheads, washing<br />
machine and dishwasher<br />
• Take short showers instead<br />
of baths<br />
• Plant drought tolerant<br />
natives<br />
2 <strong>Great</strong> <strong>Lakes</strong> <strong>Council</strong> 2011 State of the Environment Report
Indicator Issues and pressures <strong>Council</strong>’s response<br />
Algae blooms<br />
Fish kills<br />
Stormwater<br />
pollution<br />
• Algae blooms occur<br />
naturally but are often<br />
the result of human<br />
practices<br />
• Algae blooms can<br />
occur due to excessive<br />
nutrients being<br />
released into the water<br />
through fertiliser,<br />
detergents and other<br />
chemical use and from<br />
the alteration of water<br />
flows<br />
• Some algae blooms are<br />
dangerous to animal<br />
and human health,<br />
such as blue-green<br />
algae<br />
• Reduction in water<br />
quality or changes in<br />
water temperature,<br />
oxygen levels and pH<br />
can cause fish kills<br />
• Many human activities<br />
influence water quality<br />
as noted above<br />
• Stormwater pollution<br />
is any pollution that is<br />
collected by rainwater<br />
and washes down<br />
natural and man<br />
made drains into our<br />
oceans and waterways.<br />
This includes loose<br />
sediment, litter, leaves<br />
and chemicals<br />
• Gross pollutant<br />
traps can trap large<br />
pollutants and stop<br />
them from reaching<br />
and polluting<br />
waterways. However,<br />
these structures only<br />
work for the small<br />
areas they can service<br />
and they do not<br />
remove chemicals<br />
(although constructed<br />
wetlands can reduce<br />
nutrients/chemicals)<br />
• See ‘Water Quality’<br />
section above<br />
• See ‘Water Quality’<br />
section above<br />
• See ‘Water Quality’<br />
section above<br />
Community response<br />
What you can do<br />
• See ‘Water Quality’ section<br />
above<br />
• See ‘Water Quality’ section<br />
above<br />
• See ‘Water Quality’ section<br />
above<br />
Executive summary<br />
<strong>Great</strong> <strong>Lakes</strong> <strong>Council</strong> 2011 State of the Environment Report 3
Indicator Issues and pressures <strong>Council</strong>’s response<br />
Fish passage<br />
barriers<br />
Native vegetation<br />
Conserved land<br />
Corridors<br />
• Obstacles such as<br />
causeways, road<br />
crossings, dams,<br />
weirs and culverts<br />
can obstruct the<br />
natural migration<br />
and breeding of fish,<br />
thus reducing their<br />
numbers.<br />
• Where appropriate,<br />
structures that<br />
obstruct fish need<br />
to be removed or<br />
modified (e.g. with Fish<br />
Ways)<br />
• A growing population<br />
and associated<br />
development has<br />
meant that vegetated<br />
areas are being<br />
reduced or fragmented<br />
by residential<br />
development or<br />
clearing for agriculture.<br />
• Native vegetation<br />
provides us with a<br />
number of services<br />
and resources (cleaner<br />
air and water, healthier<br />
more productive soil,<br />
wildlife habitat, shade<br />
and atmospheric<br />
regulation, carbon<br />
storage etc.) and<br />
its value is often<br />
underestimated<br />
• Public and private<br />
conservation provides<br />
for the preservation of<br />
biodiversity and native<br />
vegetation<br />
• Vegetated corridors<br />
have been identified<br />
as a way to link up<br />
fragmented vegetation<br />
and to aid the<br />
movement of fauna.<br />
• The <strong>NSW</strong> Department<br />
of Primary Industries is<br />
undertaking a project to<br />
identify and progressively<br />
remove or modify fish<br />
passage barriers.<br />
Biodiversity<br />
• <strong>Great</strong> <strong>Lakes</strong> <strong>Council</strong> is<br />
currently preparing a<br />
Vegetation Strategy<br />
to identify, prioritise,<br />
manage and protect<br />
native vegetation within<br />
the LGA<br />
• Tree Preservation Order<br />
• Revegetation works<br />
• There is a need to<br />
establish a <strong>Great</strong> <strong>Lakes</strong><br />
Protected Area Network<br />
• There is a need to<br />
identify, protect and<br />
develop corridors as<br />
part of the Vegetation<br />
Strategy<br />
Community response<br />
What you can do<br />
• The <strong>NSW</strong> Department<br />
of Primary Industries is<br />
undertaking a project to<br />
identify and progressively<br />
remove or modify fish<br />
passage barriers.<br />
• Plant native trees and plants<br />
wherever possible<br />
• Retain native trees,<br />
especially older and large<br />
habitat trees<br />
• Place a portion of your<br />
land under a conservation<br />
agreement<br />
• Work with neighbouring<br />
landowners to link up<br />
fragmented vegetation<br />
corridors<br />
• Place a portion of your<br />
land under a conservation<br />
agreement<br />
• Work with neighbouring<br />
landowners, <strong>Council</strong> and<br />
National Parks to link up<br />
fragmented vegetation<br />
corridors by strategically<br />
planting native trees on<br />
your land<br />
4 <strong>Great</strong> <strong>Lakes</strong> <strong>Council</strong> 2011 State of the Environment Report
Indicator Issues and pressures <strong>Council</strong>’s response<br />
Noxious and<br />
environmental<br />
weeds<br />
Threatened<br />
species<br />
Waste<br />
• Weed invasion<br />
displaces native plants<br />
and animals and costs<br />
millions of dollars to<br />
control.<br />
• Most noxious and<br />
environmental weeds<br />
are introduced plants<br />
that have escaped<br />
from people’s gardens<br />
or fish ponds<br />
• The number of<br />
threatened species,<br />
populations and<br />
endangered ecological<br />
communities is<br />
increasing as a direct<br />
result of human<br />
modification of<br />
natural areas (i.e.<br />
vegetation removal<br />
and degradation).<br />
• Nationally, our<br />
increasing population<br />
and material wealth/<br />
disposable lifestyle has<br />
resulted in an increase<br />
in waste produced<br />
• Ideally waste should be<br />
seen as a resource and<br />
can be reused, recycled<br />
or reduced<br />
• Reducing waste helps<br />
current landfill sites<br />
last longer (thus<br />
reducing the need to<br />
source further waste<br />
fill areas)<br />
• <strong>Council</strong>’s Noxious Weeds<br />
Officer inspects and<br />
controls weeds and<br />
educates the community<br />
as resources allow<br />
• Member of Mid<br />
Coast Weed Advisory<br />
Committee<br />
• Support of Bushcare and<br />
Coastcare groups<br />
• <strong>Council</strong> is a partner in<br />
implementing actions<br />
of Recovery Plans for<br />
threatened species<br />
• Facilitation and support<br />
of Koala Working Group<br />
(Hawks Nest Tea Gardens<br />
Endangered Koala<br />
population)<br />
• Development<br />
Assessment/ Strategic<br />
Planning<br />
• Bulahdelah Waste<br />
Transfer Station EMS<br />
Waste and toxic hazards<br />
• Introduction of the 3<br />
bin system (rubbish,<br />
recycling, greenwaste)<br />
to improve separation of<br />
waste and recycling<br />
• Waste education<br />
program<br />
• Active member of<br />
MidWaste<br />
• Development of Waste<br />
Strategy<br />
Community response<br />
What you can do<br />
• Remove and suppress<br />
noxious and environmental<br />
weeds on your land<br />
• Join a Bushcare or Coastcare<br />
group to help remove<br />
weeds from our parks,<br />
reserves and foreshore areas<br />
• Try to use locally native<br />
plants rather than exotics<br />
for your garden<br />
• Plant native trees<br />
• Remove and suppress<br />
noxious and environmental<br />
weeds<br />
• Report sightings of<br />
endangered species to<br />
<strong>Council</strong><br />
• Join a Bushcare or Coastcare<br />
group<br />
• Work with neighbouring<br />
landowners, <strong>Council</strong> and<br />
National Parks to link up<br />
fragmented vegetation<br />
corridors by strategically<br />
planting native trees on<br />
your land<br />
• Drive carefully in vegetated<br />
areas<br />
• Retain native trees,<br />
especially older and large<br />
habitat trees<br />
• Avoid purchasing products<br />
with excess packaging<br />
• Buy in bulk<br />
• Use calico bags instead of<br />
plastic shopping bags<br />
• Recycle plastics, cans,<br />
cartons, paper and<br />
cardboard<br />
• Purchase items with<br />
recycled content (eg<br />
recycled paper)<br />
• Reuse items, buy second<br />
hand goods or borrow<br />
items where possible<br />
• Compost greenwaste<br />
or place food scraps in<br />
wormfarm<br />
Executive summary<br />
<strong>Great</strong> <strong>Lakes</strong> <strong>Council</strong> 2011 State of the Environment Report 5
Indicator Issues and pressures <strong>Council</strong>’s response<br />
Sewage treatment<br />
and disposal<br />
Toxic spills<br />
Development<br />
pressures<br />
Open space<br />
• Increasing population<br />
means increasing<br />
amounts of sewage to<br />
treat and dispose<br />
• Harder to regulate and<br />
monitor the quality<br />
of On-site Sewage<br />
Management Systems<br />
(OSMS)<br />
• One-off spills of<br />
certain chemicals can<br />
do a great deal of<br />
damage to wildlife,<br />
the environment and<br />
human health<br />
• Increasing<br />
development, as a<br />
result of increasing<br />
population and<br />
affluence, threatens<br />
the quality of our<br />
local and global<br />
environment (through<br />
increase in vegetation<br />
removal, water and air<br />
pollution, biodiversity<br />
loss and consumption<br />
of natural resources)<br />
• Strategic planning<br />
allows the<br />
consideration and<br />
management of a<br />
number of conflicting<br />
land uses in a<br />
systematic manner<br />
• Open space has a<br />
number of social and<br />
environmental benefits<br />
• OSMS inspections<br />
• Development<br />
Assessment<br />
• Monitoring the incidence<br />
and location of spills<br />
• Working with agencies<br />
Land<br />
• Strategic planning and<br />
zoning<br />
• Review of DA’s that effect<br />
environment<br />
• Recreation and Open<br />
Space Strategy (draft)<br />
Community response<br />
What you can do<br />
• Maintain adequate and<br />
functioning on-site effluent<br />
systems<br />
• Be careful with what is<br />
disposed of in the sewer<br />
• Report spills and pollution<br />
• Design, build, renovate<br />
or buy homes and land<br />
that are environmentally<br />
sensitive (e.g. north facing,<br />
water tanks, solar hot water,<br />
native gardens, limited<br />
lawns, energy and water<br />
efficient, use of sustainable<br />
materials)<br />
• Participate in public<br />
consultation process,<br />
including commenting on<br />
draft plans<br />
• Avoid dumping garden<br />
clippings in parks and<br />
reserves<br />
• If you back onto a reserve<br />
consult <strong>Council</strong> before<br />
mowing or maintaining<br />
reserve boundaries<br />
• Join a Bush Care group<br />
• Recognise the value of<br />
parks and reserves<br />
6 <strong>Great</strong> <strong>Lakes</strong> <strong>Council</strong> 2011 State of the Environment Report
Roads<br />
Indicator Issues and pressures <strong>Council</strong>’s response<br />
Electricity usage<br />
Noise pollution<br />
Non-Aboriginal<br />
Heritage and<br />
Aboriginal<br />
Heritage<br />
• Roads have a negative<br />
impact on the<br />
environment through<br />
chemical and noise<br />
pollution (from cars),<br />
vegetation removal,<br />
fragmentation of<br />
habitat, death of<br />
native animals through<br />
collision, increase in<br />
erosion and the spread<br />
of weeds.<br />
• Dirt roads near<br />
waterways that do not<br />
have adequate erosion<br />
control methods<br />
result in a reduction of<br />
water quality through<br />
sediment run-off.<br />
• Electricity from coalfuelled<br />
sources relies<br />
on an unsustainable<br />
resource and pollutes<br />
our atmosphere with<br />
greenhouse gases.<br />
This is contributing<br />
to global warming,<br />
which results in erratic<br />
weather patterns and<br />
conditions and added<br />
pressure to the survival<br />
of wildlife and humans.<br />
• Noise pollution can<br />
lead to stress and is<br />
regulated through the<br />
DA process<br />
• Aboriginal, Cultural<br />
and natural heritage<br />
is subject to pressures<br />
from increasing<br />
development and<br />
urbanisation, tourism<br />
and ageing processes<br />
• Erosion control works<br />
• Roadside Management<br />
Project (Hunter REMS)<br />
• EMS for sediment and<br />
erosion control on road<br />
construction projects.<br />
Air<br />
• Energy Action Plan<br />
• BASIX<br />
• Sustainability projects<br />
• GLC’s Sustainability<br />
Advisory Committee<br />
(S-Team)<br />
• Implementation<br />
and review of GLC’s<br />
Sustainability Strategy.<br />
Noise<br />
• DA Process<br />
Heritage<br />
• Consultation through<br />
strategic planning and<br />
DA process<br />
Community response<br />
What you can do<br />
• Try to limit car use (as<br />
demand for roads leads<br />
to supply)- cycle, walk,<br />
use public transport or<br />
carpool wherever possible<br />
as these are the most<br />
environmentally friendly<br />
forms of transport<br />
• Be aware of wildlife whilst<br />
driving, especially at dusk<br />
• Buy energy efficient<br />
appliances (e.g. smaller<br />
televisions and computer<br />
screens, appliances and<br />
light globes with a high<br />
energy star rating)<br />
• Turn off appliances at wall<br />
when not in use<br />
• Reduce energy use in the<br />
home with insulation,<br />
natural lighting etc.<br />
• Purchase power sourced<br />
from renewable sources.<br />
• Avoid use of noisy<br />
equipment outside the<br />
hours of 8am-8pm<br />
• Increase knowledge of<br />
heritage items and report<br />
any findings<br />
Executive summary<br />
<strong>Great</strong> <strong>Lakes</strong> <strong>Council</strong> 2011 State of the Environment Report 7
The <strong>Great</strong> <strong>Lakes</strong> unique and significant natural<br />
environment deserves protection to ensure its<br />
longevity for future generations whilst providing<br />
for appropriate and sustainable growth and<br />
development. Unless appropriate and effective<br />
action is taken now we stand to lose the very<br />
asset which makes the <strong>Great</strong> <strong>Lakes</strong> region a<br />
desirable and privileged place for us to live and<br />
enjoy.<br />
Summary of<br />
Recommendations for<br />
<strong>Council</strong>’s Management Plan<br />
A consideration of environmental issues and<br />
needs recognised in the State of Environment<br />
Report is necessary in completing council’s annual<br />
reporting cycle Figure 1.1. The issues raised in<br />
the State of Environment Report should be used<br />
by the council for developing its environmental<br />
strategies within the management plan and for<br />
allocating resources (budgeting, work programs).<br />
The 2010-11 SoE report has identified a number<br />
of needs through analysis of the indicators in this<br />
report. In relation to these identified needs a list of<br />
key projects and actions has been recommended<br />
by the SoE for consideration in <strong>Council</strong>’s next<br />
Management Plan. These recommended projects<br />
and actions are presented below under relevant<br />
council sections.<br />
Figure 1.1<br />
The Annual<br />
Reporting Cycle<br />
Source: Department<br />
of Local <strong>Government</strong><br />
Management plan<br />
Implementation of plan<br />
Monitoring and quarterly<br />
reporting<br />
Annual report (including<br />
SoE report)<br />
Figure 1.2<br />
Wallis Lake at Forster<br />
8 <strong>Great</strong> <strong>Lakes</strong> <strong>Council</strong> 2011 State of the Environment Report
Natural Systems & Estuaries<br />
• Wallis Lake Catchment Management (Review<br />
and progress implementation)<br />
• Healthy <strong>Lakes</strong> Program (expand initiatives<br />
under new programs)<br />
• Improved Stormwater Management (review<br />
and update plans)<br />
• Implement actions identified in the Water<br />
Quality Improvement Plan<br />
• Improve performance and management of<br />
stormwater treatment devices<br />
• Work with other agencies to remediate Fish<br />
Passage Barriers<br />
• Develop a Vegetation Monitoring Protocol<br />
• Biodiversity Conservation Framework<br />
(develop and adopt)<br />
• Vegetation Strategy (refine, update and<br />
implement)<br />
• Develop a policy/direction for Development<br />
Assessment advice<br />
• Acquire Satellite Imagery<br />
• Assist in implementation of Threatened<br />
Species Recovery Plans and Priority Action<br />
Statements<br />
• Biodiversity education (develop and expand<br />
initiatives)<br />
• Implement and review Sustainability Strategy<br />
• Develop Education for Sustainability strategy<br />
and environmental initiatives<br />
• Implement water quality monitoring as<br />
detailed in the Water Quality Improvement<br />
Plan<br />
• Align water quality monitoring sites and time<br />
with the <strong>NSW</strong> Shellfish Quality Assurance<br />
Program<br />
• Implement Wallis Lake Wetland Strategy<br />
• Darawakh Wetland rehabilitation plan<br />
implementation<br />
• Estuary management plan implementation<br />
(Wallis, Smiths Myall/ Port Stephens<br />
Engineering services<br />
• Improve performance and management of<br />
stormwater treatment devices<br />
• Review and Improve cleanout reporting<br />
procedures<br />
• Roadside Environmental Management Plan<br />
(progress development)<br />
Parks and Recreation<br />
• Develop Landscaping Code<br />
• Continue and improve weed management<br />
activities<br />
Waste services<br />
• Continue and improve waste education<br />
initiatives<br />
• Develop and implement Waste Strategy<br />
<strong>Council</strong> wide<br />
• Acquire Satellite Imagery<br />
• Expand implementation of Sustainable<br />
Purchasing Policy<br />
• Collaborative Framework for consideration of<br />
Aboriginal Heritage<br />
• Review and Implement GLC’s Sustainability<br />
Strategy<br />
<strong>Great</strong> <strong>Lakes</strong> <strong>Council</strong> 2011 State of the Environment Report 9
2 Introduction<br />
2.1 An overview of<br />
the <strong>Great</strong> <strong>Lakes</strong><br />
The <strong>Great</strong> <strong>Lakes</strong> Local <strong>Government</strong> Area (LGA) is<br />
3,373 km 2 in size and is located on the lower Mid<br />
North Coast of New South Wales, approximately<br />
320 km north of Sydney (Figure 2.1.1). For<br />
planning purposes it is considered part of the<br />
Hunter Region (Hunter Regional Environmental<br />
Plan) and is bounded by the local government<br />
areas of Port Stephens in the south, <strong>Great</strong>er<br />
Taree in the north and Gloucester in the west. It<br />
is 85 kilometres at its widest point, 62 kilometres<br />
north to south, and has a total coastline of 145<br />
kilometres.<br />
<strong>Great</strong> <strong>Lakes</strong> has a temperate climate, averaging<br />
a daily minimum of 170C and maximum of 270C<br />
during summer and daily minimum of 80C and<br />
maximum of 170C in winter, and has an average<br />
coastal rainfall of 1331mm.<br />
The LGA supports a range of industries and<br />
commercial activities, which form the basis of the<br />
local economy. Tourism and primary production<br />
(oyster, commercial fishing and grazing/ timber<br />
production) are the most significant industries in<br />
the LGA.<br />
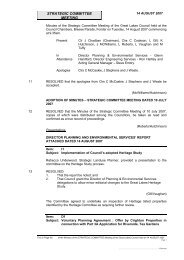
Figure 2.1.1 The <strong>Great</strong> <strong>Lakes</strong> Region<br />
Figure 2.1.2 The <strong>Great</strong> <strong>Lakes</strong> natural environment<br />
10 <strong>Great</strong> <strong>Lakes</strong> <strong>Council</strong> 2011 State of the Environment Report
The viability and sustainability of all these<br />
industries critically relies upon a healthy and<br />
functioning local environment.<br />
Figure 2.1.3 Water quality testing in Wallis Lake<br />
The <strong>Great</strong> <strong>Lakes</strong> possesses a unique environment<br />
of immense natural beauty, which includes<br />
extensive waterways, national parks, rural regions<br />
and mountain ranges. These landscapes provide<br />
habitat for an incredible diversity of native plant<br />
and animals. Vegetation communities include<br />
rainforest, moist and dry forests, wetlands and<br />
swamps, coastal heaths, seagrass beds, dunal<br />
formations and natural grasslands. To date,<br />
preliminary data suggests that over 500 fauna<br />
species and 1,200 native plant species inhabit the<br />
LGA. This includes rare, significant and threatened<br />
species.<br />
Introduction<br />
The <strong>Great</strong> <strong>Lakes</strong> region is expanding; in large<br />
partly due to the “sea-change” phenomenon,<br />
which is a trend that has seen a population<br />
explosion in coastal towns on the eastern<br />
seaboard. The <strong>Great</strong> <strong>Lakes</strong> LGA supports a<br />
population of 35,924. The population growth,<br />
measured from June 2011, is at 1.33% per annum.<br />
The region also experiences population surges<br />
during holiday periods with between 100,000<br />
and 150,000 tourists frequenting the area each<br />
year, placing considerable pressure on existing<br />
infrastructure and the local environment.<br />
Over the past ten years a number of factors have<br />
been identified as placing an increased pressure<br />
on the <strong>Great</strong> <strong>Lakes</strong> environment. Continuation of<br />
damaging land uses combined with significant<br />
growth in residential and visitor populations,<br />
as well as associated infrastructure provisions,<br />
probably remains the greatest threat. Water<br />
deterioration, land degradation and loss of<br />
biodiversity are amongst the major environmental<br />
issues facing the region and unless these<br />
threats can be managed appropriately we will<br />
experience a continuing decline in the health<br />
of the local environment. The deterioration of<br />
the environment will inevitably impact on our<br />
economy, way of life and the general aesthetics of<br />
the LGA. Therefore, it is imperative that we protect<br />
and manage our <strong>Great</strong> <strong>Lakes</strong> environment for<br />
present and future generations, whilst providing<br />
for appropriate and sustainable growth and<br />
development.<br />
2.2 State of the Environment<br />
Reporting in <strong>NSW</strong><br />
State of the Environment (SoE) reporting provides<br />
an ongoing mechanism to monitor and to, in<br />
turn, implement steps to improve the condition<br />
of the local environment. The measurement of<br />
established indicators to determine changes<br />
and trends within the environment allows<br />
this report to document environmental<br />
change, both positive and negative, to assist<br />
in the management of our natural resources.<br />
Furthermore, SoE Reporting is intended to give an<br />
account of government, industry and community<br />
activities to protect and restore the environment.<br />
Finally, SoE Reporting provides a valuable<br />
education and awareness tool for the general<br />
community and all tiers of government.<br />
Local <strong>Government</strong> plays a vital role in<br />
environmental management and is one of the<br />
primary land management authorities that is<br />
responsible for decision-making and regulation of<br />
land use development as well as environmental<br />
monitoring and management programs.<br />
As several areas of <strong>Council</strong> core business<br />
directly relates to or influences environmental<br />
management, environmental reporting within<br />
local government is an important process.<br />
<strong>Great</strong> <strong>Lakes</strong> <strong>Council</strong> 2011 State of the Environment Report 11
The State <strong>Government</strong> identified the need<br />
for environmental reporting at the local level<br />
and established that <strong>Council</strong>s be responsible<br />
for preparing SoE reports on an annual basis.<br />
Hence a legislative framework under the Local<br />
<strong>Government</strong> Act 1993 was established, which<br />
required:<br />
• <strong>Council</strong> to prepare a Comprehensive SoE<br />
Report every four (4) years, coinciding with<br />
the end of the financial year following the<br />
general <strong>Council</strong> elections and the production<br />
of supplementary SoE reports every year in<br />
the interim;<br />
• The SoE report to specifically investigate<br />
eight (8) environmental sectors: land, air,<br />
water biodiversity, waste, noise, Aboriginal<br />
heritage and non Aboriginal heritage;<br />
• Within each of the above sectors, <strong>Council</strong><br />
give reference to Management Plans, special<br />
<strong>Council</strong> projects and to the impact of<br />
<strong>Council</strong>’s activities and decision-making on<br />
the environment;<br />
• That SoE reporting be tied to the<br />
development and documentation of<br />
<strong>Council</strong>’s Annual Management Plan;<br />
• That the Comprehensive SoE Report be<br />
based on a “Pressure-State-Response” model<br />
(see below);<br />
• That SoE reporting Include an emphasis<br />
on and commitment to implementing the<br />
principles and practices of Ecologically<br />
Sustainable Development (ESD);<br />
• That the SoE reporting process consults<br />
and involves the community (including<br />
environmental groups) and produces<br />
the report in a format that is easily<br />
understandable by the community.<br />
Furthermore, the Threatened Species<br />
Conservation Act 1995 requires that a <strong>Council</strong><br />
that is identified within an approved Recovery<br />
Plan or approved Threat Abatement Plan as being<br />
responsible for the implementation of actions<br />
within such plans, shall report on the actions that<br />
it has undertaken within the SoE Report.<br />
Pressure-State-Response Model<br />
The pressure-state-response model for reporting<br />
on environmental sectors, includes:<br />
• a pressure component, which identifies and<br />
describes the pressure that human activities<br />
put on their immediate environment and<br />
their natural surroundings,<br />
• a state component, which identifies and<br />
describes the current and projected state of<br />
the environment, and<br />
• a response component, which identifies<br />
and describes the response of councils,<br />
government agencies, industry and<br />
communities to the pressures on, and state<br />
of, the environment.<br />
For example, when reporting on water quality, an<br />
increase in nutrients entering a local waterway<br />
may be monitored and identified. Increased<br />
nutrients may lead to algal blooms and declining<br />
aquatic health (thus is recognised as a pressure).<br />
The declining condition of the quality of the local<br />
waterway constitutes the state. Once identified<br />
and recognised, the issue might be addressed<br />
through an education program on stormwater<br />
pollution within the catchment or a structural<br />
solution (which is the response).<br />
Whilst adopted by most <strong>NSW</strong> <strong>Council</strong>s, the model<br />
does have some identified shortcomings and<br />
limitations. In some cases indicators cannot be<br />
easily categorised as a state, pressure or response<br />
and some times a particular indicator may fall in<br />
all three categories. For example, the clearing of<br />
vegetation can be an indicator of the “state” of<br />
vegetation in the local environment, “pressure”<br />
for biodiversity issue, or “response” if the rate of<br />
clearance is arrested. Furthermore, there is not<br />
always a clear indication of cause and effect.<br />
With these limitations in mind, this SoE report<br />
does not heavily utilise the PSR model. Rather,<br />
each sector (e.g. Water, Biodiversity etc) contains<br />
an introductory section that discusses the<br />
state and pressures of the sector in general<br />
terms. The results section of each indicator also<br />
provides information on the State component.<br />
The response of council and other groups is<br />
discussed specifically, where applicable. A special<br />
section, Environmental Plans and Strategies also<br />
provides an account of <strong>Council</strong>’s response to<br />
environmental issues.<br />
12 <strong>Great</strong> <strong>Lakes</strong> <strong>Council</strong> 2011 State of the Environment Report
Ecological Sustainable Development (ESD)<br />
Ecological sustainable development (ESD) means<br />
“using, conserving and enhancing the community’s<br />
resources so that ecological processes, on which<br />
life depends, are maintained, and the total quality<br />
of life, now and in the future, can be increased”<br />
(Commonwealth of Australia 1992).<br />
Essentially, ESD is a means of effectively utilising<br />
resources with minimal environmental change to<br />
protect the natural environment and its resources/<br />
services for future generations. An important part of<br />
ESD is the application of the Precautionary Principle.<br />
In essence, this suggests that where there are risks of<br />
serious environmental damage, that lack of scientific<br />
knowledge should not be used to postpone or<br />
defer environmental protection. As such, it requires<br />
adequate scientific knowledge to form the basis of<br />
all environmental decision-making.<br />
Typically local government has traditionally<br />
undertaken natural resource management,<br />
economic development and provision of social<br />
services in isolation from each other. However<br />
it has since been recognised that these factors<br />
are related and that they interact in a complex<br />
manner. Subsequently, <strong>Council</strong>s are now<br />
required to undertake the management of their<br />
regulatory and service functions in an ecologically<br />
sustainable manner, as legislatively required<br />
under the Local <strong>Government</strong> Act.<br />
Under the ESD Regulation, <strong>Council</strong>s must consider<br />
its most recent comprehensive SoE report when<br />
preparing the part of its draft management<br />
plan dealing with environmental protection<br />
activities (cl 6M(b)). As such SoE reports are a<br />
key mechanism in identifying and evaluating<br />
sustainability issues.<br />
Figure 2.2.1 Ocean frontage at Forster<br />
2.3 State of the Environment<br />
Reporting in the <strong>Great</strong> <strong>Lakes</strong><br />
In 2004, <strong>Great</strong> <strong>Lakes</strong> <strong>Council</strong> implemented a<br />
revised approach to SoE Reporting that aimed<br />
to develop an effective and useable document<br />
designed to feed more effectively into <strong>Council</strong>s<br />
Management Plan for the purpose of identifying<br />
resources and directing staff work programs<br />
in line with priority environmental projects. To<br />
achieve this, a SoE working group comprising of<br />
representatives of various <strong>Council</strong> sections was<br />
formed.<br />
The report provides information on the state of<br />
the <strong>Great</strong> <strong>Lakes</strong> environment for the period of 1st<br />
July 2010 to 30th June 2011. It forms the second<br />
data collection period for a four year annual<br />
reporting schedule, and ultimately provides for<br />
the preparation of a comprehensive report at the<br />
end of the fourth year. It is in this comprehensive<br />
report that trend analysis will be conducted based<br />
on the 4 years of data.<br />
Future Indicators for Subsequent SoE<br />
Reporting<br />
There are presently a number of gaps in<br />
environmental reporting conducted as part<br />
of SoE for the <strong>Great</strong> <strong>Lakes</strong> LGA. This is despite<br />
considerable efforts in recent years to rationalise,<br />
enhance and refine appropriate indicators.<br />
Also, SoE reporting needs to continually evolve<br />
and improve as new environmental issues and<br />
management arises so that these are incorporated<br />
or represented.<br />
<strong>Great</strong> <strong>Lakes</strong> <strong>Council</strong> has recently launched its<br />
Community Strategic Plan (CSP) as required under<br />
the Local <strong>Government</strong> Act (1993). The information<br />
presented in SoE reports will be useful to<br />
enable monitoring, evaluation and reporting on<br />
environmental objectives that are identified as<br />
“key directions” within the CSP.<br />
This is the final year that GLC will produce an SoE<br />
report in this format. Next years, and proceeding<br />
SoE’s will follow a new template based on the<br />
updated Local <strong>Government</strong> Act. The information<br />
in this and previous SoE’s will however influence<br />
the new format.<br />
Introduction<br />
<strong>Great</strong> <strong>Lakes</strong> <strong>Council</strong> 2011 State of the Environment Report 13
3 Water<br />
3.1 Water quality<br />
Introduction<br />
The <strong>Great</strong> <strong>Lakes</strong> region depends heavily on the<br />
health of local waterways and their catchments. The<br />
waterways form the basis of the region’s economy<br />
(supporting tourism and primary production),<br />
contribute to our way of life and amenity, and<br />
provide habitat for extraordinary biological systems.<br />
The region’s catchments are under increasing<br />
environmental pressure from pollution and impacts<br />
associated with catchment land use, development<br />
and tourism, potentially resulting in a decline in the<br />
health of our waterways.<br />
In 2002, the majority of our waterways were<br />
classified as “generally healthy -modified” by the<br />
Healthy Rivers Commission (now the Natural<br />
Resources Commission).<br />
Between 2005 and 2007, the <strong>Great</strong> <strong>Lakes</strong> Water<br />
Quality Improvement Plan ranked Wallis Lake<br />
as moderately disturbed with some areas as<br />
high conservation value, Smiths Lake as high<br />
conservation value; and, the Myall <strong>Lakes</strong> ranged<br />
between moderately disturbed and high<br />
conservation value.<br />
All our local waterways are critically susceptible to<br />
increasing environmental pressures; a Hepatitis A<br />
event in oysters in Wallis Lake in 1997, reoccurring<br />
blue-green algae in Myall <strong>Lakes</strong> and episodic fish<br />
kills are all examples of what can go wrong.<br />
Water quality results have been presented in this<br />
report in two sections, ecological and human health.<br />
A summary of management responses undertaken<br />
in each estuary is also presented in the ecological<br />
section.<br />
Water Quality - Ecological Health<br />
The health of the waterways in the <strong>Great</strong> <strong>Lakes</strong><br />
region is fundamental for achieving the Vision<br />
set out in the community strategic plan ‘<strong>Great</strong><br />
<strong>Lakes</strong> 2030’: “A unique, sustainable and enhanced<br />
environment with quality lifestyle opportunities<br />
created through clever development and<br />
appropriate infrastructure and services”. Since<br />
2008 the <strong>NSW</strong> <strong>Government</strong> Office of Environment<br />
and Heritage have undertaken an ecological<br />
health monitoring program in Wallis Lake as part<br />
of the state-wide Monitoring, Evaluation and<br />
Reporting Strategy (MER). As part of the Strategy,<br />
Wallis Lake was selected as one of seven estuaries<br />
across the state to be sampled each year to track<br />
inter-annual variability in two ecological health<br />
indicators; chlorophyll a (the amount of algae)<br />
and turbidity (the amount of sediment). In 2011,<br />
<strong>Great</strong> <strong>Lakes</strong> <strong>Council</strong> and the Federal <strong>Government</strong><br />
(through their Caring for our Country Program)<br />
have provided funding to expand this monitoring<br />
program to cover additional sites across the<br />
<strong>Great</strong> <strong>Lakes</strong> Local <strong>Government</strong> area. The Office<br />
of Environment and Heritage have as a result,<br />
provided an independent scientific evaluation on<br />
the ecological health of Wallis Lake, Smiths Lake<br />
and the Bombah Broadwater in the Myall <strong>Lakes</strong>.<br />
Ecological health does not refer to environmental<br />
health issues such as drinking water quality,<br />
safety for swimming, heavy metal contamination,<br />
disease, bacteria, viruses or our ability to harvest<br />
shellfish or fish.<br />
The Goal for our waterways is to maintain<br />
or improve their condition in order to<br />
protect biological diversity and maintain<br />
ecological processes<br />
Figure 3.1.1 Myall Lake looking south<br />
14 <strong>Great</strong> <strong>Lakes</strong> <strong>Council</strong> 2011 State of the Environment Report
Ecological health results presented in easy<br />
to understand Report Card<br />
The results of ecological health monitoring have<br />
been presented in a Catchment and Waterways<br />
Report Card which grades the health of the<br />
waterways in a similar way to school report cards<br />
with a grade ranging from A (excellent) to F (very<br />
poor). This Report Card documents how <strong>Great</strong><br />
<strong>Lakes</strong> <strong>Council</strong> is tracking towards their 2030 Vision<br />
and is included in Appendix 1.<br />
The information provided below includes<br />
the background details for the Report Card<br />
including the objectives, methods and a detailed<br />
description of the results.<br />
Environmental values<br />
The environmental values that management<br />
actions in the catchment are aiming to achieve<br />
are:<br />
1. Minimal algal growth<br />
2. Minimal sediment inputs and maximum<br />
clarity<br />
3. Intact aquatic habitats like seagrass,<br />
macrophyte and riparian vegetation<br />
Figure 3.1.2 Clear waters with<br />
minimal algal growth and maximum<br />
clarity support key habitats such as<br />
seagrass<br />
Report Card objectives<br />
The objectives for the Report Card are:<br />
1. To report on ecological health<br />
2. To track progress on management actions.<br />
These objectives are specifically achieved by:<br />
• Providing information to assist in the<br />
current and ongoing protection of “high<br />
conservation” areas that currently provide<br />
substantial water quality and biodiversity<br />
benefits to the rivers and estuaries.<br />
• Providing information to guide and report<br />
on the remediation of areas that have high<br />
pollutant loads and highlight areas that may<br />
require further action<br />
• Providing information to help protect all<br />
areas of Wallis, Smith and Myall <strong>Lakes</strong> against<br />
further declines in water quality.<br />
Water<br />
In addition to the ecological results, management<br />
actions being undertaken in the catchments<br />
are also presented in the Report Card. A more<br />
detailed description of the management actions<br />
is provided in this report. These management<br />
actions have been developed to target specific<br />
environmental values which <strong>Council</strong> and the<br />
community have determined as important to the<br />
region.<br />
<strong>Great</strong> <strong>Lakes</strong> <strong>Council</strong> 2011 State of the Environment Report 15
Methods<br />
Development of Report Card grades<br />
The monitoring program has assessed the<br />
ecological health of Wallis and Smiths Lake,<br />
Bombah Broadwater and Lower Myall Estuary,<br />
Tea Gardens. There are a number of steps taken<br />
to determinine the score for each zone and<br />
subsequent report card grade:<br />
1. Selecting the indicators<br />
2. Identifying the trigger levels<br />
3. Collecting the data<br />
4. Calculating the zone score<br />
5. Allocating the report card grade<br />
1. Selecting the indicators<br />
In order to meet the objectives of the Report<br />
Card, indicators must report on ecological health<br />
but also be able to report on the outcomes of<br />
management actions. The management actions<br />
are linked to the environmental values set for the<br />
region (listed above), and the indicators selected<br />
have been shown to be responsive to catchment<br />
management actions.<br />
Algal growth can be measured by assessing<br />
chlorophyll a levels in the water and sediment<br />
inputs assessed by measuring the turbidity (see<br />
side box). These indicators are easy to measure<br />
and directly relate to the environmental values.<br />
While the extent of seagrass beds, macrophytes<br />
and riparian vegetation are not currently<br />
measured, low chlorophyll and turbidity levels are<br />
necessary to ensure healthy habitats. Expansion<br />
of the program in the future is likely to include<br />
assessment of these habitats.<br />
There are many different estuary reporting<br />
programs world-wide, with indicators specifically<br />
chosen to suit local conditions or issues.<br />
Chlorophyll and turbidity are commonly used<br />
as they are proven to be very informative and<br />
responsive indicators Table 3.1.1.<br />
Table 3.1.1<br />
Indicators used in various estuarine monitoring programs<br />
Monitoring Program Chlorophyll a Turbidity<br />
South East Queensland<br />
Ecosystem Health<br />
Monitoring Program<br />
Dissolved<br />
Oxygen<br />
Nutrients<br />
Riparian<br />
vegetation<br />
Seagrass<br />
Other critical<br />
habitats<br />
(e.g coral)<br />
<br />
Chesapeake Bay<br />
EcoCheck program <br />
Northern Rivers CMA<br />
Ecohealth <br />
<strong>NSW</strong> Monitoring,<br />
Evaluation and<br />
Reporting Program *<br />
F F <br />
<strong>Great</strong> <strong>Lakes</strong> <strong>Council</strong><br />
Report Card (this program) F F F<br />
F - future<br />
* <strong>NSW</strong> Monitoring, Evaluation and Reporting Program also samples fish in a limited<br />
number of sites<br />
16 <strong>Great</strong> <strong>Lakes</strong> <strong>Council</strong> 2011 State of the Environment Report
The <strong>NSW</strong> Monitoring, Evaluation and Reporting<br />
Program, based on the findings of Scanes et<br />
al. (2007) concluded that measurement of<br />
Chlorophyll A and turbidity provides an effective<br />
measure of the short term response of estuary<br />
health to management actions. Seagrass<br />
and other macrophytes provide a long-term<br />
integration of estuary health.<br />
Dissolved oxygen has been widely used as an<br />
indicator of the amount of oxygen in the water<br />
column with many critical aquatic processes<br />
dependent on a healthy level and minimal<br />
variability. <strong>Great</strong> <strong>Lakes</strong> and <strong>NSW</strong> Monitoring,<br />
Evaluation and Reporting Program both<br />
acknowledge that dissolved oxygen is an<br />
important variable to measure but have not<br />
done so to date due to logistical reasons. There<br />
are plans to include this indicator in future<br />
monitoring activities.<br />
2. Identifying the trigger levels<br />
A healthy ecosystem refers to a system which<br />
has normal ranges of diversity and function.<br />
These ‘normal’ ranges have been established<br />
from extensive monitoring of estuaries across<br />
<strong>NSW</strong> as part of the <strong>NSW</strong> Monitoring, Evaluation<br />
and Reporting program. To establish these<br />
ranges, sites that represent a variety of ecological<br />
conditions from pristine (reference) sites to highly<br />
degraded have been sampled over a number of<br />
years. The data for pristine (reference) sites have<br />
been used to establish the trigger values which<br />
are fundamental for ranking the ecological health<br />
of a site.<br />
The National Water Quality Management Strategy<br />
(ANZECC 2003) suggests that the suitable method<br />
for deriving a trigger value is to determine the<br />
80th percentile value (i.e. the value that is met<br />
80% of the time) for an indicator at reference sites.<br />
A trigger value is the value which indicates that<br />
a variable is outside the “normal range” and could<br />
trigger further investigation. In our context, we<br />
have used the trigger value to indicate conditions<br />
which are not desirable for continued waterway<br />
health.<br />
Algae<br />
Algae or microscopic plants are always<br />
present in waterways but if conditions<br />
change and are suited to algal growth,<br />
blooms can occur. Blooms may occurr<br />
if there is a lot of nutrients in the water<br />
which can come from urban stormwater,<br />
fertiliser runoff from farms and gardens<br />
and seepage from septic tanks. Algal<br />
blooms can reduce the amount of light<br />
reaching seagrass beds limiting their<br />
growth. When blooms of algae die and<br />
start to decay, the resulting bacterial<br />
activity can reduce oxygen concentrations<br />
in the water column, possibly leading to<br />
fish kills. Chlorophyll is a good measure of<br />
the amount of algae in the water as all alga<br />
have chlorophyll in their cells giving them<br />
their green colour.<br />
Chlorophyll a<br />
Chlorophyll a is a pigment found in plants<br />
and is an essential molecule for the process<br />
of photosynthesis (the conversion of light<br />
energy to chemical energy resulting in<br />
the consumption of carbon dioxide and<br />
the production of oxygen and sugars).<br />
In estuarine and marine waterways,<br />
chlorophyll a is present in phytoplankton<br />
such as cyanobacteria, diatoms and<br />
dinoflagellates. Because chlorophyll a<br />
occurs in all phytoplankton it is commonly<br />
used as a measure of phytoplankton<br />
biomass. (EHMP 2008 )<br />
<strong>Great</strong> <strong>Lakes</strong> <strong>Council</strong> 2011 State of the Environment Report 17
Sediment<br />
Sediment from the land can be washed<br />
into waterways when it rains. If land is<br />
not properly managed with trees and<br />
groundcover, large amounts of sediment<br />
can wash into our waterways. Sediment<br />
also comes from roads and pathways<br />
washing directly into the stormwater and<br />
then the estuaries.<br />
Too much sediment in the water reduces<br />
the amount of light reaching the bottom<br />
and is detrimental to seagrass which<br />
require light for growth. Seagrass is<br />
critical for the health of estuaries as it<br />
provides essential habitat for fish and<br />
invertebrates which support bird life and<br />
subsequently influence the local tourism<br />
and aquaculture industries. Excess<br />
amounts of suspended particles can also<br />
smother benthic organisms like sponges<br />
and seagrass, irritate the gills of fish and<br />
transport contaminants. Turbidity provides<br />
a measure of sediment in the water.<br />
Turbidity<br />
Turbidity is the measure of light scattering<br />
by suspended particles in the water<br />
column, providing an indication of the<br />
amount of through the water column<br />
(EHMP 2008).<br />
A trigger value is specific to different types of<br />
estuary, in this study, Wallis Lake, Pipers Creek,<br />
Charlotte Bay, Smiths Lake, Bombah Broadwater<br />
were all classified as “<strong>Lakes</strong>” and Wallamba River<br />
and the Lower Myall River, Tea Gardens as a “River<br />
estuary” (Roper et al. 2011).<br />
Table 3.1.2 Trigger Values for <strong>NSW</strong> Estuaries (from Roper et al. 2011)<br />
Turbidity<br />
(NTU)<br />
Chlorophyll<br />
(µg/L)<br />
Lake 6.7 2.5<br />
River estuary (mid) 1.9 2.2<br />
3. Collecting the data<br />
The <strong>Great</strong> <strong>Lakes</strong> region has been divided up into<br />
eight reporting zones. A zone is actually a broad<br />
area within the estuary rather than a discrete<br />
point (see maps in Results Section) and may be<br />
represented by a single sample or by multiple<br />
samples. Four zones were sampled in Wallis Lake<br />
estuary (Wallamba River, Pipers Creek, Wallis Lake,<br />
Charlottes Bay). There is one zone in Smiths Lake<br />
, and one Zone in Myall <strong>Lakes</strong> at the Bombah<br />
Broadwater. There is one zone at Tea Gardens in<br />
the Lower Myall Estuary.<br />
Samples were collected on six occasions between<br />
summer and autumn from December to March.<br />
This represents the part of the year when the<br />
highest chlorophyll concentrations are expected.<br />
Figure 3.1.3 Office of Environment and Heritage staff carry out<br />
the monitoring of the waterways in the <strong>Great</strong> <strong>Lakes</strong> Region<br />
18 <strong>Great</strong> <strong>Lakes</strong> <strong>Council</strong> 2011 State of the Environment Report
At each of the selected sites, samples were<br />
taken in accordance with the <strong>NSW</strong> Monitoring,<br />
Evaluation and Reporting protocols which are<br />
described in full in Roper et al. (2011). At each<br />
of the “Lake” sites, turbidity was measured using<br />
a calibrated probe suspended at a depth of 0.5<br />
metres for 5 minutes as the boat drifted or was<br />
motored (generally covering a distance of at least<br />
300 metres), logging data every 15 seconds. The<br />
final value for the “site” sampled was the average<br />
of all the logged data. During the drift, at least<br />
five samples of the top 1m of the water column<br />
were collected and combined in a bucket. At<br />
the end of the drift, a single 200 millilitre sample<br />
for Chlorophyll a analysis was taken from the<br />
composite in the bucket.<br />
For the river estuary sites, an “underway sampler”<br />
is used to pass water past the probe whilst the<br />
boat travels at a regulated speed along a transect<br />
upstream from the middle to the upper part of<br />
the estuary. The turbidity is calculated as the<br />
mean of logged values for the transect. At two<br />
sites along the transect, composite water samples<br />
are collected for Chlorophyll a analysis.<br />
Chlorophyll a samples are immediately filtered<br />
(within one hour) under mild vacuum and<br />
the filter frozen until analysis. Chlorophyll a<br />
is extracted into acetone and Chlorophyll a<br />
concentration determine by spectrometry.<br />
4. Calculating the zone score<br />
The measured values of all indicators need to be<br />
summarised into one value which can then be<br />
compared between different reporting zones.<br />
Two basic calculations have been performed for<br />
each zone:<br />
• Non-compliance score – are the indicator<br />
values non-compliant with the trigger value?<br />
• Distance from the benchmark score – how<br />
far from the trigger value are the indicator<br />
values?<br />
Calculating the non-compliance score<br />
The non-compliance score was simply calculated<br />
by taking the number of samples that are above<br />
the trigger value as a proportion of the total<br />
number of samples taken in the sampling period.<br />
The non-compliance score is then expressed as<br />
a value between 0 and 1 with 0 equal to none of<br />
the values being non-compliant (i.e. all compliant)<br />
and 1 equal to all values being non-compliant.<br />
Non-compliance score = number of samples noncompliant<br />
with trigger value divided by the total<br />
number samples.<br />
Calculating the distance from benchmark score<br />
The distance score has been expressed as a<br />
proportion between 0 and 1 to be standardised<br />
with the non-compliance score. To do that the<br />
distance score is expressed as a proportion of<br />
the worst expected value (WEV) with a score of 0<br />
equal to the benchmark value and 1 equal to the<br />
worst expected value for each of the indicators<br />
The worst expected value has been determined<br />
by examination of a data set for all of <strong>NSW</strong>. The<br />
98th percentile value was selected as the worst<br />
expected value Table 3.1.3. In the small number (2<br />
%) of circumstances where measured values were<br />
greater than worst expected value, the distance<br />
measure became 1 (which is the highest possible<br />
value).<br />
Table 3.1.3 Worst expected value for Condition Calculations<br />
Turbidity WEV<br />
(NTU)<br />
Chlorophyll WEV<br />
(µg/L)<br />
Lake 20 30<br />
River (mid) 60 30<br />
Lagoon 20 30<br />
WEV = worst expected value<br />
The distance measure is a recognition that the<br />
trigger values only allow for two possible states,<br />
compliant and non-compliant. The distance<br />
measure provides for more sensitivity for<br />
ecological condition along the gradient from<br />
good to poor.<br />
<strong>Great</strong> <strong>Lakes</strong> <strong>Council</strong> 2011 State of the Environment Report 19
Distance of each non-compliant value =<br />
(measured value – trigger value) / (worst expected<br />
value – trigger value)<br />
The distance score is calculated as the mean<br />
distance from the trigger of those values that are<br />
non-compliant for the reporting period.<br />
Once the non-compliance and distance score<br />
have been calculated, the geometric mean of<br />
both scores is calculated to arrive at a single score<br />
that can be used to assess the condition of each<br />
indicator in that zone.<br />
Final Score<br />
for indicator<br />
= (non-compliance x distance score)<br />
The final “zone score” for each reporting zone is<br />
then the simple average of the indicator scores.<br />
Figure 3.1.4 Relationships between Grades, Zone scores and state<br />
percentiles<br />
% of state scores in each<br />
20% 30% 30% 15% 5%<br />
A B C D F<br />
0 0.07 0.27 0.44 0.60 1<br />
zone score<br />
5. Allocating the Report Card Grade<br />
Defining the report card grade is an important<br />
step in the development of the Report Card.<br />
The grade definitions below are linked to the<br />
environmental values outlined above and are<br />
structured to allow easy comparison between<br />
each system and over time. It is important<br />
that the cut-off values for each Grade reflect<br />
the condition of each Zone in comparison to<br />
a broader scale of condition across all <strong>NSW</strong><br />
estuaries. (i.e. an “Excellent” grade represents<br />
an excellent condition for a <strong>NSW</strong> estuary). To<br />
assist with the derivation of cut-offs, scores were<br />
calculated for 130 zones across a wide range of<br />
<strong>NSW</strong> estuaries using the same triggers and worst<br />
expected values as the <strong>Great</strong> <strong>Lakes</strong> analyses.<br />
Cut-offs were then defined as representing a<br />
percentage of the scores for the state Table 3.1.4.<br />
For example, a zone score less than 0.07 defined<br />
the 20% of best zone scores in the state and this<br />
became our “Excellent” Grade (see Table 4 for<br />
other cut-offs). We did not use a score of 0 as<br />
excellent because, as a consequence of how the<br />
trigger values are calculated, we expect that even<br />
pristine reference sites will exceed trigger values<br />
20% of the time. The definition of the grades and<br />
description are shown in Figure 3.1.4.<br />
Table 3.1.4<br />
Report Card results, definitions, descriptions and cut-off<br />
Grade Result Definition Description<br />
A Excellent All environmental values met (The indicators measured<br />
meet all of trigger values for almost all of the year)<br />
The best 20% of scores<br />
in the state<br />
B Good Most environmental values met (The indicators measured<br />
meet all of the trigger values for most of the year)<br />
Next 30 % of good<br />
scores<br />
C Fair Some of the environmental values met (The indicators measured Middle 30% of scores<br />
meet some of the trigger values for some of the year)<br />
D Poor Few of the environmental values met (The indicators measured<br />
meet few of the trigger values for some of the year)<br />
Next 15 % of poorer<br />
scores<br />
F Very Poor None of the environmental values met (The indicators measured<br />
meet none of the trigger values for almost all of the year)<br />
The worst 5 % of scores<br />
in the state<br />
20 <strong>Great</strong> <strong>Lakes</strong> <strong>Council</strong> 2011 State of the Environment Report
Summary of the process for calculating the<br />
zone score<br />
In summary, the process for calculating the zone<br />
involved:<br />
• Calculating the proportion of time that the<br />
measured values of the indicator are above<br />
the adopted guideline limits or Trigger<br />
Values<br />
• Calculating the distance/departure from<br />
the guidelines for that indicator - the extent<br />
the data extends past the trigger value and<br />
approaches the worst expected value (WEV).<br />
for that indicator.<br />
• Calculating the geometric mean of the noncompliance<br />
and distance scores to get a final<br />
score for that indicator for each zone<br />
• Averaging the scores for the two indicators at<br />
each sites – this gives the “Zone Score”<br />
• Grade the Zone based on the Zone Score as<br />
A, B, C, D, F<br />
Figure 3.1.5 Coomba Aquatic Wetland<br />
References<br />
ANZECC (2003) Australian and New Zealand<br />
guidelines for fresh and marine water quality.<br />
Volume 1, The guidelines / Australian and<br />
New Zealand Environment and Conservation<br />
<strong>Council</strong>, Agriculture and Resource Management<br />
<strong>Council</strong> of Australia and New Zealand.<br />
Roper T, Creese B, Scanes P, Stephens K, Williams<br />
R, Dela-Cruz J, Coade G, Coates B. (2011)<br />
Assessing the condition of estuaries and coastal<br />
lake ecosystems in <strong>NSW</strong>. Technical Report (19<br />
September 2011). <strong>NSW</strong> State of the Catchments.<br />
Scanes P, Coade G. Doherty M, Hill R (2007)<br />
Evaluation of the utility of water quality based<br />
indicators of estuarine lagoon condition in <strong>NSW</strong>,<br />
Australia. Estuarine, Coastal and Shelf Science.<br />
EHMP (2008). Ecosystem Health Monitoring<br />
Program 2006-07 Annual Technical Report.<br />
South East Queensland Healthy Waterways<br />
Partnership, Brisbane.<br />
Acknowledgements<br />
The methodology presented here was developed<br />
by the Office of Environment and Heritage,<br />
Scientific Services Section with input from Hodge<br />
Environmental and the International Water Centre.<br />
<strong>Great</strong> <strong>Lakes</strong> <strong>Council</strong> 2011 State of the Environment Report 21
Wallis Lake<br />
Catchment description<br />
The Wallis Lake catchment extends over 1400<br />
square kilometres and is shared between the<br />
<strong>Great</strong> <strong>Lakes</strong> <strong>Council</strong> LGA (65%) and the <strong>Great</strong>er<br />
Taree City <strong>Council</strong> LGA (35%). This catchment<br />
includes the region’s major urban centre of<br />
Forster-Tuncurry.<br />
Wallis Lake is one of the most significant<br />
producers of Sydney Rock Oysters in Australia and<br />
is also central to the local tourism industry, valued<br />
at over $120m per year. The lake is one of <strong>NSW</strong>’s<br />
top 3 producing estuarine fisheries and is utilised<br />
extensively for recreation including boating,<br />
fishing and swimming.<br />
The Wallis Lake catchment contains habitat for<br />
threatened and international migratory species<br />
and contains 20% of the seagrass beds of<br />
<strong>NSW</strong>, the State’s single largest concentration of<br />
seagrass.<br />
Figure 3.1.6 Wallis Lake Catchment<br />
22 <strong>Great</strong> <strong>Lakes</strong> <strong>Council</strong> 2011 State of the Environment Report
Management actions<br />
A number of key management activities occur<br />
across the Wallis Lake Catchment influencing<br />
the overall health of the estuary, these are<br />
summarised below.<br />
Sustainable Farming Program<br />
The <strong>Great</strong> <strong>Lakes</strong> Sustainable Farming Program is a<br />
collaborative project between <strong>Great</strong> <strong>Lakes</strong> <strong>Council</strong><br />
and Karuah <strong>Great</strong> <strong>Lakes</strong> Landcare. The program aims<br />
to facilitate sustainable, productive land use across<br />
the <strong>Great</strong> <strong>Lakes</strong> catchments. The objective is to<br />
involve rural land managers in action learning which<br />
involves using localised networking, participatory<br />
learning, on-farm trials and demonstrations sites<br />
to help empower land managers to develop locally<br />
adapted solutions for sustainable agriculture. The<br />
underlying goal of the program is ‘landholders<br />
learning from landholders’ as this creates true long<br />
term capacity building and community support.<br />
In both 2008 and 2010 the <strong>Council</strong>-Landcare<br />
partnership was successful in securing funding<br />
through ‘Caring for our Country’ to deliver the<br />
Sustainable Farming Program in the Wallis and Myall<br />
Catchments.<br />
A key element of the Sustainable Farming Program is<br />
the establishment of localised Sustainable Farming<br />
Groups. Since 2008, six (6) Sustainable Farming<br />
Groups have been established in the Wallis Lake<br />
Catchment, these being in the localities of Wallamba,<br />
Wang Wauk, Dyers Crossing, Topi Topi and Wootton,<br />
as well as a broader geographical group focusing<br />
on farm biodiversity. Since 2008 the groups have<br />
held a total of 43 meetings to discuss relevant topics<br />
such as soil health, farm dam water quality, sub-soil<br />
ploughing, electric fencing, and pasture species<br />
identification to name a few.<br />
In addition to the these localised Sustainable<br />
Farming Groups, the Sustainable Farming Program<br />
incorporates a number of professional workshops,<br />
practical hands on field days, on-farm trials and<br />
demonstration sites. Since 2008, there have been<br />
57 field days and workshops held, 31 on-farm trails<br />
established and five (5) Best Practice Farms initiated<br />
in the Wallis Catchment.<br />
Of this total, three (3) Sustainable Farming Groups,<br />
15 field day/workshops and the five (5) Best Practice<br />
Farms were accomplished in 2010/11.<br />
Protection from development and<br />
re-development<br />
<strong>Council</strong> have focussed on protecting all<br />
lakes in the Local <strong>Government</strong> Area through<br />
its application of water quality targets for<br />
development and re-development. These targets<br />
ensure that there is a neutral or beneficial effect<br />
on water quality which means nutrients are not<br />
allowed to increase above current levels . These<br />
targets are documented in a draft Development<br />
Control Plan which will apply right across the<br />
Wallis, Smiths and Myall <strong>Lakes</strong> Catchments.<br />
Rubbish removal<br />
During 2010 <strong>Great</strong> <strong>Lakes</strong> <strong>Council</strong> undertook a<br />
clean up project aimed at removing marine<br />
debris from 148km of the Wallis Lake foreshore<br />
and 68km of its island’s foreshores. The clean up<br />
was the first coordinated clean up of Wallis <strong>Lakes</strong><br />
foreshores on record.<br />
The clean up resulted in 100 volunteers removing<br />
7 tonnes of marine debris which consisted<br />
predominantly of plastic bottles, batteries, crab<br />
traps, car tyres, floats, cigarette lighters, bait bags,<br />
alcohol bottles/cans and foam boxes.<br />
<strong>Council</strong> is currently perusing additional funding<br />
when it becomes available in order to continue<br />
the removal of marine debris from foreshore areas<br />
within the <strong>Great</strong> <strong>Lakes</strong> in order to improve the<br />
ecological condition of our waterways and their<br />
foreshores.<br />
Key Catchment Management Statistics<br />
• Erosion control on 36ha of land<br />
• 792ha of wetlands protected and<br />
enhanced<br />
• 31.8km of stream bank protected<br />
• 341ha of native vegetation protected<br />
and enhanced<br />
• 240m of roadside stabilised to reduce<br />
erosion<br />
• 10 ha of infested water treated for<br />
aquatic weeds<br />
Wallis Lake<br />
<strong>Great</strong> <strong>Lakes</strong> <strong>Council</strong> 2011 State of the Environment Report 23
Mid Wallamba Estuary<br />
D<br />
2011<br />
chlorophyll<br />
poor<br />
turbidity<br />
poor<br />
D<br />
2007<br />
good<br />
good<br />
Ecological health remains poor<br />
Ecological health in the mid Wallamba Estuary<br />
has remained poor since previous sampling<br />
in 2007. Water quality is poor as indicated by<br />
high turbidity levels and excessive amounts of<br />
microalgae.<br />
The majority of sediment particles in the water<br />
are fine soils and clays that have washed from<br />
bare earth in areas where vegetation cover has<br />
been removed, from unsealed roads and from<br />
eroding or collapsing stream banks. The turbidity<br />
levels exceeded the trigger value in every<br />
sample collected and with many samples greatly<br />
exceeding the trigger value.<br />
Estuary description<br />
The Mid Wallamba Estuary sub catchment covers<br />
almost one third of the Wallis Lake catchment (550<br />
km²). The catchment is one of the most modified<br />
sub catchments in Wallis Lake. Agriculture is the<br />
dominant land use with a small urban centre<br />
at Nabiac. The Mid Wallamba Estuary faces<br />
additional localised pressures from the erosion<br />
and collapse of stream banks due to its popularity<br />
for water sports over the summer period.<br />
The water quality sampling occurs in the estuarine<br />
reaches of the river from Wallamba Island to<br />
Failford.<br />
Algal (chlorophyll) levels exceeded trigger<br />
values in 80% of samples collected and many<br />
exceedances were large. Unhealthy growth<br />
of small algae in the waters is stimulated by<br />
nutrients washed from urban areas and pastures,<br />
or from stock directly accessing waterways. If<br />
this continues, then algae may reach levels in the<br />
water which are detrimental to fish, humans and<br />
livestock.<br />
<strong>Great</strong> <strong>Lakes</strong> <strong>Council</strong> has initiated actions<br />
to control sediments and nutrients from<br />
the catchment as part of the Water Quality<br />
Improvement Plan, but a more targeted approach<br />
to this area may be warranted given the results.<br />
Figure 3.1.7 Mid Wallamba Estuary<br />
24 <strong>Great</strong> <strong>Lakes</strong> <strong>Council</strong> 2011 State of the Environment Report
Management Actions<br />
Protection and rehabilitation of key<br />
habitats<br />
Acquiring and conserving 503ha of wetlands<br />
at Darawakh, Minimbah and Lower Wallamba<br />
/ North Tuncurry to protect water quality and<br />
biodiversity<br />
Restored pre-disturbance hydrology to over 90%<br />
of the Darawakh Creek / Frogalla Swamp through<br />
the infilling or decommissioning of 22.2km of<br />
artificial drains and removal of 1.5km of artificial<br />
levees to remediate a significant acid sulfate<br />
floodplain wetland system.<br />
Figure 3.1.8 Acquiring and conserving 570ha of wetlands at<br />
Darawakh, Minimbah and Lower Wallamba / North Tuncurry to protect<br />
water quality and biodiversity.<br />
Bush rehabilitation<br />
Volunteers active in bush regeneration around<br />
Nabiac. 12 members of Nabiac Landcare meet<br />
weekly to tackle the weeds in a 6 hectare area<br />
of river flat sclerophyll forest at Bullock Wharf<br />
on the Wallamba River. The group have cleared<br />
vast areas of woody weeds such as lantana, small<br />
leaved privet and camphor laurel. Also present at<br />
the site are the more problematic madeira vine,<br />
asparagus fern and trad. The natural regeneration<br />
on this site is excellent but the group assists in<br />
some areas with planting of endemic species.<br />
Bank Stabilisation<br />
Stabilising 4.2km of the Wallamba River with rock<br />
protection, planting 8,000 native plants and bush<br />
regeneration to conserve 8.6km of streambank.<br />
Rock walls that allow establishment of mangroves<br />
have been constructed to reduce bank erosion.<br />
The Wallamba river is exposed to severe bank<br />
erosion due to past vegetation clearance, ongoing<br />
cattle grazing and wash from boats. Monitoring<br />
from <strong>Great</strong> <strong>Lakes</strong> <strong>Council</strong> has indicated an erosion<br />
rate of up to 1m per year along 12km of river.<br />
Sedimentation downstream is impacting on<br />
the health of the Wallis Lake oyster and fishing<br />
industry. Sedimentation directly affects oyster<br />
leases and turbidity reduces the depth at which<br />
seagrass will grow, thus reducing fish habitat.<br />
The Wallamba River Memorandum of<br />
Understanding brokered an innovative agreement<br />
to the management and remediation of these<br />
significant riverbank erosion issues affecting the<br />
banks of the lower Wallamba River. The MOU<br />
was amended in 2010 to address the increasing<br />
impact of wash from wake enhancing activities.<br />
The MOU amendments were negotiated with key<br />
stakeholders including caravan park businesses,<br />
landholders, waterway users and government<br />
agencies. Importantly the amendments provide a<br />
designated area for wakeboarding and other wake<br />
enhancing activities within Wallis Lake in an area<br />
on the western side of Wallis Island and maintains<br />
the exisiting ski zone within the Wallamba River.<br />
It enacted responsibilities on land management<br />
agencies and river users to adopt actions and<br />
protocols to care for and restore the riverbank<br />
landscape to maintain the health of the river<br />
and its responsibilities including management<br />
of the riparian zone, protection and restoration<br />
of the downstream estuary and consider and<br />
manage aquatic habitat. <strong>Great</strong> <strong>Lakes</strong> <strong>Council</strong>,<br />
with the support of other land management<br />
agencies, has been implementing activities that<br />
relate to riverbank protection and stabilisation<br />
and associated riparian enhancement. Outputs<br />
have included installation of several kilometres<br />
of riverbank armouring (rock fillets/revetment),<br />
enhancement and re-establishment of riparian<br />
vegetation and mangroves, and stock exclusion<br />
fencing.<br />
Wallis Lake<br />
subcatchments<br />
<strong>Great</strong> <strong>Lakes</strong> <strong>Council</strong> 2011 State of the Environment Report 25
Pipers Creek<br />
B<br />
2011<br />
chlorophyll<br />
poor<br />
turbidity<br />
poor<br />
B<br />
2007<br />
good<br />
good<br />
Algae still higher than desired<br />
Ecological health in Pipers Creek is strongly<br />
influenced by inputs from the large urban<br />
catchment. Nutrients from houses, lawns and<br />
pets, wash into the creek through stormwater and<br />
continue to stimulate algal growth to levels which<br />
are higher than desired for this type of waterway.<br />
The trigger value for chlorophyll is exceeded in<br />
almost half the samples collected, though the<br />
exceedences were not large.<br />
Water clarity is excellent with turbidity levels less<br />
than trigger values most of the time. There was<br />
a slight improvement in turbidity levels between<br />
2007 and 2011. Low turbidity levels are critical<br />
for the protection of important habitats such as<br />
seagrass beds which enhance the biodiversity<br />
of the system. This is a good result for Pipers<br />
Creek and shows that with the additional efforts<br />
being made to control nutrient run-off from<br />
the catchment, it may be possible for Pipers<br />
Creek to achieve excellent water quality in the<br />
future. Recent improvements made to water<br />
quality should not be lost as a consequence of<br />
future development of re-development in this<br />
catchment. there should therefore be a continued<br />
emphasis on achieving water quality targets for all<br />
development.<br />
Estuary description<br />
The majority of the Forster township is located<br />
in Pipers Creek Catchment. The rainfall that<br />
once infiltrated into the ground through native<br />
vegetation now meets impervious surfaces<br />
(roofs, roads and footpaths) and runs directly<br />
into stormwater drains and Pipers Creek. This<br />
stormwater runoff carries with it pollutants such<br />
as sediments and nutrients from houses, lawns<br />
and pets. In the past, Pipers Creek and Pipers Bay<br />
have experienced large algal blooms and shown<br />
signs of poor ecological health. Following large<br />
rainfall events, the water from Pipers Creek and<br />
Pipers Bay can reach Wallis Lake and Charlotte Bay<br />
areas. Reducing the impacts of stormwater from<br />
the Pipers Bay Catchment therefore has benefits<br />
across the whole of Wallis Lake.<br />
The samples for this report card are taken next to<br />
Big Island adjacent to Forster Keys.<br />
Figure 3.1.9 Pipers Bay with Pipers Creek on the right<br />
26 <strong>Great</strong> <strong>Lakes</strong> <strong>Council</strong> 2011 State of the Environment Report
Management Actions<br />
Water Sensitive Urban Design<br />
Over the past three years <strong>Great</strong> <strong>Lakes</strong> <strong>Council</strong><br />
have been building water quality gardens in the<br />
Pipers Creek Catchment to filter the sediments<br />
and nutrients out of the stormwater prior to<br />
flowing out into Wallis Lake. Five gardens have<br />
been built in the Palms estate drainage reserve<br />
treating 12.64 hectares of urban land between<br />
Kularoo Drive and the Southern Parkway. One<br />
of these gardens was constructed in 2011<br />
treating 4.22 ha of urban land in the Pipers Creek<br />
Catchment.<br />
The water quality gardens work by slowing down<br />
the stormwater so that large particles like soil<br />
drop out of suspension. The water then flows<br />
over a planted area and the microscopic alga<br />
(biofilms) which grow on the plant roots remove<br />
the nutrient nitrogen. The sandy loam soil that<br />
the plants grow in also acts as an additional filter<br />
removing other pollutants like heavy metals,<br />
petrochemicals and phosphorus. This cleaner<br />
water then flows into the stormwater drain prior<br />
to flowing into Wallis Lake.<br />
<strong>Council</strong> are currently in the process of identifying<br />
priority locations for future water quality gardens.<br />
Urban Engagement - Living Smart<br />
Between August-September 2011, <strong>Great</strong> <strong>Lakes</strong><br />
<strong>Council</strong> in cooperation with The Green ran one of<br />
the first 'Livingsmart' courses in regional <strong>NSW</strong>.<br />
This community engagement model focuses<br />
on grassroots interaction between community<br />
members, participatory action / learning<br />
principles and goal setting on a variety of different<br />
urban 'sustainability' issues. This broad brush<br />
approach addresses issues such as electricity and<br />
water use around the home, getting involved with<br />
your community, as well as chemical free cleaning<br />
and gardening among. Over 7 weeks, this handson<br />
course builds the capacity of attendees to<br />
address more specific sustainability concerns.<br />
The second half of this community-engagement<br />
project will take place late 2011 / early 2012 and<br />
address specific sustainability issues relevant to<br />
local residents, with a focus on improving local<br />
water quality.<br />
Figure 3.1.10 Four water quality gardens and one wetland<br />
built to treat 35 hectares of land in the Pipers and Muddy Creek<br />
Catchments<br />
Bush Rehabilitation<br />
Three volunteer bush regeneration groups<br />
currently exist in the Pipers Creek Catchment,<br />
working on a variety of vegetation types and<br />
weeds.<br />
At the southern end of Little Street, a single<br />
volunteer maintains a small (0.4ha) public reserve<br />
containing remnant floodplain rainforest that<br />
borders SEPP14 wetland (Saltmarsh) on Wallis<br />
Lake foreshore. The area was overrun with woody<br />
weeds, such as Lantana and Senna, but also<br />
contains vine weeds such as climbing asparagus<br />
and morning glory. Native vines are also present,<br />
and in this highly disturbed landscape, are overgrowing<br />
old growth rainforest trees. The site is<br />
problematic and has had years of neglect, but<br />
is starting to show signs of resilience. On-going<br />
support is needed to complete meaningful<br />
restoration of the site.<br />
The 10 volunteers actively working at the<br />
Community Gardens at Penenton Creek are mostly<br />
interested in growing their own food, but also<br />
take time to regenerate the banks of the creek<br />
adjacent to their gardens. Senna, camphor laurel<br />
and asparagus weeds are present, but also madiera<br />
vine. All of which require constant vigilance to<br />
control. Old growth remnant rainforest trees are<br />
scattered amongst mangroves and sclerophyll<br />
species along this urban creek, which is heavily<br />
impacted upon by urban pressures.<br />
The Sanctuary is a 6ha remnant of swamp<br />
sclerophyll forest adjacent to the Golf course<br />
in Forster. Two volunteers have maintained<br />
this area since 2005, in which time the area has<br />
been transformed from a degraded camphor<br />
laurel forest with weed understorey, to an active<br />
regeneration site full of native regrowth. Garden<br />
escapes (from green waste dumping) are now the<br />
main focus of works here.<br />
<strong>Great</strong> <strong>Lakes</strong> <strong>Council</strong> 2011 State of the Environment Report 27
Wallis Lake<br />
A<br />
2011<br />
chlorophyll<br />
poor<br />
turbidity<br />
poor<br />
A<br />
2007<br />
good<br />
good<br />
Wallis Lake remains in<br />
excellent condition<br />
Wallis Lake has long been recognised as having<br />
high environmental values due to its extensive<br />
seagrass beds: seagrass beds are important<br />
estuarine habitats that not only support<br />
biodiversity but provide essential ecosystem<br />
services such as nursery areas for aquatic bugs<br />
, fish and many other species.. Seagrass beds<br />
in turn, support a healthy community of larger<br />
animals such as turtles, large bodied fish, crabs,<br />
birds and dolphins. Healthy seagrass beds<br />
depend on good ecological health to survive..<br />
Estuary description<br />
Wallis Lake is in the centre of the estuary and<br />
receives runoff from a narrow catchment<br />
immediately surrounding the lake. Adjoining<br />
areas directly influencing Wallis Lake include<br />
Coomba Park, Green Point and the rural<br />
residential land on the western side of Wallis Lake.<br />
During large rainfall events, water from the major<br />
rivers and the Pipers Creek catchment flow into<br />
this area carrying pollutants with it.<br />
Sampling in Wallis Lake takes place in the centre<br />
of the estuary between Yahoo Island in the north<br />
and Earps Island in the south.<br />
In 2011 Wallis Lake remains in optimum ecological<br />
condition with all chlorophyll and turbidity<br />
samples below trigger values. The waters are very<br />
clear, allowing plenty of light to penetrate the<br />
water, which means that seagrasses can survive<br />
to greater depths and maintain a large area of<br />
coverage. There was almost no excess growth of<br />
algae recorded indicating that nutrient inputs are<br />
at sustainable levels.<br />
These results are an indication of the success<br />
of the Water Quality Improvement Plan and<br />
specifically the prevention of excessive nutrient<br />
inputs to the lake.<br />
Figure 3.1.11<br />
Wallis Lake<br />
28 <strong>Great</strong> <strong>Lakes</strong> <strong>Council</strong> 2011 State of the Environment Report
Management Actions<br />
Bush Rehabilitation<br />
Four volunteer groups are actively regenerating<br />
their local bushland reserves in the Wallis<br />
catchment.<br />
Green Point Coastcare has been meeting weekly<br />
since 1996 to reduce weeds along the foreshore<br />
of Wallis Lake. Their intial work involved clearing<br />
vast tracts of Lantana and Bitou Bush, now the<br />
remaining 4 members are tackling vine weeds,<br />
asparagus fern and invasive grasses. The group<br />
mainly focus on a 2 ha area that has Casuarinas<br />
fringing the lakes edge, with rainforest and<br />
Eucalypt canopy in some areas.<br />
Two volunteer groups are active at Coomba Park.<br />
One group, with 6 volunteers, works on a 3ha site<br />
at Coomba Aquatic Gardens. This area contains<br />
a sclerophyll forest on the headland point, which<br />
was heavily infested with Lantana when the group<br />
commenced in 1994. The bulk of the site contains<br />
Saltmarsh that is fringed with Mangroves on the<br />
<strong>Lakes</strong>' edge, and Palm Forest on the landward<br />
edge. While the woody weeds (lantana and<br />
Senna) are mostly under control, vine weeds<br />
(Passionfruit, morning glory) are proving more<br />
problematic in the Palm forest area.<br />
Figure 3.1.12<br />
56 volunteers active in bush regeneration at 9 sites<br />
Wallis Lake<br />
subcatchments<br />
The Coomba Foreshore group has 12 members<br />
who meet weekly to work in a long foreshore<br />
reserve that contains both Sclerophyll Forest and<br />
Saltmarsh. Woody weeds, such as Lantana and<br />
Senna have been systematically removed, and the<br />
group is now working on Asparagus Fern, vine<br />
weeds, including morning glory, madeira vine and<br />
passionfruit vines (two species). The group works<br />
in a 7ha area along Wallis Lake.<br />
A small group of locals at Wootton started<br />
working along creek banks of Carrington Creek in<br />
2009. Large tracts of privet (both large and smallleaved<br />
varieties), as well as moth vine and annual<br />
pasture weeds over-ran the area. With the help<br />
of contract bush regenerators, the group have<br />
systematically regenerated a small section of the<br />
creek, revitalising the native stands of watergum<br />
and Waterhousia. Four volunteers now maintain<br />
the regenerated area with regular working bees.<br />
<strong>Great</strong> <strong>Lakes</strong> <strong>Council</strong> 2011 State of the Environment Report 29
Charlotte Bay<br />
A<br />
2011<br />
chlorophyll<br />
poor<br />
turbidity<br />
poor<br />
A<br />
2007<br />
good<br />
good<br />
Charlotte Bay remains in<br />
excellent condition<br />
Charlotte Bay was identified in the Water Quality<br />
Improvement Plan as having high environmental<br />
values primarily due to its extensive seagrass<br />
and macrophyte beds, which support possibly<br />
the highest diversity of sponges and associated<br />
animals in <strong>NSW</strong> estuaries. Good water quality,<br />
particularly clear water, were identified as being<br />
important in protecting this unique ecosystem.<br />
The water quality results for Charlotte Bay have<br />
remained excellent, with no exceedences of<br />
trigger values for any samples in 2011. The waters<br />
are very clear, allowing plenty of light to reach the<br />
seagrasses and associated sponges.<br />
Estuary description<br />
Charlotte Bay covers the southern most part of<br />
the Wallis Lake estuary. There is limited mixing<br />
between the northern and southern parts of<br />
Wallis Lake, therefore the condition of this area is<br />
influenced mainly by the surrounding catchment.<br />
The catchment is largely vegetated with a small<br />
amount of residential, commercial and rural<br />
residential land.<br />
Sample collection in Charlotte Bay occurs in the<br />
middle of the water body south of Earps Island.<br />
There was almost no excess growth of algae<br />
recorded indicating that nutrient inputs to this<br />
part of the lake are within acceptable levels. Slight<br />
improvements in algae levels (chlorophyll a) were<br />
recorded between 2007 and 2011.<br />
These results justify <strong>Council</strong>s position in relation<br />
to development targets to prevent further<br />
nutrient inputs to the lake.<br />
Figure 3.1.13<br />
Charlotte Bay<br />
30 <strong>Great</strong> <strong>Lakes</strong> <strong>Council</strong> 2011 State of the Environment Report
Management Actions<br />
Bush Rehabilitation<br />
5 volunteers meet every other week at the<br />
wetland behind the Community Hall at Pacific<br />
Palms. The group commenced in 2009, with<br />
the help of an enthusiastic Green Corp team and<br />
professional bush regenerators, and have made<br />
big in-roads into the clearing of dense Senna,<br />
Lantana and Asparagus Fern on this site. Vine<br />
weeds, such as Passionfruit vine and morning<br />
glory are also present. The site contains a mixture<br />
of Saltmarsh species, old-growth mangroves and<br />
orchid-bearing Casuarinas; as well as dense stands<br />
of Cabbage-Tree Palms, Grey Gums and Swamp<br />
Mahoganies. Regeneration after preliminary<br />
clearing has been excellent, and the group are<br />
now working to reduce invasive grasses in the<br />
wetland.<br />
Figure 3.1.14<br />
Pacific Palms volunteers undertaking bush regeneration activities<br />
<strong>Great</strong> <strong>Lakes</strong> <strong>Council</strong> 2011 State of the Environment Report 31
Smiths Lake<br />
A2011<br />
chlorophyll<br />
poor<br />
turbidity<br />
poor<br />
good<br />
good<br />
Excellent result for Smiths Lake<br />
Smiths Lake is recognised for its high biodiversity<br />
values and approximately half of the lake is<br />
protected within a Marine Park Sanctuary Zone.<br />
The ecological health indicators for Smiths Lake<br />
are excellent, There were, however a number<br />
of instances when algal abundances exceeded<br />
trigger values (33% of samples), but only by a<br />
small amount.<br />
Smiths Lake requires careful catchment<br />
management to ensure the number and severity<br />
of exceedances of chlorophyll A trigger levels<br />
do not increase and lead to a degradation of<br />
ecological health.<br />
photo<br />
Estuary description<br />
Smiths Lake has a catchment area of 35.89km 2 .<br />
It is an intermittently closed and open coastal<br />
lagoon and the lake entrance is artificially<br />
opened when levels approach 2.1m above sea<br />
level to prevent flooding of low-lying areas. The<br />
catchment of Smiths Lake has good cover of<br />
native vegetation with a significant proportion<br />
of the catchment under conservation within the<br />
Wallingat and Myall <strong>Lakes</strong> National Parks. The<br />
Smiths Lake township and tourism facilities are<br />
situated near the lakes mouth, with impervious<br />
surfaces (roofs, roads and footpaths) increasing<br />
stormwater runoff into the lake. This stormwater<br />
runoff can carry with it pollutants such as<br />
sediments and nutrients from houses, lawns,<br />
unsealed roads and pets.<br />
Three sites were sampled in Smiths Lake, one<br />
in Wamwarra Bay West of Big Island, one to the<br />
East of Big Island and one in Symes Bay. These<br />
samples were combined to give an overall score<br />
for the health of the system.<br />
Figure 3.1.15<br />
Smiths Lake<br />
32 <strong>Great</strong> <strong>Lakes</strong> <strong>Council</strong> 2011 State of the Environment Report
Management actions<br />
Volunteers active in bush regeneration<br />
Smiths Lake foreshore group commenced in 2006<br />
to formalise foreshore accessways and rehabilitate<br />
the surrounding vegetation. The group has had<br />
up to 20 members, but active members currently<br />
number 4 people. The group works weekly to<br />
remove woody weeds, such as Lantana and Bitou<br />
Bush, but also various scramblers and vines, such<br />
as Ground Asparagus and Coastal Morning Glory.<br />
The group has also attracted Federal funding to<br />
retro-fit the toilet block at John Debert Reserve<br />
with water saving cisterns, taps and water tank.<br />
Stream and drainage Stabilisation<br />
Stabilising 289 meters of roadside to reduce<br />
erosion and subsequently the amount of<br />
sediment reaching the lake.<br />
In the Smiths Lake Catchment significant activity<br />
in the area of roadside erosion control has<br />
been undertaken over the past year. Amaroo<br />
Drive has had significant erosion control works<br />
including the rock lining of the roadside drains for<br />
approximately 200 meters. At Patsys Flat Road,<br />
erosion control has included installing curb and<br />
gutter along 109 meters of road.<br />
Figure 3.1.16<br />
4 volunteers active in bush regeneration at 1 site<br />
Protection from development and<br />
re-development<br />
<strong>Council</strong> have focussed on protecting all<br />
lakes in the Local <strong>Government</strong> Area through<br />
its application of water quality targets for<br />
development and re-development. These targets<br />
ensure that there is a neutral or beneficial effect<br />
on water quality which means nutrients are<br />
not allowed to increase above current levels for<br />
new greenfield developments. These targets are<br />
documented in a draft Development Control Plan<br />
which will apply right across the Wallis, Smiths<br />
and Myall <strong>Lakes</strong> Catchments.<br />
Figure 3.1.17 289 meters of roadside stabilised reducing the amount<br />
of sediment reaching the lake<br />
Smiths Lake<br />
<strong>Great</strong> <strong>Lakes</strong> <strong>Council</strong> 2011 State of the Environment Report 33
Myall <strong>Lakes</strong><br />
Catchment description<br />
The Myall <strong>Lakes</strong> Catchment covers 440 square<br />
kilometres. Its major tributary is the Myall River,<br />
whose headwaters extend to Craven Nature<br />
Revere and the Kyle Range. The catchment is<br />
largely occupied by agricultural land, with forestry<br />
and protected vegetation in the steeper areas and<br />
a small amount of urban land in the townships<br />
of Bulahdelah and the well-known tourist<br />
destinations of Tea Gardens-Hawks Nest.<br />
The Myall <strong>Lakes</strong> and Myall River in particular are<br />
part of a large tourism and recreation industry<br />
which includes Myall <strong>Lakes</strong> National Park, one of<br />
<strong>NSW</strong>’s most visited National Parks with estimated<br />
annual visitor numbers of 250,000.<br />
Major issues for the Myall <strong>Lakes</strong> system include<br />
the impacts of rural runoff on water quality<br />
including nutrients, noxious weeds and other<br />
pathogens. Urban runoff and the impacts from<br />
tourism and recreation uses of the lakes and<br />
estuaries are more prevalent in the lower reaches<br />
of the catchment.<br />
Figure 3.1.18<br />
Myall <strong>Lakes</strong> Catchment<br />
34 <strong>Great</strong> <strong>Lakes</strong> <strong>Council</strong> 2011 State of the Environment Report
Management actions<br />
Sustainable Farming Program<br />
The <strong>Great</strong> <strong>Lakes</strong> Sustainable Farming Program<br />
is a collaborative project between <strong>Great</strong> <strong>Lakes</strong><br />
<strong>Council</strong> and Karuah <strong>Great</strong> <strong>Lakes</strong> Landcare. The<br />
program aims to facilitate sustainable, productive<br />
land use across the <strong>Great</strong> <strong>Lakes</strong> catchments. The<br />
objective is to involve rural land managers in<br />
action learning which involves using localised<br />
networking, participatory learning, on-farm trials<br />
and demonstrations sites to help empower land<br />
managers to develop locally adapted solutions for<br />
sustainable agriculture. The underlying goal of the<br />
program is ‘landholders learning from landholders’<br />
as this creates true long term capacity building<br />
and community support.<br />
In both 2008 and 2010 the <strong>Council</strong>-Landcare<br />
partnership was successful in securing funding<br />
through ‘Caring for our Country’ to deliver the<br />
Sustainable Farming Program in the Wallis and<br />
Myall Catchments.<br />
A key element of the Sustainable Farming<br />
Program is the establishment of localised<br />
Sustainable Farming Groups. Since 2008, two<br />
(2) Sustainable Farming Groups have been<br />
established in the greater Myall Lake Catchment,<br />
once in the Crawford Catchment and in the Myall<br />
Catchment. Since 2008 the groups have held a<br />
total of 19 meetings to discuss relevant topics<br />
such as soil health, farm dam water quality,<br />
sub-soil ploughing, electric fencing, and pasture<br />
species identification to name a few.<br />
In addition to the these localised Sustainable<br />
Farming Groups, the Sustainable Farming<br />
Program incorporates a number of professional<br />
workshops, practical hands on field days, on-farm<br />
trials and demonstration sites. Since 2008, there<br />
have been 11 field days and workshops held,<br />
20 on-farm trails established and one (1) Best<br />
Practice Farm initiated in the Myall Catchment.<br />
Of this total, four (4) field day/workshops and the<br />
Best Practice Farm were accomplished in 2010/11.<br />
Figure 3.1.19 26 landholders participating in 2 Sustainable<br />
Farming Groups<br />
Protection from development and<br />
re-development<br />
<strong>Council</strong> have focussed on protecting all<br />
lakes in the Local <strong>Government</strong> Area through<br />
its application of water quality targets for<br />
development and re-development. These targets<br />
ensure that there is a neutral or beneficial effect<br />
on water quality which means nutrients are not<br />
allowed to increase above current levels . These<br />
targets are documented in a draft Development<br />
Control Plan which will apply right across the<br />
Wallis, Smiths and Myall <strong>Lakes</strong> Catchments.<br />
Key Catchment Management Statistics<br />
• Erosion control on 18ha of land<br />
• 396ha of wetlands protected and<br />
enhanced<br />
• 10km of stream bank protected<br />
• 203ha of native vegetation protected<br />
and enhanced<br />
• 138 ha of infested water treated for<br />
aquatic weeds<br />
Myall <strong>Lakes</strong><br />
<strong>Great</strong> <strong>Lakes</strong> <strong>Council</strong> 2011 State of the Environment Report 35
Bombah Broadwater<br />
B<br />
2011<br />
chlorophyll<br />
poor<br />
turbidity<br />
poor<br />
B<br />
2009<br />
good<br />
good<br />
Algal growth still a problem in<br />
Bombah Broadwater<br />
Excessive algal growth in Bombah Broadwater, as<br />
a consequence of nutrient inputs from the upper<br />
Myall River catchment, has been a concern in<br />
Bombah Broadwater for at least a decade. High<br />
levels of algae threaten the conservation values of<br />
the Broadwater and adjoining Myall River.<br />
Water clarity has remained excellent in the<br />
Broadwater.<br />
However, there is still evidence of excessive<br />
algal growth. In 2009 every sample exceeded<br />
chlorophyll trigger values, but in 2011 only 80%<br />
of samples exceeded trigger values and there<br />
was some indication that the magnitude of<br />
exceedance has also reduced since 2009. Further<br />
sampling is needed to determine if this decline<br />
represents an improving trend.<br />
The continuing high level of algal growth<br />
indicates that more needs to be done to control<br />
nutrient levels entering the Broadwater and Myall<br />
River.<br />
Estuary description<br />
The Bombah Broadwater is one part of the Myall<br />
<strong>Lakes</strong> system which is comprised of four linearly<br />
connected brackish to freshwater basins: Myall<br />
Lake, Two Mile Lake, Boolambayte Lake and the<br />
Bombah Broadwater. The Myall <strong>Lakes</strong> National<br />
Park surrounds the lakes and is listed as a Ramsar<br />
wetland of international importance.<br />
While the Bombah Broadwater itself is surrounded<br />
by National Park, it receives the majority of its<br />
inflow from the Upper Myall River and Crawford<br />
River catchments which together drain an area<br />
of approximately 440km 2 . These catchments are<br />
largely occupied by agricultural land with forestry<br />
and protected vegetation in the steeper areas and<br />
a small amount of urban land in the township of<br />
Bulahdelah.<br />
Three samples were taken from the Bombah<br />
Broad water and were combined to give an overall<br />
score for the health of the system.<br />
Figure 3.1.20<br />
Bombah Broadwater<br />
36 <strong>Great</strong> <strong>Lakes</strong> <strong>Council</strong> 2011 State of the Environment Report
Management Actions<br />
Erosion Control<br />
Between 2008 and present the <strong>NSW</strong> National<br />
Parks and Wildlife Service have undertaken a<br />
program of track rationalisation and rehabilitation<br />
to reduce erosion and sediment reaching the<br />
Myall <strong>Lakes</strong>. In total, 74km of trails and roads have<br />
been treated with 39km closed and rehabilitated<br />
and the remaining 35km have been improved<br />
with erosion and sediment controls.<br />
Sites for rehabilitation were identified based on<br />
the steepness, level of erosion and their location<br />
in the catchment. To rehabilitate the roads<br />
trails were re-shaped to match the contour of<br />
the land, where possible the natural drainage<br />
was reinstated and erosion and sediment<br />
controls were put in place to reduce sediment<br />
transport. Staff were trained in best practice<br />
erosion and sediment control to assist with future<br />
management of gravel roads.<br />
In the areas where the roads were closed, signs,<br />
gates and bollards were constructed, trees were<br />
left across the track and the surface of the land<br />
was roughened to promote vegetation growth.<br />
These areas have begun to re-vegetate naturally.<br />
Outside of the National Park, erosion hot spots on<br />
gravel roads in the Catchment have begun to be<br />
addressed. On Old Inn Road a concrete causeway<br />
was constructed across the Wild Cattle Creek<br />
along with sealing of the road on the approaches<br />
to the creek combined with geofabric and rock<br />
lining of the table drain significantly reducing<br />
sediment loads and turbity to the creek.<br />
Protection from development and<br />
re-development<br />
<strong>Council</strong> have focussed on protecting all<br />
lakes in the Local <strong>Government</strong> Area through<br />
its application of water quality targets for<br />
development and re-development. These targets<br />
ensure that there is a neutral or beneficial effect<br />
on water quality which means nutrients are not<br />
allowed to increase above current levels. These<br />
targets are documented in a draft Development<br />
Control Plan which will apply right across the<br />
Wallis, Smiths and Myall <strong>Lakes</strong> Catchments.<br />
Protection and rehabilitation of key habitats<br />
The Water Quality Improvement Plan recognised<br />
the critical role that wetland protection and<br />
restoration plays in the maintenance and<br />
improvement of water quality and aquatic<br />
health. Functional floodplain wetlands are<br />
particularly important in the stripping of nutrients<br />
and sediments from catchment run-off prior<br />
to entering receiving waterbodies. Given that<br />
algae concentrations remain an issue in the Myall<br />
<strong>Lakes</strong> system, it is important that Myall River<br />
Floodplain wetland systems are appropriately<br />
protected and managed. Consequently, in<br />
2011, <strong>Council</strong> with the support of the Hunter/<br />
Central Rivers Catchment Management Authority<br />
acquired a 366-hectare wetland system on the<br />
Bulahdelah Plain of the Myall River Floodplain.<br />
This wetland was in good ecological condition,<br />
but, whilst ever privately-owned, remained at risk<br />
from a change or intensification of production<br />
land use. The public acquisition of this wetland<br />
system will ensure that the important ecosystem<br />
services functions are protected and enhanced<br />
through conservation land management and<br />
restoration. The wetland also contains significant<br />
biodiversity values including populations of<br />
at least two threatened plants and stands of<br />
three endangered ecological communities.<br />
The biodiversity outcomes are ancillary and in<br />
addition to the preservation of the wetland for the<br />
ecosystem services provisions that it provides.<br />
Figure 3.1.21 Acquiring 376ha of wetlands in the Bulahdelah<br />
area to protect water quality and biodiversity.<br />
Myall <strong>Lakes</strong><br />
subcatchments<br />
<strong>Great</strong> <strong>Lakes</strong> <strong>Council</strong> 2011 State of the Environment Report 37
Lower Myall Estuary - Tea Gardens<br />
B2011<br />
chlorophyll<br />
poor<br />
turbidity<br />
poor<br />
good<br />
good<br />
Very good grade let down by<br />
algae abundance<br />
Over several years, community concerns have<br />
grown about the ecological condition of the lower<br />
Myall River Tea Gardens. A thorough assessment<br />
of ecological indicators was commissioned and<br />
showed the river to be in excellent condition.<br />
Water clarity was found to be well within desired<br />
levels, only exceeding trigger values on 15%<br />
of samples and only by a small amount. Algae<br />
abundances were higher than desired, exceeding<br />
trigger values on 33% of times sampled, but<br />
were, however, only small. It is quite possible that<br />
these exceedances relate more to algae that have<br />
flowed downstream from the Broadwater rather<br />
than to algal growth that has occurred at this site.<br />
Estuary description<br />
The Lower Myall Estuary near Tea Gardens is the<br />
mouth of the Lower Myall River and is situated in<br />
an area of highly mobile sand features. The river<br />
discharges into the moderately sheltered waters<br />
of Port Stephens but the river entrance is exposed<br />
to swell from the south-east coming through the<br />
entrance of the Port.<br />
The Lower Myall Estuary receives water from the<br />
urban area of Tea Gardens and Hawkes Nest and is<br />
strongly influenced by the waters of the Bombah<br />
Broadwater following rainfall.<br />
Samples for this site were taken from between the<br />
Singing Bridge and Corrie Island.<br />
Figure 3.1.22<br />
Lower Myall Estuary - Tea Gardens<br />
38 <strong>Great</strong> <strong>Lakes</strong> <strong>Council</strong> 2011 State of the Environment Report
Management Actions<br />
Protection and rehabilitation of key habitats<br />
<strong>Council</strong> is a strategic partner in a project to<br />
establish connected habitat corridors and<br />
preserve and restore native vegetation over<br />
degraded farmland at Durness Station, Tea<br />
Gardens. The Durness – Borland Landcare<br />
Corridor project involves the establishment of<br />
corridors of native vegetation linking the northern<br />
foreshores of Port Stephens with habitats in<br />
Nerong State Forest and Myall <strong>Lakes</strong> National<br />
Park. The corridors protect 20ha of existing native<br />
vegetation and revegetate 70ha of currently<br />
cleared land with over 55,000 native plants. The<br />
project is associated with the establishment of<br />
stock exclusion fencing and riparian restoration<br />
on the trunk and tributaries of Kore Kore Creek<br />
as well as the remediation of active gully<br />
and sheet erosion sites. This is expected to<br />
deliver significant water quality benefits to<br />
Kore Kore Creek and the lower Port Stephens<br />
estuary. The project is being delivered as part<br />
of a major re-development of the agricultural<br />
production system on Durness to ensure greater<br />
sustainability including the establishment of a<br />
rotational grazing system and farm-scale offstream<br />
watering network. The project site will be<br />
utilised for education and awareness activities.<br />
The Durness – Borland Landcare Corridor is<br />
being delivered by Landcare Australia and<br />
the landowner (Nepean Group) with funding<br />
provided by a bequest from the estate of the Late<br />
Raymond Borland. As a further contribution to<br />
this project, <strong>Council</strong> has acquired and conserved<br />
120ha of land to protect water quality and<br />
biodiversity in the Kore Kore Creek catchment.<br />
This land is a core conservation node and<br />
protects a landscape important for water quality<br />
protection. Beneficial, low-intensity uses, shall<br />
be developed in the Kore Kore Creek Bushland<br />
Reserve, including walking trails and signage to<br />
encourage stewardship and awareness.<br />
Figure 3.1.23 74km roads and trails closed or rehabilitated to<br />
reduce erosion and sedimentation in the Myall <strong>Lakes</strong> National Park<br />
Figure 3.1.24 Creating a major wildlife corridor at Durness<br />
protecting 90-ha of land and revegetating 70-ha with 50,000 native<br />
plants<br />
<strong>Great</strong> <strong>Lakes</strong> <strong>Council</strong> 2011 State of the Environment Report 39
Results<br />
A number of agencies and organisations have<br />
conducted water quality monitoring in this<br />
LGA during the reporting period. However<br />
this data is not currently available in a useable<br />
and manageable format. Subsequently such<br />
information will not be reported in SoE Reports<br />
until a coordinated approach to water quality<br />
monitoring is established and a means for data<br />
sharing and reporting has been developed. An<br />
overview of some of the monitoring programs<br />
conducted by agencies across the LGA has been<br />
presented below.<br />
Figure 3.1.25<br />
Lower Wallamba River<br />
Table 3.1.5<br />
Water quality monitoring programs conducted in the <strong>Great</strong> <strong>Lakes</strong> LGA<br />
<strong>Great</strong> <strong>Lakes</strong> <strong>Council</strong><br />
Program/Sites<br />
Parameters<br />
• Waterwatch – 12 Sites<br />
• Billabong, 180 Violet Hill Rd,<br />
Boolambayte<br />
• Ferny Creek, back paddock at “Narvik<br />
Pastoral”, Wooton<br />
• Forster Keys #1 - Rear of 12 King<br />
George Pde<br />
• Forster Keys #3 - Entrance to Dolphin<br />
Passage (tip of western shoreline)<br />
• Forster Keys #4 - Tip of Harbour Shores<br />
Jetty, 14/7 Kenrose Street<br />
• Khoribakh Creek, “Tanundale”,<br />
Krambach<br />
• Myall <strong>Lakes</strong>, Hearts Point<br />
campground, Neranie<br />
• Penenton Creek #3, Forster (Strand St<br />
–Townsend Wetland, upstream)<br />
• Penenton Creek #4, Forster (Strand<br />
St –<br />
• Townsend Wetland, downstream)<br />
• Pipers Creek, Elizabeth Reserve<br />
boatramp at end of Guy Ave, Forster<br />
Keys<br />
• Smiths Lake, John Debert Reserve<br />
below toilet block, Amaroo Drive<br />
• Wallamba River, near boat ramp at<br />
“River Side Park” Bradfords, Nabiac<br />
Temperature, total<br />
dissolved oxygen, total<br />
dissolved solids, turbidity,<br />
pH<br />
Monitoring<br />
frequency<br />
Testing is<br />
undertaken<br />
as often as<br />
volunteers<br />
are able to do<br />
so, (usually<br />
monthly)<br />
Purpose<br />
(aims and objectives)<br />
Community<br />
education through<br />
on-ground action<br />
to provide a<br />
general indication<br />
of the quality of<br />
waterways within<br />
the <strong>Great</strong> <strong>Lakes</strong><br />
MidCoast Water<br />
Program/Sites<br />
Parameters<br />
Monitoring<br />
frequency<br />
13 Sites in Wallis Lake FC, Temp, Density Dependant on<br />
Oyster Growing<br />
Season average<br />
30 runs/ year<br />
Purpose (aims and<br />
objectives)<br />
Oyster quality<br />
assurance/<br />
environment<br />
40 <strong>Great</strong> <strong>Lakes</strong> <strong>Council</strong> 2011 State of the Environment Report
Stormwater Monitoring Program<br />
• 9 sites in Tuncurry, 31 Sites in Forster,<br />
1 site in Green Point<br />
Frys Creek Environmental Monitoring<br />
Program<br />
• 3 sites Frys Creek Bulahdelah, 2 sites<br />
Myall River above Bulahdelah<br />
Karuah River Stroud 2 sites<br />
Program/Sites<br />
• 23 water sampling sites<br />
• 10 oyster meat sample sites<br />
Program/Sites<br />
2 zones in Wallis Lake, 1 in Pipers<br />
integrated sample zone<br />
FC Temp Bi-Monthly Oyster quality<br />
assurance/<br />
environmental<br />
DO, Salinity, Temp, pH,<br />
FC, Enterococci, BOD,<br />
Total P, Dissolved reactive<br />
Phosphorous, Nitrate,<br />
Nitrite, TKN, Ammonia,<br />
Total N, Oxidised<br />
Nitrogen, Suspended<br />
Solids, Chlorophyll a,<br />
Turbidity, Oil and Grease,<br />
Conductivity<br />
DO, Salinity, temp, pH, FC,<br />
Total P, Dissolved Reactive<br />
P, TKN, Ammonia, Total N,<br />
Oxidised N, Suspended<br />
Solids, Chlorophyll a,<br />
Turbidity, Conductivity<br />
Quarterly<br />
Quarterly<br />
<strong>NSW</strong> Shellfish Quality Assurance Program<br />
Monitoring<br />
Parameters<br />
frequency<br />
• Algae & faecal coliforms<br />
from water sample<br />
• E. Coli samples of oyster<br />
meat<br />
Fortnightly<br />
and following<br />
rainfall events<br />
Office of Environment and Heritage<br />
Monitoring<br />
Parameters<br />
frequency<br />
Chlorophyll - a, Turbidity September -<br />
Jan, 5 times,<br />
2 weekly<br />
intervals<br />
Sewerage<br />
treatment<br />
plant licensing<br />
agreement/<br />
environmental<br />
Environmental<br />
Purpose (aims and<br />
objectives)<br />
Oyster quality<br />
assurance for<br />
human health<br />
Purpose (aims and<br />
objectives)<br />
MER Strategy<br />
Community Water Quality Monitoring- Waterwatch<br />
<strong>Great</strong> <strong>Lakes</strong> <strong>Council</strong> and the Catchment Management Authority facilitate a number of volunteer<br />
community and school groups who monitor water quality in local waterways using the Waterwatch<br />
techniques (Go to ww.waterwatch.org.au for more info).<br />
A summary for each Waterwatch testing site that is tested regularly (i.e. every couple of months or<br />
more) is provided below. Some indication of water quality in these areas is given by outlining how<br />
often the tests show typical or desired levels of water quality and how often the tests show the site<br />
to be out of healthy range for that indicator. For example healthy waterways have a pH or acidity<br />
level of between 6 and 8 units. If a test showed the pH to be 9 this would be out of the healthy range.<br />
Site<br />
Ferny Creek,back paddock at “Narvik<br />
Pastoral”, Wooton<br />
Myall <strong>Lakes</strong>, Hearts Point<br />
campground, Neranie<br />
No. of<br />
tests<br />
% time Dissolved<br />
oxygen fair or good<br />
% time pH<br />
fair or good<br />
% time turbidity<br />
fair or good<br />
2 0 50 100<br />
2 n/a 100 100<br />
<strong>Great</strong> <strong>Lakes</strong> <strong>Council</strong> 2011 State of the Environment Report 41
Current response and future<br />
directions<br />
<strong>Council</strong> recognises the enormous environmental,<br />
economic and social value that good water<br />
quality has for our local area. Thus, a number of<br />
important projects have been developed and are<br />
being implemented to help protect and improve<br />
water quality in the <strong>Great</strong> <strong>Lakes</strong>. These projects<br />
and initiatives include:<br />
• Water Quality Improvement Plan - Wallis,<br />
Smiths and Myall <strong>Lakes</strong><br />
• The Healthy <strong>Lakes</strong> Program (a community<br />
education program helping business,<br />
residents and tourists reduce their impact on<br />
stormwater and water quality)<br />
• Constructed Wetlands and Gross Pollutant<br />
Traps (to reduce stormwater pollution)<br />
• Installation of WSUD devices - biofiltration<br />
systems<br />
• DA Assessment and Strategic Planning (to<br />
reduce the impact of development on water<br />
quality)<br />
• Darawakh and Frogalla Wetland Management<br />
plan and associated actions to reduce the<br />
effects of Acid Sulfate Soils<br />
• Wallis Lake Catchment Management Plan and<br />
Wallis Lake Estuary Management Plan<br />
• Smiths Lake Estuary Management Plan<br />
• Port Stephens/ Myall <strong>Lakes</strong> Estuary<br />
Management Plan<br />
Figure 3.1.26 Landholders participating in a ‘Weed control<br />
without herbicides workshop’<br />
Table 3.1.6<br />
Identified needs for action regarding water quality<br />
Identified Need for Action<br />
Continue to implement and<br />
expand programs aimed at<br />
improving water quality e.g.<br />
Water Quality Improvement<br />
Plan, Wallis Lake Catchment<br />
Management, Healthy <strong>Lakes</strong><br />
Program, Water Quality<br />
Partnership etc.<br />
Review Stormwater<br />
Management Plans<br />
Continue to implement a<br />
water quality monitoring<br />
program across the LGA<br />
Review existing monitoring<br />
programs<br />
Recommended key projects<br />
or actions for consideration in<br />
next year’s Management Plan<br />
• Water Quality<br />
Improvement Plan<br />
(implementation)<br />
• Wallis Lake Catchment<br />
Management (progress<br />
implementation),<br />
• Healthy <strong>Lakes</strong> Program<br />
(continue and expand<br />
initiatives)<br />
• Improved Stormwater<br />
Management (review and<br />
update plans)<br />
• Implement water quality<br />
monitoring as detailed<br />
in the Water Quality<br />
Improvement Plan<br />
• Ecological Health<br />
Assessment<br />
• Implement water quality<br />
monitoring as detailed<br />
in the Water Quality<br />
Improvement Plan<br />
• Align water quality<br />
monitoring sites and time<br />
with the <strong>NSW</strong> Shellfish<br />
Quality Assurance Program<br />
Relevant <strong>Council</strong><br />
section<br />
Natural<br />
Systems<br />
Natural<br />
Systems<br />
Natural<br />
Systems<br />
Natural<br />
Systems<br />
Are there<br />
existing<br />
resources for<br />
action<br />
Y<br />
Partial<br />
Partial<br />
Commence<br />
by/timeframe<br />
Ongoing<br />
Immediate<br />
Ongoing<br />
Partial Within 2<br />
years<br />
42 <strong>Great</strong> <strong>Lakes</strong> <strong>Council</strong> 2011 State of the Environment Report
3.2 Water Usage<br />
Introduction<br />
Water usage and supply has become a<br />
contentious issue throughout Australia in<br />
light of global climate change, recurring and<br />
worsening drought situations and the increasing<br />
demand for domestic, agricultural and industrial<br />
water. To meet the ongoing future water<br />
requirements of residents, industry, agriculture<br />
and the environment it is essential that this<br />
natural resource be managed sustainably and<br />
appropriately. Water conservation is both a<br />
human resource issue, but also an environmental<br />
issue, as adequate flows in streams, floodplains<br />
and wetlands is critical for general environmental<br />
health.<br />
Potentially the over-exploitation of water<br />
resources can have a significant effect on the local<br />
environment, depriving rivers, lakes and estuaries<br />
of natural water flows essential to their function<br />
and inherent quality. As such, monitoring water<br />
usage provides an indication of the pressure on<br />
the local environment. Within the <strong>Great</strong> <strong>Lakes</strong>,<br />
this information is available from the local water<br />
authority, MidCoast Water, who is responsible<br />
for managing water resources and infrastructure<br />
throughout the wider region.<br />
The <strong>Great</strong> <strong>Lakes</strong> relies on a number of different<br />
water sources. The major towns, including<br />
Forster/ Tuncurry, Nabiac and Pacific Palms,<br />
receive water from Bootawa Dam (off-river<br />
storage of the Manning River), which is located<br />
in the <strong>Great</strong>er Taree City <strong>Council</strong> LGA. Hawks<br />
Nest/Tea Gardens draws its water supply from<br />
bore fields to the north of Tea Gardens on the<br />
Myall <strong>Lakes</strong>/ Viney Creek sand beds. The Stroud<br />
water supply is drawn from the Karuah River and<br />
Bulahdelah draws its water from the Crawford<br />
River. To secure future water supplies and meet<br />
predicted demand, the Nabiac borefield is under<br />
construction with all bores in place to supplement<br />
the Bootawa Dam supply from the Minimbah<br />
aquifer. The construction of the water treatment<br />
plant and the connection to the water supply is<br />
yet to start.<br />
Monitoring<br />
For this indicator, the total volume of water<br />
used and a breakdown of usage for residential,<br />
commercial, industrial, institutional and public<br />
use purposes provide information on the pressure<br />
placed on the local environment and attributes<br />
water demand to different sectors. This data<br />
is accessible from the local water authority,<br />
MidCoast Water, as water meters record the<br />
information for all properties connected to<br />
reticulated water systems.<br />
Results<br />
For the reporting period a total of 17,359<br />
properties were connected to the water supply<br />
system within the <strong>Great</strong> <strong>Lakes</strong> area with 113 new<br />
connections during this period. The total volume<br />
of water consumed during this period was 3431<br />
million litres, slightly higher than last year but<br />
still at a reduced level. A breakdown of water<br />
consumed by each sector of the community has<br />
been provided in Table 3.2.1.<br />
Table 3.2.1<br />
Number of existing and new water connections<br />
2009-10 2010-11<br />
Total number of properties 17246 17359<br />
connected to water supply<br />
system:<br />
New connections 100 113<br />
Source: MidCoast Water<br />
Table 3.2.2<br />
Volume of water consumed by each community sector<br />
Consumption category<br />
Volume<br />
million litres<br />
(ML)<br />
Volume<br />
million litres<br />
(ML)<br />
Residential 2344 2368<br />
Commercial 664 695<br />
Industrial 288 267<br />
Institutional 65 62<br />
Public Use 51 39<br />
Total 3412 3431<br />
Source: MidCoast Water<br />
<strong>Great</strong> <strong>Lakes</strong> <strong>Council</strong> 2011 State of the Environment Report 43
As mentioned above there has been wide<br />
promotion of the Water Wise program (including<br />
Whizzy the Water Drop), rebate programs and<br />
price incentives. Additionally, all new houses need<br />
to comply with the BASIX system to incorporate<br />
water sensitive design.<br />
Current response and future<br />
direction<br />
MidCoast Water is the responsible agency for<br />
ensuring effective and sustainable water use.<br />
Currently, MidCoast Water (MCW) is undertaking<br />
a number of projects to secure the provision<br />
of future water supply of the <strong>Great</strong> <strong>Lakes</strong> LGA.<br />
Updates against these projects are provided on<br />
the following table.<br />
Figure 3.2.1 Whizzy<br />
the Water Drop helps<br />
to spread the word on<br />
water conservation<br />
Nabiac Borefield Ecological Survey Groundwater Dependant Ecosystems<br />
MidCoast Water is working towards a diversified water supply, by developing a borefield supply to<br />
supplement the Manning Water Supply Scheme (the supply for 90% of MidCoast Water customers). This<br />
will help protect environmental flows in the Manning River, but can be expected to have an environmental<br />
impact on the Nabiac Aquifer. MidCoast Water’s ecological study into the effects of groundwater extraction<br />
on dependant ecosystems is ongoing, and is designed to allow for future management to minimise the<br />
impacts of water extraction.<br />
Recycling Scheme Developments<br />
MidCoast Water has a number of planned effluent reuse schemes currently in the detail design phase. There<br />
are planned recycling schemes which will see the use of highly treated effluent for irrigation of golf courses<br />
and some public grounds. Schemes are planned for Forster, Tuncurry, Bulahdelah and Hawks Nest. These<br />
reuse schemes will reduce the amount of treated effluent released into waterways, and will reduce demand<br />
on potable water supplies. The schemes are planned for completion in 2012-13.<br />
WaterWise Rebate Scheme<br />
MidCoast Water’s rebate scheme is in its third year. Customers of MidCoast Water are able to access up<br />
to $1500 in a cash rebate scheme to help make their homes water smart. The Rebate Program allows<br />
customers in homes built before BASIX to access some assistance to refit things such as water efficient<br />
household appliances and rainwater tanks.<br />
The program provides incentives to install water efficient appliances, which will have an effect in reducing<br />
overall water consumption, and therefore reduce the amount of water MidCoast extracts from and returns<br />
to the environment.<br />
Water efficient devices covered by the program include water efficient showerheads, dual flush toilets,<br />
dishwashers and washing machines. Connecting a rainwater tank for use in the garden, toilet or laundry (or<br />
all three) also attracts a rebate under the system.<br />
Smart Meter Program<br />
A pilot program is underway to introduce electronic “smart meters” to residential properties in the area.<br />
The smart meters record when and where water is used in a home, providing information to householders<br />
which can be used to help identify ways for MidCoast water customers to reduce their overall water<br />
consumption, thereby reducing the need for MidCoast Water to extract water from the environment. The<br />
project was extended to include commercial customers.<br />
Source: MidCoast Water<br />
44 <strong>Great</strong> <strong>Lakes</strong> <strong>Council</strong> 2011 State of the Environment Report
3.3 Fish Kills<br />
Introduction<br />
The term “fish kill” applies to the localised and<br />
specific death of a number of fish or associated<br />
marine or aquatic species, such as prawns and<br />
crabs. Fish kills may occur in marine, estuarine<br />
and inland waters and usually take place in a<br />
defined area over a defined period of time. Fish<br />
kills are typically (but not always) a result of<br />
human activities and especially actions that lead<br />
to declining environmental conditions such as<br />
low dissolved oxygen levels, pH stress, changes in<br />
water temperature and toxic pollution. False fish<br />
kills may result from throwbacks of dead fish from<br />
commercial fishing vessels.<br />
Although currently not a common event<br />
within the <strong>Great</strong> <strong>Lakes</strong>, there is the potential<br />
for fish kill events to become more prevalent as<br />
development impacts increase. Unless these<br />
impacts are managed appropriately the regions<br />
fish stocks may be seriously depleted. Fish kills<br />
tend to be indiscriminate and can remove whole<br />
populations or specific recruitment/ breeding<br />
classes.<br />
Monitoring<br />
<strong>Council</strong>’s Environmental Health section maintains<br />
records on fish kill events within the LGA. When<br />
a fish kill occurs, <strong>Council</strong> Officers or appropriate<br />
agency staff (Industry and Investment <strong>NSW</strong>-<br />
Fisheries) conduct an investigation and record<br />
detail of the location, extent, species affected<br />
and possible cause(s). <strong>Council</strong> also completes<br />
an investigation report, which is forwarded to<br />
the Department of Primary Industries (Fisheries).<br />
Hence, there is often relatively detailed<br />
information on the number and extent of fish<br />
kills, including the number of individuals, affected<br />
species, location and extent. The Industry and<br />
Investment <strong>NSW</strong> (Fisheries) office located at<br />
Huskisson also maintains records, which are<br />
sourced for the purpose of SoE reporting.<br />
Table 3.3.1<br />
Year<br />
Number of fish kill events<br />
No. of fish kill events<br />
2009/10 Nil Reported<br />
2010/11 1<br />
Source: <strong>Great</strong> <strong>Lakes</strong> <strong>Council</strong> & Industry and Investment<br />
<strong>NSW</strong> (Fisheries)<br />
Summary<br />
One fish kill incident was recorded by I&I<br />
(Fisheries) within this reporting period on the 14<br />
February 2011. The kill occurred on the Wallamba<br />
River and it was estimated that between 100 and<br />
1000 fish had been killed.<br />
<strong>Great</strong> <strong>Lakes</strong> <strong>Council</strong> 2011 State of the Environment Report 45
3.4 Stormwater Pollution<br />
Response and future directions<br />
Education has been identified as an essential<br />
tool in reducing the quantity of stormwater<br />
pollution. Subsequently, <strong>Council</strong> has developed<br />
an education and awareness program to target<br />
stormwater pollution. Developed in 2001, the<br />
Healthy <strong>Lakes</strong> Program has been successful<br />
in raising awareness and educating the local<br />
community on a number of water quality issues.<br />
However, education needs to be ongoing in order<br />
to be effective. It also needs to lead to actual<br />
behavioural change and positive actions.<br />
The tenets of the Healthy <strong>Lakes</strong> program have<br />
continued to be addressed through more recent<br />
programs such as the Environmental Trust funded<br />
Urban Sustainability project and Steps towards<br />
Sustainable Tourism projects.<br />
It is also recommended that regular cleaning of<br />
GPT’s should occur across the LGA.<br />
Table 3.4.1<br />
Identified needs for action regarding stormwater pollution<br />
Identified Need for Action<br />
Develop pollutant trap and litter<br />
basket cleaning, monitoring,<br />
performance assessment and<br />
reporting procedures<br />
Develop a constructed wetland<br />
cleaning and reporting procedure<br />
and allocate funding to improving<br />
the efficiency of one constructed<br />
wetland each year<br />
Expansion of Healthy <strong>Lakes</strong><br />
Program into appropriate<br />
partnering programs in order to<br />
continue meeting targets.<br />
Recommended key<br />
projects or actions for<br />
consideration in next<br />
year’s Management Plan<br />
• Improve performance<br />
and management of<br />
stormwater treatment<br />
devices<br />
• Review and Improve<br />
cleanout reporting<br />
procedures<br />
• Improve performance<br />
and management of<br />
stormwater treatment<br />
devices<br />
• Implement<br />
Sustainable business<br />
program including<br />
steps to sustainable<br />
tourism.<br />
Relevant <strong>Council</strong><br />
section<br />
Natural<br />
Systems,<br />
Engineering<br />
Services<br />
Natural<br />
Systems,<br />
Engineering<br />
Services<br />
Natural<br />
Systems<br />
Are there<br />
existing<br />
resources for<br />
action<br />
Y<br />
Y<br />
Y<br />
Commence<br />
by/timeframe<br />
Within 2yrs<br />
Immediate<br />
Ongoing<br />
46 <strong>Great</strong> <strong>Lakes</strong> <strong>Council</strong> 2011 State of the Environment Report
3.5 Fish Passage Barriers<br />
Introduction<br />
A fish passage barrier is an obstacle that prevents<br />
fish from moving either upstream or downstream<br />
and can include structures such as dams, weirs,<br />
floodgates, roads, bridges, causeways and<br />
culverts. The natural behaviour of most native fish<br />
species requires the ability to move at least some<br />
distance and when restricted by the presence of a<br />
barrier these migrations are restricted or curtailed.<br />
Barriers can have the following effect on native<br />
fish species:<br />
• restrict migration of fish for spawning;<br />
• reduce dispersal of juvenile fish;<br />
• create isolated populations and reduce gene<br />
flow between fish populations;<br />
• limit passage of fish between feeding<br />
grounds;<br />
• cause fish to congregate at a barrier leaving<br />
them open to over-fishing, disease or<br />
predators;<br />
• create unsuitable living or breeding<br />
conditions (leading to fish kills);<br />
• cause the extinction of upstream or<br />
downstream migrating species; and<br />
• Alter species diversity because of the local<br />
disappearance of some species and changes<br />
to the abundance of remaining species.<br />
Monitoring<br />
Under the Fisheries Management Act 1994,<br />
proposals that obstruct the free passage of fish;<br />
or require construction or modification of a dam,<br />
weir or floodgate; must be referred to Industry<br />
and Investment <strong>NSW</strong> (Fisheries) for comment to<br />
determine whether a fishway is required. Further,<br />
Industry and Investment <strong>NSW</strong> (Fisheries) Port<br />
Stephens Research Centre maintains a record on<br />
the number, type, location and extent of some of<br />
the fish passage barriers within the LGA. However,<br />
this database is not comprehensive. There is no<br />
detailed catalogue of the type, nature, location<br />
and significance of fish barriers throughout<br />
the <strong>Great</strong> <strong>Lakes</strong> LGA. Recently, Industry and<br />
Investment <strong>NSW</strong> has produced a report to the<br />
<strong>NSW</strong> Environmental Trust titled “Reducing the<br />
impact of road crossings on aquatic habitat in<br />
coastal waterways- Hunter/Central Rivers, <strong>NSW</strong>”.<br />
In this report a number of additional causeway<br />
barriers have been identified in our LGA and these<br />
have been included in the results for this indicator.<br />
There is increasing knowledge on the means to<br />
modify existing barriers to reduce their impact.<br />
For example, modifications of openings, crest<br />
levels and the installation of Fish ways/ ladders<br />
have been utilised successfully. Fishways can<br />
provide essential passage through or around<br />
barriers, reduce the energy of water flow and<br />
decrease stress to fish. Fishways can range from<br />
simple rockramps on small weirs to powerful lifts<br />
and locks on large dams. Industry and Investment<br />
<strong>NSW</strong> -Fisheries can provide information on<br />
options for building fishways. Further, some<br />
structures that act as barriers are no longer<br />
operational or are obsolete. Depending on<br />
associated environmental issues, barriers such<br />
structures should be removed.<br />
Figure 3.5.1 Modifications to the Stroud Water Supply Weir to allow<br />
fish movement. Source: Industry and Investment <strong>NSW</strong> (Fisheries)<br />
<strong>Great</strong> <strong>Lakes</strong> <strong>Council</strong> 2011 State of the Environment Report 47
Results<br />
23 fish passage barriers have been identified to<br />
date within the <strong>Great</strong> <strong>Lakes</strong> LGA. These are listed<br />
below.<br />
Table 3.5.1<br />
Location<br />
Fish passage barriers<br />
Structure Name<br />
Type of<br />
Structure<br />
Bundacree Creek Farm Dam By/Wash<br />
Dam<br />
Bundageree Creek Unnamed dam (Nabiac) Fixed crest<br />
dam/weir<br />
Bangalow Creek Bangalow Road Causeway<br />
Cromarty Creek Private Road off Lemon Causeway<br />
Grove Road<br />
Booral Creek Conger Road Causeway<br />
Booral Creek Blue Gum Road Causeway<br />
Karuah River Cherry Tree Road Causeway<br />
Telegherry River Moores Creek Road Causeway<br />
Sugarloaf Creek Private road off Causeway<br />
unnamed road off The<br />
Bucketts Way<br />
Mammy Johnson Tereel Road<br />
Causeway<br />
River<br />
Telegherry River Middle Road Causeway<br />
Coolongolook River Locketts Crossing Road Causeway<br />
Curreeki Creek Private Road off Causeway<br />
Curreeki Road<br />
Curreeki Creek Private Road off Causeway<br />
Curreeki Road<br />
Curreeki Creek Curreeki Creek Road Causeway<br />
Curreeki Creek Curreeki Creek Road Causeway<br />
Curreeki Creek Curreeki Creek Road Causeway<br />
Curreeki Creek Curreeki Creek Road Causeway<br />
Wang Wauk River Smedleys Cutting Road Causeway<br />
Lawless Creek Cherry Tree Road Ford<br />
Penenton Creek Macintosh St Forster Floodgate<br />
Source: Industry and Investment <strong>NSW</strong> (Fisheries <strong>NSW</strong>), GLC<br />
The Lockets Crossing Road causeway<br />
was remediated during the last reporting<br />
period.<br />
The fish passage barriers identified in<br />
Table 3.6.1 are unlikely to be the only<br />
structures of this nature within the <strong>Great</strong><br />
<strong>Lakes</strong> LGA. There are likely to be other<br />
barriers to fish passage, particularly<br />
located on private land.<br />
Summary and response<br />
Over time it is hoped that progress on<br />
removing fish passage obstructions can<br />
be achieved in a prioritised and strategic<br />
manner. The work currently being done by<br />
Fisheries /Industry and Investment <strong>NSW</strong><br />
will greatly assist in this undertaking as<br />
resources for this area is very limited.<br />
The significant barriers identified in Table<br />
3.6.1 will continue to impact natural<br />
processes unless they are redesigned to<br />
allow for fish passage and the restoration<br />
of natural flows. Environmentally it<br />
would be ideal to remove all barriers<br />
however this poses a number of social<br />
and economic concerns as some of these<br />
barriers facilitate access, irrigation weir<br />
pools or domestic water supply. As such,<br />
the environmental, economic and social<br />
cost of management actions needs to be<br />
inherently considered.<br />
Table 3.5.2<br />
Identified needs for action regarding fish passage barriers<br />
Identified Need for Action<br />
Extensive ground truthing to<br />
comprehensively identify fish<br />
passage barriers with in the<br />
<strong>Great</strong> <strong>Lakes</strong> LGA<br />
Strategic removal/<br />
remediation of obstructions<br />
identified, in association with<br />
relevant authorities (Industry<br />
and Investment <strong>NSW</strong>, CMA).<br />
Recommended key projects<br />
or actions for consideration in<br />
next year’s Management Plan<br />
Work with other agencies<br />
to remediate Fish Passage<br />
Barriers<br />
Work with other agencies<br />
to remediate Fish Passage<br />
Barriers<br />
Relevant <strong>Council</strong><br />
section<br />
Natural<br />
Systems<br />
Natural<br />
Systems<br />
Are there<br />
existing<br />
resources for<br />
action<br />
Y<br />
Y<br />
Commence<br />
by/timeframe<br />
Within 2yrs<br />
Within 5yrs<br />
48 <strong>Great</strong> <strong>Lakes</strong> <strong>Council</strong> 2011 State of the Environment Report
4 Biodiversity<br />
The <strong>Great</strong> <strong>Lakes</strong> supports a variety of unique<br />
landscapes and vegetation communities as well<br />
as a diversity of plants and animals. The local<br />
economy relies heavily on tourism and primary<br />
production, which depend upon a healthy<br />
and functioning environment. Therefore, the<br />
conservation of the regions’ biodiversity is critical.<br />
It is increasingly recognised that the natural<br />
environment performs essential biological<br />
and ecosystem services such as water quality<br />
protection. However, human impacts are placing<br />
an increased pressure on the variety of species<br />
present and the integrity of habitats within the<br />
LGA. Land development and clearing particularly<br />
are significant threats to our native plants and<br />
animals. Unless these impacts are managed<br />
appropriately the extent of biodiversity currently<br />
present in the region will decrease. Ultimately<br />
this will impact on the economy, the wellbeing<br />
of residents as well as the regions’ aesthetics and<br />
general appeal.<br />
Figure 4.1 Biodiversity refers to the variety of species,<br />
individuals and landscapes in an area<br />
4.1 Native vegetation<br />
Introduction<br />
The extent and integrity of natural vegetation<br />
is, along with water quality, the most important<br />
environmental indicator for the <strong>Great</strong> <strong>Lakes</strong><br />
LGA. Adequate native vegetation representation<br />
across the LGA is associated with significant<br />
direct and indirect environmental benefits, along<br />
with a range of socio-economic opportunities<br />
and values. Conversely, the degradation<br />
of native vegetation beyond appropriate<br />
thresholds is known to result in significant<br />
declines in biodiversity, water quality, land<br />
quality (eg. salinity, rising watertables, erosion),<br />
and subsequently affect land productivity and<br />
critical social and economic resources. It has<br />
been demonstrated that vegetation decline can<br />
impinge seriously on attributes of the landscape<br />
that underpin the sustainability and viability of<br />
the entire <strong>Great</strong> <strong>Lakes</strong> area and permanently alter<br />
the values that the community regard as being<br />
important. Land clearing also worsens the carbon<br />
balance and contributes to global warming.<br />
Monitoring<br />
No comprehensive, detailed accurate and<br />
appropriately-scaled account of the vegetation of<br />
the entire <strong>Great</strong> <strong>Lakes</strong> LGA has been collated. In<br />
2003, mapping of vegetation communities was<br />
produced by <strong>Council</strong> for the eastern half of the<br />
LGA, but this mapping has been subsequently<br />
determined to be of limited scale and accuracy<br />
to assist local-scale, on-ground decision-making.<br />
Consequently, it is a priority to undertake<br />
vegetation community description and mapping<br />
across the LGA and processes and methods are<br />
being implemented in this regard.<br />
With regards to vegetation change, no agency has<br />
collated a base map of vegetation of the LGA and<br />
no agency routinely monitors rates of vegetation<br />
change in a meaningful manner. However,<br />
these are both critically important to strategic,<br />
proactive and integrated natural resource<br />
management and biodiversity conservation.<br />
<strong>Council</strong> intends to address this deficiency through<br />
a defined vegetation monitoring protocol to be<br />
implemented as part of subsequent SoE reporting<br />
processes.<br />
Biodiversity<br />
<strong>Great</strong> <strong>Lakes</strong> <strong>Council</strong> 2011 State of the Environment Report 49
A secondary component of this indicator requires<br />
that <strong>Council</strong> monitor and report on approved<br />
native vegetation clearing operations within the<br />
LGA. This includes native vegetation cleared<br />
under approval through the Hunter Central<br />
Rivers Catchment Management Authority under<br />
the Native Vegetation Act 2003, clearing under<br />
approval through the DECCW or clearing by<br />
<strong>Council</strong> under the Environmental Planning and<br />
Assessment Act 1979. This indicator also includes<br />
vegetation (both native and exotic) cleared and<br />
replaced through <strong>Council</strong>’s Tree Preservation<br />
Order.<br />
Finally, the issue of unauthorised clearing is also<br />
considered and reported on. This is restricted<br />
to an analysis of the number of breaches<br />
investigated by Department of Environment,<br />
Climate Change and Water.<br />
Results<br />
Until a formal protocol for local vegetation<br />
mapping and monitoring is developed, data from<br />
Hunter REMS regional mapping project is all that<br />
will be provided as an overall indicator of the<br />
extent of vegetation in the LGA.<br />
Table 4.1.1<br />
Extent of vegetation across <strong>Great</strong> <strong>Lakes</strong> LGA<br />
LGA LGA area (ha) Veg (ha) % Veg<br />
<strong>Great</strong> <strong>Lakes</strong> 337414 243929 72.29<br />
Source: Hunter REMS 2006<br />
Information has been sourced from the<br />
Catchment Management Authority regarding<br />
clearing approved under the Native Vegetation<br />
Act 2003 within the <strong>Great</strong> <strong>Lakes</strong> LGA for the<br />
SoE reporting period. This information was<br />
provided by the Department of Natural Resources<br />
previously, but this department has since been<br />
dissolved.<br />
Table 4.1.2 Clearing of Native Vegetation Consents by DNR/ CMA<br />
and DECCW<br />
Clearing Type 09/10 (ha) 10/11 (ha)<br />
Clearing 0 0<br />
Silvicultural/ Selective No data No data<br />
Logging/ Private Native<br />
Forestry<br />
totaL 0 0<br />
The number of trees removed and replaced<br />
through <strong>Council</strong>’s Tree Preservation Order is as<br />
follows:<br />
Figure 4.1.1 Important vegetation - a healthy and functioning<br />
riparian zone on the Cureeki Creek, Coolongolook<br />
Table 4.1.3 Trees removed and replaced through TPO and Greening<br />
Strategy process<br />
09/10 10/11<br />
Number trees removed 507 488<br />
Number native 210 159<br />
Number trees refused<br />
298 310<br />
removal<br />
Number planted as offset 770 605<br />
Source: <strong>Great</strong> <strong>Lakes</strong> <strong>Council</strong><br />
In relation to clearing associated with<br />
developments approved by <strong>Great</strong> <strong>Lakes</strong> <strong>Council</strong>,<br />
some 35.32 hectares of native vegetation was<br />
cleared during the reporting period, as shown<br />
by the table below. 47.61 hectares of native<br />
vegetation has been cleared since the first<br />
reporting period 09/10.<br />
50 <strong>Great</strong> <strong>Lakes</strong> <strong>Council</strong> 2011 State of the Environment Report
Table 4.1.4<br />
Clearing of Native Vegetation associated with DA Referrals<br />
Clearing of Native Vegetation<br />
associated with DA Referrals<br />
09/10<br />
(ha)<br />
10/11<br />
(ha)<br />
Littoral Rainforest* 0 0<br />
Cabbage Palm Forest 0 0<br />
Riparian Forest* 0 0<br />
Swamp Mahogany Swamp Forest 0 1.42<br />
Swamp Mahogany/ Paperbark<br />
0 0<br />
Swamp Forest*<br />
Broad-leaved Paperbark Swamp 0 0<br />
Forest*<br />
Swamp Oak Swamp Forest* 0 0<br />
Swamp Oak/ Paperbark Swamp 0 0<br />
Forest*<br />
Blackbutt Grassy Open Forest 0 0<br />
Blackbutt Coastal Sands Open 0.55 11.64<br />
Forest<br />
Blackbutt/ Broad-leaved<br />
0 0<br />
Paperbark Forest<br />
Blackbutt/ Tallowwood Grassy 0.57 0.20<br />
Open Forest<br />
Tallowwood Moist Open Forest 0 0.06<br />
Tallowwood/ Grey Gum Dry<br />
0.10 0.12<br />
Open Forest<br />
Flooded Gum or Flooded Gum/ 0.30 0<br />
Tallowwood Moist Forest<br />
Grey Gum Dry Open Forest 0 0<br />
Red Mahogany/ Broad-leaved<br />
0 0<br />
Paperbark Swamp Forest*<br />
Stringybark Open Forest 0 0<br />
Spotted Gum Open Forest/<br />
0.10 0.20<br />
Woodland<br />
Spotted Gum/ Ironbark/ White 7.96 4.86<br />
Mahogany/ Grey Gum Open<br />
Forest<br />
Ironbark or Ironbark/ Forest Red 0 0.18<br />
Gum/ Spotted Gum Forest<br />
Forest Red Gum Forest 0.06 1.30<br />
Cabbage Gum/ Rough-barked<br />
0 0<br />
Apple Open Woodland*<br />
Smooth-barked Apple Open<br />
0 0<br />
Woodland<br />
Smooth-barked Apple/ Sydney 1.68 0.15<br />
Peppermint/ Bloodwood Dry<br />
Open Forest<br />
Banksia 0 0<br />
Scribbly Gum Open Forest 0.05 0<br />
Red Bloodwood Open Woodland 0 8.00<br />
Heathland 0 0<br />
Disturbed Shrubland 0.68 7.19<br />
Coastal Grassy Headland* 0 0<br />
Sand Ridge/ Dune 0 0<br />
Mixed Open Forest/ Woodland 0.24 0<br />
Type<br />
totaL 12.29 35.320<br />
* Possible Endangered Ecological Community on the<br />
Threatened Species Conservation Act<br />
Source: <strong>Great</strong> <strong>Lakes</strong> <strong>Council</strong><br />
Table 4.1.5 Numbers of Native Trees Cleared from DA Referrals<br />
in urban Hawks Nest/ Tea Gardens (of significance due to the<br />
endangered Koala population)<br />
Numbers of Native Trees Cleared<br />
from DA Referrals in Hawks Nest/ Tea<br />
Gardens (of significance due to the<br />
endangered Koala population) 09/10 10/11<br />
Blackbutt 0 0<br />
Red Mahogany 0 0<br />
Smooth-barked Apple 0 0<br />
Red Bloodwood 0 0<br />
Swamp Mahogany* 2 0<br />
Bangalay* 0 0<br />
Flooded Gum* 3 0<br />
Spotted Gum 0 0<br />
Broad-leaved Paperbark 0 0<br />
Native trees – unspecified 9 1<br />
totaL 14 1<br />
* Preferred local Koala food tree species<br />
Source: <strong>Great</strong> <strong>Lakes</strong> <strong>Council</strong><br />
Illegal or unauthorised clearing remains a key<br />
issue for <strong>Council</strong> and pertinent State authorities.<br />
No Data has been received from DECCW<br />
concerning investigation or prosecutions for<br />
illegal clearing activities.<br />
Figure 4.1.2 The clearing and fragmentation of vegetation for<br />
development in Hawks Nest and Tea Gardens is the greatest threat<br />
to the local endangered koalas<br />
<strong>Great</strong> <strong>Lakes</strong> <strong>Council</strong> 2011 State of the Environment Report 51
Response and future directions<br />
As stated in the previous comprehensive SoE, it<br />
remains fundamental that <strong>Council</strong>, within its areas<br />
of influence, adequately manages, conserves<br />
and where required restores native vegetation<br />
and protects the landscape from any significant<br />
depletion of native vegetation representation<br />
across the LGA. <strong>Council</strong> must also recognise that<br />
in some localities and community types, native<br />
vegetation restoration is clearly very important.<br />
As such, <strong>Council</strong> should recognise and seek to<br />
achieve the directives of the Native Vegetation Act<br />
2003, which include:<br />
• Ending broad scale clearing unless it<br />
improves or maintains environmental values<br />
• Protecting high conservation value<br />
vegetation<br />
• Restoring and rehabilitating native<br />
vegetation<br />
<strong>Great</strong> <strong>Lakes</strong> <strong>Council</strong> currently restores and<br />
replants native vegetation in association with<br />
Landcare, Coastcare, landholders, in Parks and<br />
Reserves and through street-scaping. It is hoped<br />
that these efforts can be reported in future SoE<br />
reports as an indication of <strong>Council</strong>’s response<br />
to pressures on Native Vegetation. Additionally,<br />
there is a need to develop policy to ensure that<br />
these restoration efforts are made equal to or in<br />
excess of the vegetation lost through the TPO and<br />
DA consent processes so that we see a net gain in<br />
Native Vegetation across the LGA rather than an<br />
ongoing or cumulative net loss.<br />
The issue of native vegetation representation and<br />
extent in the <strong>Great</strong> <strong>Lakes</strong> LGA is one of the most<br />
fundamental and important indicators. However,<br />
the usefulness and accuracy of data is limited by<br />
several key and fundamental actions. These are a<br />
high priority for <strong>Council</strong> to address, and comprise:<br />
• Mapping of the vegetation across full<br />
extent of the LGA such that a single picture<br />
of vegetation is accurately compiled in<br />
accordance with valid classification schemes<br />
and methods; and<br />
• Development of resources and a protocol for<br />
monitoring vegetation change via analysis of<br />
imagery for each comprehensive SoE report.<br />
Following collation of the baseline data of<br />
vegetation across the entire LGA, the Natural<br />
Systems and Estuaries Branch shall develop,<br />
exhibit, adopt and implement a Vegetation<br />
Strategy.<br />
It is currently proposed that for every<br />
Comprehensive SoE (once every four years),<br />
<strong>Council</strong> shall obtain updated aerial photography<br />
or appropriate resolution satellite images for the<br />
entire LGA. This imagery shall be analysed both<br />
remotely and visually to identify where loss and<br />
changes to natural vegetation type, structure or<br />
extent have occurred. Ground-truthing would<br />
also be required. The vegetation mapping shall<br />
be updated on the basis of this investigation<br />
and a concise report shall describe the changes<br />
to vegetation type and extent over the fouryear<br />
assessment period. This information is<br />
critical in that it represents an LGA-wide analysis<br />
of cumulative change and may allow the<br />
identification of vegetation communities and<br />
localities suffering from the greatest clearing<br />
pressures.<br />
The data generated would be useful for strategic<br />
and development assessment planning and<br />
contribute to conservation planning. It should<br />
be used to amend and adopt refined priorities<br />
through <strong>Council</strong>’s Biodiversity Conservation<br />
Framework.<br />
Figure 4.1.3 Coast Care volunteer planting native trees<br />
52 <strong>Great</strong> <strong>Lakes</strong> <strong>Council</strong> 2011 State of the Environment Report
Table 4.1.6<br />
Identified needs for action regarding vegetation<br />
Identified Need for Action<br />
Complete vegetation<br />
mapping and description for<br />
the <strong>Great</strong> <strong>Lakes</strong> LGA<br />
Develop a monitoring<br />
protocol and implement the<br />
monitoring of vegetation<br />
changes through satellite or<br />
aerial imagery and ground<br />
truthing<br />
Prepare and adopt a<br />
Biodiversity Conservation<br />
Strategy and Framework<br />
Develop and expand<br />
biodiversity education<br />
initiatives and activities<br />
Devise and implement an<br />
effective DA assessment<br />
protocol that includes<br />
adequate conditions of<br />
consent, flora and fauna<br />
survey guidelines and<br />
development design<br />
Create a Landscaping Code<br />
that reflects proposed<br />
outcomes of <strong>Council</strong>’s<br />
Greening Strategy<br />
Implement an LGA wide<br />
program of acquiring high<br />
resolution Satellite Imagery<br />
on a four yearly basis<br />
Recommended key projects<br />
or actions for consideration in<br />
next year’s Management Plan<br />
Vegetation Strategy (refine,<br />
update and implement)<br />
Develop a Vegetation<br />
Monitoring Protocol<br />
Biodiversity Conservation<br />
Framework (develop and<br />
adopt)<br />
Biodiversity education<br />
(develop and expand<br />
initiatives)<br />
Develop a policy/<br />
direction for Development<br />
Assessment advice<br />
Develop Landscaping Code<br />
Relevant <strong>Council</strong><br />
section<br />
Natural<br />
Systems<br />
Natural<br />
Systems<br />
Natural<br />
Systems<br />
Natural<br />
Systems<br />
Natural<br />
Systems<br />
Parks and<br />
Recreation<br />
Are there<br />
existing<br />
resources for<br />
action<br />
Partial<br />
Partial<br />
Partial<br />
Partial<br />
Partial<br />
Partial<br />
Commence<br />
by/timeframe<br />
Ongoing<br />
Within 2yrs<br />
Within 2yrs<br />
Ongoing<br />
Ongoing<br />
Immediate<br />
Acquire Satellite Imagery <strong>Council</strong> wide Partial Within 2yrs<br />
<strong>Great</strong> <strong>Lakes</strong> <strong>Council</strong> 2011 State of the Environment Report 53
4.2 Conserved Land<br />
Introduction<br />
Public and formal private conservation provides<br />
for the protection of biodiversity, the recovery<br />
of threatened species, the protection of scenic<br />
amenity, as well as a range of social, recreational,<br />
economic and educational/ scientific outcomes.<br />
<strong>Council</strong>, amongst other relevant agencies, is<br />
required to strive towards the achievement of<br />
a comprehensive, adequate and representative<br />
reserve system, under the <strong>NSW</strong> Biodiversity<br />
Strategy and the Australian Natural Heritage<br />
Charter.<br />
In this regard, there is a need to monitor the<br />
extent, and guide with local knowledge,<br />
the strategic additions of land to the public<br />
conservation estate as well as privately conserved<br />
lands.<br />
Monitoring<br />
<strong>Great</strong> <strong>Lakes</strong> <strong>Council</strong> shall collate and maintain<br />
a map of conserved land throughout the LGA<br />
and differentiate between the conservation<br />
mechanisms that apply to such lands.<br />
Furthermore, <strong>Council</strong> shall review the additions<br />
of land to conservation during each reporting<br />
period. Such information shall contribute to<br />
strategic and targeted biodiversity conservation<br />
frameworks.<br />
There is a range of levels and security associated<br />
with the varying conservation instruments. This<br />
includes (at the most secure level), the public<br />
conservation estate (National Park, Nature<br />
Reserves, State Conservation Areas) and binding<br />
private land conservation instruments that<br />
are on-title and operate in perpetuity (VCA,<br />
Registered Property Agreement, Conservation<br />
Trust Agreement). At the lowest level of security,<br />
there are non-binding conservation agreements<br />
that apply to private landholdings. However,<br />
these can be altered or withdrawn at any time and<br />
provide no real security. As such, non-binding<br />
conservation is not considered in the overall<br />
summary of conserved lands.<br />
Results<br />
Table 4.2.1 Conserved Land in the <strong>Great</strong> <strong>Lakes</strong> LGA. Land<br />
Conserved in the Public Conservation Estate (ha)<br />
Land Conserved in the Public<br />
Conservation Estate (hectares)<br />
09/10<br />
(ha)<br />
10/11<br />
(ha)<br />
National Parks (7) 66,499 66,499<br />
Myall <strong>Lakes</strong> National Park 48,183 48,183<br />
Wallingat National Park 6,544 6,544<br />
Ghin-Doo-Ee National Park 4,809 4,809<br />
Barrington Tops National 2,693 2,693<br />
Park (part)<br />
Karuah National Park 2,691 2,691<br />
Booti Booti National Park 1,536 1,536<br />
Gir-um-bit National Park 43 43<br />
Nature Reserves (16) 4,894 5,529<br />
Karuah Nature Reserve 2,743 2,743<br />
Darawank Nature Reserve 776 1,200<br />
Coolongolook Nature<br />
202 202<br />
Reserve<br />
Corrie Island Nature Reserve 164 164<br />
Minimbah Nature Reserve 130 341<br />
Smiths Lake Nature Reserve 24 24<br />
Seal Rocks Nature Reserve 2 2<br />
Bull Island Nature Reserve 1 1<br />
Monkerai Nature Reserve 1 1<br />
Wallis Island Nature Reserve 586 586<br />
Regatta Island Nature<br />
111 111<br />
Reserve<br />
Mills Island Nature Reserve 58 58<br />
Yahoo Island Nature Reserve 51 51<br />
Bandicoot Island Nature<br />
29 29<br />
Reserve<br />
Flat Island Nature Reserve 9 9<br />
Durands Island Nature<br />
7 7<br />
Reserve<br />
State Conservation Areas (3) 713 713<br />
Black Bulga State<br />
516 516<br />
Conservation Area<br />
Karuah State Conservation 71 71<br />
Area<br />
Bulahdelah State<br />
126 126<br />
Conservation Area<br />
<strong>Council</strong> owned and managed<br />
Open Space- natural areas 516 516<br />
Land Acquired for Conservation<br />
(not gazetted) 773 52<br />
TOTAL 73,395 73,309<br />
Source: OEH/ <strong>Great</strong> <strong>Lakes</strong> <strong>Council</strong><br />
Table 4.2.2<br />
Land Conserved in Binding Private Land Covenants<br />
54 <strong>Great</strong> <strong>Lakes</strong> <strong>Council</strong> 2011 State of the Environment Report
Land Conserved in Binding<br />
Private Land Covenants<br />
(Hectares)<br />
09/10<br />
(ha)<br />
10/11<br />
(ha)<br />
DEC Voluntary Conservation 39 98<br />
Agreements (VCA) (1)<br />
PVP Clearing Offset Area or No data No data<br />
Incentive Area<br />
CMA/ DIPNR Registered<br />
496 496<br />
Property Agreements (14)<br />
DEH Conservation<br />
- 0<br />
Agreement (0)<br />
Nature Conservation<br />
- 0<br />
Trust Conservation Trust<br />
Agreement (0)<br />
Acquisition by Conservancy<br />
- 0<br />
Agencies (Australian Wildlife<br />
Conservancy, Bush Heritage<br />
Trust, Earth Sanctuaries,<br />
Birds Australia, etc) (0)<br />
Community Title<br />
342 342<br />
Conservation Lots (-)<br />
S88B or s88E Instruments/ No Data No data<br />
Covenants over Private Land<br />
for Conservation (-)<br />
totaL 877 936<br />
Source: DECCW/ <strong>Great</strong> <strong>Lakes</strong> <strong>Council</strong><br />
Table 4.2.3<br />
(hectares)<br />
Land in Non-binding Private Land Covenants<br />
DECCW Wildlife Refuge (WR) (9)<br />
DECCW Management<br />
Contract(MC) (0)<br />
Land for Wildlife (0)<br />
CMA Management Contract (0)<br />
10/11<br />
10 *<br />
8228.59 ha<br />
2<br />
16 ha<br />
12<br />
09/10<br />
(ha)<br />
10/11<br />
(ha)<br />
Critical Habitat Declarations (0) 0 0<br />
SEPP14 Coastal Wetlands 12,999 12,999<br />
SEPP26 Littoral Rainforest 167 167<br />
Environmental Protection 12,489 12,656<br />
Zones (<strong>Great</strong> <strong>Lakes</strong> LEP zones<br />
7a-f)<br />
Marine Park Sanctuary zones 17,631 17,631<br />
Source: DECCW and <strong>Great</strong> <strong>Lakes</strong> <strong>Council</strong><br />
Table 4.2.5<br />
Conservation<br />
Category<br />
Conservation<br />
Agreements<br />
(CA)<br />
Registered<br />
Property<br />
Agreement<br />
(RPA)<br />
Summary of Conserved Lands<br />
Binding<br />
Conservation<br />
(Public and<br />
private) Area (ha)<br />
2<br />
95.72 ha<br />
In perpetuity<br />
11<br />
390 ha<br />
In perpetuity<br />
3<br />
95 ha<br />
Term<br />
Binding<br />
Conservation<br />
Percentage of<br />
LGA (337,300ha)<br />
0.028%<br />
0.115%<br />
0.028%<br />
* Currently 2 CAs – Wards River Rainforest and Wirra Willa.<br />
Wards River CA established in.<br />
* RPAs under the NVC Act current during<br />
Source: DECCW<br />
Figure 4.2.1 Landholders can place portions of their land under<br />
totaL<br />
8244.59 ha<br />
* Currently 10 WRs proclaimed in other years not in.<br />
* MCs under the NVC Act current during<br />
Source: DECCW<br />
Table 4.2.4<br />
Other Conservation (hectares)<br />
conservation agreement to help preserve biodiversity<br />
<strong>Great</strong> <strong>Lakes</strong> <strong>Council</strong> 2011 State of the Environment Report 55
Summary and future direction<br />
While there is a relatively accurate picture of<br />
the extent of conserved land in the LGA (which<br />
is presently 28% of the LGA), there is a very<br />
incomplete picture of the biodiversity that is<br />
present within the reported formal conservation<br />
areas of the LGA, which hinders the local analysis<br />
of the reservation status of individual species,<br />
vegetation communities and ecosystem types<br />
across the <strong>Council</strong> area. Further, the conservation<br />
estate is below the threshold level argued by<br />
some scientists, of 30%, and thus cannot be seen<br />
to be comprehensive, adequate or representative.<br />
There are also some limitations concerning the<br />
completeness of the reported area of conserved<br />
land. This is due to the difficulties encountered<br />
in compiling and sharing data across a number<br />
of different government agencies and a range of<br />
different privacy and access provisions.<br />
The SoE report has established the need for a<br />
<strong>Great</strong> <strong>Lakes</strong> Protected Area Network/ Strategy<br />
to be established to address these issues and to<br />
guide and report on additions to the conserved<br />
land estate over time. This group would<br />
also provide input to the wider Biodiversity<br />
Conservation Framework. Local <strong>Council</strong> is an<br />
appropriate agency to manage and administer<br />
the concept of a Protected Area Network for<br />
the LGA. Obviously, there are a range of other<br />
agencies and stakeholders also involved,<br />
including the Hunter/ Central Rivers CMA and<br />
DECCW (who have responsibility for managing<br />
the public conservation estate). The Protected<br />
Area Network/ Strategy would enable wider data<br />
sharing and cooperation between these relevant<br />
conservation agencies and establish and pursue<br />
conservation mechanisms, areas and targets.<br />
The terms of this strategy should be established<br />
as part of the development of the SoE reporting<br />
process.<br />
Table 4.2.6<br />
Identified needs for action regarding conserved land<br />
Identified Need for Action<br />
Identify, develop and<br />
implement a <strong>Great</strong> <strong>Lakes</strong><br />
Protected Area Network and<br />
Strategy, in association with<br />
relevant agencies (CMA,<br />
DECCW, DoP) to facilitate<br />
data sharing and strategic<br />
biodiversity conservation<br />
reference areas, mechanisms<br />
and targets.<br />
<strong>Council</strong> conduct an audit<br />
of its land to identify, zone<br />
and manage all important<br />
<strong>Council</strong> bushland reserves<br />
for effective and appropriate<br />
conservation.<br />
Recommended key projects<br />
or actions for consideration in<br />
next year’s Management Plan<br />
<strong>Great</strong> <strong>Lakes</strong> Protected Area<br />
Strategy (develop)<br />
<strong>Great</strong> <strong>Lakes</strong> Protected Area<br />
Strategy (develop)<br />
Relevant <strong>Council</strong><br />
section<br />
Natural<br />
Systems<br />
Natural<br />
Systems/ Parks<br />
and Recreation<br />
Are there<br />
existing<br />
resources for<br />
action<br />
Partial<br />
Partial<br />
Commence<br />
by/timeframe<br />
Within 2yrs<br />
Within 2yrs<br />
56 <strong>Great</strong> <strong>Lakes</strong> <strong>Council</strong> 2011 State of the Environment Report
4.3 Corridors<br />
Introduction<br />
Land use for the purpose of agriculture, urban<br />
development and many other changes to the<br />
natural environment has greatly reduced the<br />
amount of habitat available to wildlife. The<br />
fragments of natural vegetation that remain<br />
are often small and isolated from one another<br />
by open pasture or urban development. Such<br />
fragmentation can act as a significant barrier<br />
to wildlife movement. As most wildlife need to<br />
traverse the landscape when foraging, dispersing,<br />
recolonising or migrating, the availability of<br />
secure movement avenues of vegetation cover<br />
is very important. It is widely recognised that<br />
wildlife in a habitat ‘island’ may have insufficient<br />
area of adjacent habitat to forage in, or disperse<br />
along. This can lead to the vulnerability of some<br />
species to catastrophes such as disease and<br />
bushfire, and to gradual changes like inbreeding<br />
and variations in climate.<br />
Habitat corridors, or strips of natural vegetation<br />
connecting ‘island’ habitats, have been identified<br />
as a means of re-connecting isolated populations.<br />
A system of corridor links is more likely to sustain<br />
wildlife populations throughout the fluctuations<br />
and catastrophes that they inevitably undergo.<br />
Thus, habitat corridors can increase the value<br />
of existing isolated habitats. Further, habitat<br />
corridors have a range of social and economic<br />
benefits.<br />
Monitoring<br />
The Department of Environment, Climate Change<br />
and Water (DECCW) has modelled fauna corridors<br />
across the north coast of <strong>NSW</strong>, including the<br />
<strong>Great</strong> <strong>Lakes</strong> LGA. This modelling provides the<br />
only current data pertaining to the identification<br />
and mapping of fauna corridors strategically<br />
across the LGA. This modelling did not consider<br />
non-forest species (e.g. wetland fauna) and was<br />
not responsive to land tenure and property<br />
boundaries. Also, as it has not been confirmed<br />
through detailed local analysis and refined,<br />
such data cannot realistically be adopted in its<br />
present form, but does constitute an important<br />
resource on which to base local or LGA wide<br />
corridor strategies and contribute to DA and<br />
strategic planning. The SoE process is important<br />
to monitor the progress in identifying, mapping<br />
and conserving/ restoring fauna corridors in a<br />
strategic and targeted manner across the LGA.<br />
Results<br />
The names of the 70 modelled corridors of the<br />
LGA that have been identified by DECCW have<br />
been published in a previous comprehensive SoE.<br />
There has been no specific further refinement<br />
or development of wildlife corridor knowledge,<br />
conservation or planning in the LGA since the<br />
publishing of the key regional corridors project.<br />
Consequently, no additional results can be<br />
provided for this SoE. It is hoped that works to<br />
refine and update this mapping for the highest<br />
priority corridors can be strategically commenced<br />
in the near future. This may include and/ or<br />
benefit from the technical assistance of the<br />
Hunter <strong>Council</strong>s Environment Division.<br />
Figure 4.3.1 Residential and development and clearing for agriculture leads to fragmentation of habitat vegetation<br />
<strong>Great</strong> <strong>Lakes</strong> <strong>Council</strong> 2011 State of the Environment Report 57
Summary and future direction<br />
There is a need for <strong>Council</strong>, in combination with<br />
relevant agencies, to implement the appropriate<br />
scale revision of corridor studies and commence<br />
to implement a proactive, integrated corridor<br />
strategy. This might include refinement and<br />
mapping and ultimately involve restoration/<br />
revegetation and private land conservation<br />
through incentives. Until such time as the key<br />
habitats and corridors program is refined and<br />
updated with a local emphasis and included in<br />
statutory plans, the information referred to in this<br />
indicator would remain advisory only. There is a<br />
clear need to resolve and consider local corridor<br />
planning programs across key areas of the LGA<br />
and for the highest priority corridor links, such as<br />
the Myall <strong>Lakes</strong> to Wallingat link.<br />
Table 4.3.1<br />
Identified needs for action regarding corridors<br />
Identified Need for Action<br />
Develop and implement an<br />
integrated corridor strategy<br />
in partnership with relevant<br />
agencies to identify, zone,<br />
conserve, manage and where<br />
required restore and reinstate<br />
wildlife corridors in the LGA<br />
Recommended key projects<br />
or actions for consideration in<br />
next year’s Management Plan<br />
• <strong>Great</strong> <strong>Lakes</strong> Protected Area<br />
Strategy (develop)<br />
• Vegetation Strategy (refine,<br />
update and implement)<br />
Relevant <strong>Council</strong><br />
section<br />
Natural<br />
Systems<br />
Are there<br />
existing<br />
resources for<br />
action<br />
Partial<br />
Commence<br />
by/timeframe<br />
Within 2yrs<br />
58 <strong>Great</strong> <strong>Lakes</strong> <strong>Council</strong> 2011 State of the Environment Report
4.4 Noxious and environmental weeds<br />
Introduction<br />
Invasion by weeds is one of Australia’s most<br />
serious and expensive land degradation problems.<br />
A weed is generally characterised as a plant<br />
growing where it is not wanted or where it was<br />
not originally present. The more serious weeds<br />
in the <strong>Great</strong> <strong>Lakes</strong> LGA are considered as either<br />
weeds of national significance, environmental or<br />
noxious weeds. The term environmental weed<br />
refers to weeds that have the potential to affect<br />
the integrity of local bushland whereas noxious<br />
weeds are declared under the Noxious Weeds Act<br />
1993, as any plant which causes serious economic<br />
loss to agriculture, or has a detrimental affect on<br />
humans, animals or the environment. A list of<br />
weeds of national significance (WoNS) has been<br />
published by the Australian Weeds Committee<br />
National Initiative. The WoNS list is currently<br />
under review and is expected to be modified to<br />
encompass a suite of new and emerging national<br />
threats.<br />
The Noxious Weeds Act 1993 and Weed<br />
declaration lists are also currently under review<br />
with modifications due to be released shortly. A<br />
summary of the current classes is as follows.<br />
Class 1 noxious weeds are plants that pose a<br />
potentially serious threat to primary production<br />
or the environment and are not present in the<br />
State or are present only to a limited extent. The<br />
plant must be eradicated from the land and the<br />
land must be kept free of the plant. It is an offence<br />
to sell, propagate or knowingly distribute these<br />
plants. Notifiable weeds-state prohibited plants.<br />
No new occurrences of Class 1 weeds have been<br />
detected.<br />
Class 2 noxious weeds are plants that pose a<br />
potentially serious threat to primary production<br />
or the environment in a region to which the order<br />
applies and are not present in the region or are<br />
present only to a limited extent. The plant must<br />
be eradicated from the land and the land must be<br />
kept free of the plant. Notifiable weeds-regionally<br />
prohibited plants. No new occurrences of class 2<br />
weeds have been detected.<br />
Class 3 noxious weeds are plants that pose<br />
a serious threat to primary production or the<br />
environment of an area to which the order<br />
applies, are not widely distributed in the area and<br />
are likely to spread in the area or to another area.<br />
These weeds must be regionally controlled. The<br />
plant must be fully and continuously suppressed<br />
and destroyed. <strong>Great</strong> <strong>Lakes</strong> <strong>Council</strong> has recently<br />
discovered one new occurrence of Salvinia<br />
(Salvinia molesta) at Markwell within the Myall<br />
Catchment.<br />
Class 4 noxious weeds are plants that pose a<br />
threat to primary production, the environment or<br />
human and animal health, are widely distributed<br />
in an area to which the order applies and are likely<br />
to spread in the area or to another area. These<br />
are locally controlled weeds that are managed<br />
according to requirements set out by <strong>Council</strong>.<br />
The growth and spread of the plant must be<br />
controlled according to the measures specified<br />
in a management plan published by the local<br />
control authority. A new infestation of Spiny burr<br />
grass (Cenchrus spinifex) has been detected at Tea<br />
Gardens.<br />
Class 5 noxious weeds and their seeds are<br />
Notifiable weeds and are sale restricted. That is,<br />
it is an offence to sell, propagate or knowingly<br />
distribute these plants.<br />
A list of weed species occurring in each class<br />
of the Noxious Weeds Act is available from<br />
<strong>Council</strong> or http://ww.dpi.nsw.gov.au/agriculture/<br />
pestsweeds/weeds/noxweed<br />
Certain weed species listed below have<br />
undergone declaration changes in the <strong>Great</strong> <strong>Lakes</strong><br />
LGA as per weed control orders 25, 26 and 27 as<br />
gazetted:<br />
Common name Scientific name From class To class<br />
Arrowhead Sagittaria montevidensis 5 4<br />
Bridal creeper Asparagus asparagoides 5 4<br />
Leafy elodea/Dense waterweed Egeria densa 5 4<br />
Lippia Phyla canescens Undeclared 4<br />
Tropical soda apple Solanum viarum Undeclared 2<br />
<strong>Great</strong> <strong>Lakes</strong> <strong>Council</strong> 2011 State of the Environment Report 59
Several new & emerging priority weed incursions<br />
have been detected on the mid north coast of<br />
<strong>NSW</strong> and include Tropical Soda Apple (Solanum<br />
viarum), Chinese Violet (Asystasia gangetica ssp.<br />
micrantha), Senegal Tea Plant (Gymnocoronis<br />
spilanthoides) and Kidneyleaf Mudplantain<br />
(Heteranthera reniformis). Fortunately none of<br />
these incursions have been detected in the <strong>Great</strong><br />
<strong>Lakes</strong> LGA to date. Specific new and emerging<br />
species detected in <strong>Great</strong> <strong>Lakes</strong> <strong>Council</strong> area<br />
include Solanum sisymbriifolium (first record for<br />
the North Coast), Spiny Burr Grass (Cenchrus<br />
Spinifex), Saffron Thistle (Carthamus lanatus), all<br />
known infestations of these plants have been<br />
treated and are undergoing monitoring.<br />
The 2010/2011 financial year saw the<br />
implementation of year 1 of the regional<br />
application for the <strong>NSW</strong> Weeds Action Program<br />
(WAP). The WAP replaces the method previously<br />
used to apply for and distribute state funds for<br />
the management of Noxious Weeds in local<br />
control areas of <strong>NSW</strong>. A more coordinated<br />
and accountable, regional approach to weed<br />
management has been implemented across <strong>NSW</strong>,<br />
with a greater emphasis on the monitoring and<br />
evaluation of weed control programs and the<br />
placing of a higher priority on the management<br />
of new and emerging weeds. As a part of these<br />
changes, <strong>Great</strong> <strong>Lakes</strong> <strong>Council</strong> has contributed to<br />
the on going development of a suite of regional<br />
plans and strategies that build on the framework<br />
of the WAP.<br />
Due to this new system the next 5 years will see<br />
all high priority weed species under go a formal<br />
weed risk assessment process. This process will<br />
bring about further changes to the current status<br />
of state and locally declared weed species and<br />
enable <strong>Council</strong> to allocate funds more efficiently<br />
and better prioritise the plants and areas they<br />
manage for weeds.<br />
Monitoring<br />
Weed management is the responsibility of<br />
<strong>Council</strong>’s Noxious and Environmental Weeds<br />
Officer. Due to the dynamic and vast distribution<br />
of weed species <strong>Council</strong> is unable to measure<br />
weed distribution across the LGA in quantitative<br />
or numerical terms. For the purposes of State of<br />
Environment Reporting, <strong>Council</strong>’s Weed Officer<br />
has estimated the distribution of noxious and<br />
significant environmental weeds, occurring in the<br />
LGA, based on field records and observations.<br />
Figure 4.4.1 Aquatic boom in place to protect the Coolongolook<br />
River from Salvina.<br />
Figure 4.4.2 Aerial spraying at Bennett’s Beach Hawks Nest.<br />
60 <strong>Great</strong> <strong>Lakes</strong> <strong>Council</strong> 2011 State of the Environment Report
Results<br />
Table 4.4.1 Noxious Weeds and their distribution in the <strong>Great</strong> <strong>Lakes</strong> LGA<br />
Weed Species<br />
African Boxthom Lycium ferocissimum<br />
Alligator weed Alternanthera philoxeroides (WONS)<br />
Bathurst/Noogora/CaIifornian/cockIe burrs Xanthium spp<br />
Bitou Bush Chrysanthemoides monilifera ssp rotundata (WONS)<br />
Blackberry Rubus fruticosus aggregate spp (WONS)<br />
Bridal Creeper Asparagus asparagoides (WONS)<br />
Broadleaf Pepper Tree Schinus terebinthifolius<br />
Chinese Violet<br />
Crofton Weed Ageratina adenophora<br />
East Indian Hygrophila Hygrophila polysperma<br />
Giant Parramatta Grass Sporobolus fertilis<br />
Giant Rats Tail Grass Sporobolus pyramidalis<br />
Green Cestrum Cestrum parqui<br />
Groundsel Bush Baccharis halimifolia<br />
Hygrophila Hygrophila costata<br />
Kidney Leaf Mud Plantain Heteranthera reniformis<br />
Leafy Elodea/Dense Waterweed<br />
Long Leaf Willow Primrose Ludwigia longifolia<br />
Mother of millions Bryophyllum species<br />
Pampas Grass Cortaderia spp<br />
Patersons Curse Echium spp<br />
Salvinia Salvinia molesta (WONS)<br />
Senegal Tea Plant Gymnocoronis spilanthoides<br />
St. Johns Wort Hypericum perforatum<br />
Tropical Soda Apple Solanum viarum<br />
Water Hyacinth Eichhomia crassipes<br />
Water Lettuce Pistia stratiotes<br />
Estimated Distribution<br />
Occasional & Localised<br />
Occasional & Localised<br />
Common & Widespread<br />
Abundant & Localised<br />
Common & Widespread<br />
Occasional & Localised<br />
Occasional &Localised<br />
Not Present/Weed Alert<br />
Common & Widespread<br />
Occasional & Localised<br />
Common & Widespread<br />
Occasional & Localised<br />
Occasional & Localised<br />
Occasional & Localised<br />
Occasional & Localised<br />
Not Present/Weed Alert<br />
Occasional & Localised<br />
Occasional & Localised<br />
Occasional & Widespread<br />
Occasional & Localised<br />
Occasional & Localised<br />
Occasional & Widespread<br />
Not Present/Weed Alert<br />
Occasional & Localised<br />
Not Present/Weed Alert<br />
Occasional & Widespread<br />
Occasional & Localised<br />
<strong>Great</strong> <strong>Lakes</strong> <strong>Council</strong> 2011 State of the Environment Report 61
Table 4.4.2 Environmental Weeds and their distribution in the <strong>Great</strong> <strong>Lakes</strong> LGA<br />
Weed Species<br />
African Love Grass Eragrostis curvula<br />
African Olive Olea europaea ssp. Africana<br />
Asparagus Fern Asparagus aethiopicus<br />
Asparagus Fern Asparagus plumosus<br />
Bamboo (Rhizamatous) Phyllostachys spp<br />
Black Locust Robinia psuedoacacia var.<br />
Blue Perrywinkle Vinca major<br />
Brazilian Nightshade Solanum seaforthianum<br />
Camphor Laurel Cinnamomum camphora<br />
Cape Ivy/German Ivy/Climbing Cineraria/Creeping Groundsel Delairea<br />
odorata, Climbing Senecio spp.<br />
Cassia/ Senna Senna pendula var. glabrata<br />
Castor Oil Plant Ricinus communis<br />
Cats Claw Creeper Macfadyena ungui - cati<br />
Coolatai Grass/Giant Coolatai Grass Hyparrhenia hirta; H. rufa<br />
Coral Tree – Cockspur Erythrina crista-galli<br />
Coral Tree – Indian Erythrina sykesii<br />
European Olive Olea europaea<br />
Firethorn Pyracantha spp.<br />
Fire weed Senecio madagascariensis<br />
Formosa Lily Lilium formosanum<br />
Giant Reed Arundo donax<br />
Glory Lilly Gloriosa superba<br />
Indian Hawthorn Rhapiolepis indica<br />
Japanese Honeysuckle Lonicera japonica<br />
Madeira Vine Anredera cordifolia<br />
Mickey Mouse Plant Ochna serrulata<br />
Mist Flower Ageratina riparia<br />
Morning Glory Ipomoea indica, Ipomea cairica<br />
Moth Vine Araujia sericifera<br />
Myrtle Leaf Milkwort Polygala myrtifolia<br />
Mysore Thorn Caesalpinia decapetala<br />
Narrow Leaf Cotton bush Gomphocarpus fruticosus<br />
Orange Jessamine Murraya paniculata<br />
Parrots Feather Myriophyllum aquaticum<br />
Passion Flower/Fruit Passiflora spp.<br />
Pine Trees Pinus Spp.<br />
Privet Ligustrum sinense Ligustrum lucidum<br />
Purple Broom Polygala virgata<br />
Umbrella Tree (Qld) Schefflera actinophylla<br />
Wandering Jew Tradescantia albiflora<br />
Wild Tobacco Solanum mauritianum<br />
Yellow Bells Tecoma stans<br />
Yellow Waterlily Nymphaea Mexicana<br />
Estimated Distribution<br />
Common & Localised<br />
Occasional & Localised<br />
Common & Localised<br />
Occasional & Localised<br />
Occasional & Localised<br />
Occasional & Localised<br />
Occasional & Localised<br />
Occasional & Widespread<br />
Common & Widespread<br />
Common & Localised<br />
Common & Widespread<br />
Occasional & Widespread<br />
Occasional & Localised<br />
Occasional & Widespread<br />
Occasional & Localised<br />
Occasional & Localised<br />
*Weed Alert* (likely to become a<br />
significant problem)<br />
Occasional & Localised<br />
Common & Widespread<br />
Occasional & Localised<br />
Occasional & Localised<br />
Occasional & Localised<br />
Occasional & Localised<br />
Common & Widespread<br />
Occasional & Widespread<br />
Occasional & Localised<br />
Common & Widespread<br />
Common & Widespread<br />
Occasional & Widespread<br />
Occasional & Localised<br />
Occasional & Localised<br />
Occasional & Widespread<br />
Occasional & Localised<br />
Common & Localised<br />
Common & Widespread<br />
Occasional & Widespread<br />
Common & Widespread<br />
Common & Widespread<br />
Common & Localised<br />
Common & Widespread<br />
Common & Widespread<br />
Occasional & Widespread<br />
Occasional & Localised<br />
62 <strong>Great</strong> <strong>Lakes</strong> <strong>Council</strong> 2011 State of the Environment Report
Response and future direction<br />
The ongoing control and monitoring of new and<br />
emerging weeds and established noxious aquatic<br />
weeds such as Tropical Soda Apple, Salvinia,<br />
Cabomba, Water Hyacinth but especially Alligator<br />
Weed have taken priority due to their aggressive<br />
nature, and threat to severely degrade our<br />
waterways. Infestations of these weeds are on the<br />
increase.<br />
A number of weed management projects have<br />
been commenced / continued during the 2010<br />
– 2011 financial year. Some of the higher profile<br />
projects include:-<br />
• Ongoing - A regional project in conjunction<br />
with the Mid North Coast Weeds Advisory<br />
Committee funded by Hunter Central<br />
Rivers Catchment Management Authority<br />
(HCRCMA), targeting emerging thorny plants<br />
such as Black locust (Robinia psuedoacacia)<br />
and Mysore thorn (Caesalpinia decapetala) at<br />
Stroud and Tahlee.<br />
• Ongoing - A regional project in conjunction<br />
with the Mid North Coast Weeds Advisory<br />
Committee funded by HCRCMA targeting the<br />
emerging vine weed Madeira vine (Anredera<br />
cordifolia) at Forster, Tuncurry, Smiths Lake,<br />
Coolongolook, Minimbah and Bungwahl.<br />
• Ongoing - A $14,000 follow up aerial spraying<br />
project was undertaken at Hawks Nest to<br />
compliment on ground works undertaken<br />
by <strong>Council</strong> and its vast network of volunteer<br />
groups. 110 hectares of Bitou Bush (Bitou<br />
Bush Chrysanthemoides monilifera ssp<br />
rotundata) was treated at Bennett’s Beach<br />
and Yacaaba Peninsula Hawks Nest. Further<br />
follow up will take place in subsequent years<br />
in an attempt to reduce and deplete the seed<br />
bank.<br />
• Ongoing - <strong>Great</strong> <strong>Lakes</strong> <strong>Council</strong> has assisted<br />
<strong>NSW</strong> Industry and Investment with chemical<br />
trials on the submerged aquatic weed<br />
Cabomba (Cabomba caroliniana). Several<br />
ponds in the <strong>Great</strong> <strong>Lakes</strong> local government<br />
area (LGA) have been treated and monitored<br />
for its success. It is hoped to obtain<br />
registration for one or a number of chemicals<br />
suitable for use on this hard to manage<br />
aggressive weed.<br />
• Commenced - A cross agency project<br />
in conjunction with the National Parks<br />
and Wildlife Service funded by HCRCMA,<br />
targeting Parrots Feather (Myriophyllum<br />
aquaticum) to reduce its impact on the<br />
Ramsar listed Myall <strong>Lakes</strong>. In total $97,426<br />
was received to be delivered over a 15 year<br />
period.<br />
• Commenced - A plant replacement program<br />
was delivered to the Seal Rocks community.<br />
All properties within the village area were<br />
targeted for the presence of noxious and<br />
environmental weeds with the aim to<br />
educate the community about the impact<br />
of weeds on its surrounding environment.<br />
Free desirable native replacement plants and<br />
assistance for the removal of undesirable<br />
species was on offer to those who needed<br />
assistance.<br />
• Commenced - <strong>Great</strong> <strong>Lakes</strong> <strong>Council</strong><br />
participated in a cross regional project to<br />
control the newly identified threat Tropical<br />
Soda Apple. This was combined with a<br />
state wide inspection program utilising the<br />
National Livestock identification System<br />
tracing cattle movements from infested<br />
properties. High risk areas including 10<br />
private properties encompassing 1120<br />
hectares were inspected in the <strong>Great</strong> <strong>Lakes</strong><br />
LGA revealing no infestations of Tropical Soda<br />
Apple.<br />
• Commenced - <strong>Great</strong> <strong>Lakes</strong> <strong>Council</strong> in<br />
conjunction with Mid North Coast Weed<br />
Coordinating Committee and the <strong>NSW</strong> DPI<br />
have applied for a Caring for Our Country<br />
grant totalling $191,760 to target all known<br />
Cabomba infestations that pose a threat to<br />
the Ramsar listed Myall lakes system.<br />
• Commenced - A project was undertaken<br />
in conjunction with <strong>NSW</strong> DPI to erect<br />
educational signs targeting boat and trailer<br />
hygiene at high risk boat ramps within the<br />
<strong>Great</strong> <strong>Lakes</strong> LGA.<br />
During the reporting period, 12 local agricultural<br />
shows, community events, farmers meetings<br />
and field days have been held by <strong>Council</strong> staff<br />
involved with the management of weeds.<br />
Information sheets have been made readily<br />
available to the public on request and on<br />
<strong>Council</strong>’s website. Regular media releases have<br />
<strong>Great</strong> <strong>Lakes</strong> <strong>Council</strong> 2011 State of the Environment Report 63
also been conducted, including a monthly article<br />
in the North Coast Town and Country. <strong>Council</strong><br />
has produced a landholder information pack that<br />
contains numerous high value documents on a<br />
compact disk that is distributed at events as well<br />
as during property inspections.<br />
There has been the continuation of planned<br />
control strategies for Bitou Bush and other<br />
terrestrial weeds, with works undertaken by local<br />
community groups at various locations assisted<br />
by <strong>Council</strong>. <strong>Council</strong> supports a network of 877<br />
registered volunteers across 64 working groups<br />
involved in reserve maintenance and natural areas<br />
protection.<br />
Biological controls have been released and<br />
monitored across the <strong>Great</strong> <strong>Lakes</strong> LGA. A “Weed<br />
Warriors” Program was held over 2 terms at Pacific<br />
Palms Public School and a facility to raise the Leaf<br />
Rolling moth (Tortrix spp) has being constructed<br />
& maintained by a local volunteer assisted by<br />
<strong>Council</strong>.<br />
Previously the leaf sucking tingid fly Carvalhotingis<br />
visenda was released in a small infestation of Cats<br />
Claw Creeper at Upper Monkerai monitoring is<br />
ongoing. Lantana rust Prospodium tuberculatum<br />
although now being established in a widespread<br />
area of the Mid North Coast it is not yet having a<br />
major impact on infestations. <strong>Great</strong> <strong>Lakes</strong> <strong>Council</strong>,<br />
as part of the Lantana Biological Control Taskforce<br />
will now be focusing on the release of new bioagents<br />
when available. Most recently a beetle<br />
(Plectonycha correntina) has been raised as a<br />
biological control for Madeira Vine. As soon as the<br />
insects are made available to <strong>Great</strong> <strong>Lakes</strong> <strong>Council</strong>,<br />
releases will be made in selected locations across<br />
the LGA. Salvinia weevil (Cyrtobagous savliniae)<br />
are continually being released and monitored<br />
across the <strong>Great</strong> <strong>Lakes</strong> LGA. In one particular<br />
release site, 7 hectares of tertiary growth Salvia<br />
at North Arm Cove, has seen a 95% reduction<br />
in biomass over a 5 year period proving to be<br />
an increasingly important part of a successful<br />
integrated pest management program. A Salvinia<br />
biological control training course was held at<br />
Forster to empower weed professionals with the<br />
necessary skills to release successfully release and<br />
monitor biological controls.<br />
Figure 4.4.3 Photos depicting a 95% reduction in plant biomass<br />
from January 2005 to May 2010<br />
<strong>Council</strong> has previously contributed to and<br />
adopted the Mid North Coast Regional Weeds<br />
Strategy 2008 - 2012 and regional weed control<br />
management plans for Alligator Weed, Bitou Bush,<br />
Bird Lolly weeds, Noxious floating aquatic weeds,<br />
Giant Parramatta Grass, Crofton Weed, Groundsel<br />
Bush, Cabomba, St Johns Wort, Red flowering<br />
Lantana, Asparagus weeds and Vine weeds. All<br />
these plans will under go review over the next 3<br />
years.<br />
Private property inspections are carried out<br />
with an aim to compliment regional control<br />
plans, the enforcement of regulations and to aid<br />
residents with information to assist their weed<br />
management programs. The main inspection<br />
program was focused in localised catchments<br />
adjacent to high value wetlands and waterways<br />
complimenting <strong>Council</strong>s previous and continuing<br />
investment in the protection and rehabilitation<br />
of these significant environmental assets. <strong>Council</strong><br />
will continue to enforce the Noxious Weed Act<br />
where deemed necessary. In the first instance<br />
<strong>Council</strong> will seek to educate and encourage<br />
64 <strong>Great</strong> <strong>Lakes</strong> <strong>Council</strong> 2011 State of the Environment Report
landowners to control weeds. Emphasis will<br />
always be on a personal approach with an<br />
accompanying letter. Notices will be issued<br />
where landowners fail to co operate fully in the<br />
control of noxious weeds on their property or are<br />
conducting activities that serve to facilitate the<br />
spread of noxious weeds. This action is usually<br />
successful and <strong>Council</strong> has rarely needed to resort<br />
to Court Action, despite the legal ability to do so.<br />
<strong>Great</strong> <strong>Lakes</strong> <strong>Council</strong> has one full time weed<br />
officer, who is responsible for all control,<br />
administration and mapping duties. <strong>Council</strong> has<br />
recently employed a temporary part time officer<br />
to assist with weed management duties. Due<br />
to the extensive and dynamic nature of weed<br />
infestations and current resource limitations<br />
<strong>Council</strong> will be focusing on the management of<br />
new incursions and weeds of limited distribution,<br />
the issue of wide spread weeds in the LGA is likely<br />
to worsen over time, rather than remain static or<br />
improve.<br />
Table 4.4.3<br />
Identified needs for action regarding weeds<br />
Identified Need for Action<br />
Continue weed mapping,<br />
volunteer support and<br />
educational/promotional<br />
duties<br />
Develop weed management<br />
plans for all noxious weeds<br />
found in LGA<br />
Implement on-ground<br />
control works for all Class<br />
2, and 3 Noxious weeds,<br />
selected Class 4 weeds and<br />
Environmental Weeds<br />
Continue to enforce Noxious<br />
Weeds Act<br />
Consider the need to<br />
expand the Noxious and<br />
Environmental Weed<br />
activities of <strong>Council</strong> by<br />
increasing staff in this area<br />
Recommended key projects<br />
or actions for consideration in<br />
next year’s Management Plan<br />
Continue and improve weed<br />
management activities<br />
Continue and improve weed<br />
management activities<br />
Continue and improve weed<br />
management activities<br />
Continue and improve weed<br />
management activities<br />
Continue and improve weed<br />
management activities<br />
Relevant <strong>Council</strong><br />
section<br />
Parks &<br />
Recreational<br />
Services<br />
Parks &<br />
Recreational<br />
Services<br />
Parks &<br />
Recreational<br />
Services<br />
Parks &<br />
Recreational<br />
Services<br />
Parks &<br />
Recreational<br />
Services<br />
Are there<br />
existing<br />
resources for<br />
action<br />
Yes<br />
Partial<br />
No<br />
Partial<br />
No<br />
Commence<br />
by/timeframe<br />
Ongoing<br />
Ongoing<br />
Ongoing<br />
Ongoing<br />
Ongoing<br />
<strong>Great</strong> <strong>Lakes</strong> <strong>Council</strong> 2011 State of the Environment Report 65
4.5 Seagrass<br />
Introduction<br />
Seagrass beds are a fragile and intricate<br />
component of our estuaries and play an important<br />
role in the healthy functioning of our waterways.<br />
Seagrass ecosystems are highly productive and<br />
diverse, and support complex food webs. They<br />
provide habitat and shelter for marine animals,<br />
and are often called “the nursery of the sea”.<br />
In addition, seagrass provide many ecosystem<br />
services, such as sediment binding, baffle effect<br />
and shoreline protection. They are carbon fixers,<br />
and oxygenate the water, as well as recycling<br />
nutrients and forming a nutrient sink in the estuary.<br />
The dead seagrass fronds form a physical barrier<br />
on shorelines that reduce erosion and provide a<br />
food source to detritivores. Although important,<br />
the extent of seagrass beds throughout <strong>NSW</strong> are<br />
in decline with more than two thirds of seagrass<br />
beds destroyed over the past 30 years. This decline<br />
has been attributed to human impacts including<br />
pollution, development, dredging, recreational<br />
activities and poor land management. Since these<br />
impacts lead to measurable dieback and decreased<br />
density in seagrass beds, they are an ideal indicator<br />
for monitoring the health of our waterways.<br />
Seagrass beds are sensitive to many factors<br />
including turbidity, pH, nutrient levels, temperature<br />
and physical disturbance. Resilience of seagrass<br />
differs for individual species, as some are more<br />
sensitive to disturbance and stress than others.<br />
The local lake systems comprising Wallis, Smiths<br />
and Myall <strong>Lakes</strong> support some of the most<br />
extensive seagrass communities within <strong>NSW</strong>. Wallis<br />
Lake alone is well known for containing more area<br />
of seagrass than any other <strong>NSW</strong> estuary or lake; and<br />
for the most northern population of Strapweed<br />
(Posidonia australis) within Australia. Three<br />
additional native species of seagrass including<br />
Eelgrass (Zostera capricorni), Paddleweed (Halophila<br />
ovalis) and Sea Tassel (Ruppia megacarpa) are also<br />
found within Wallis Lake. Recent studies have<br />
added another seagrass species to the list, with<br />
Halodule tridentata being discovered throughout of<br />
Wallis Lake. This is the first record of this species in<br />
<strong>NSW</strong>, and forms the most southerly location for this<br />
species in Australia.<br />
Monitoring<br />
In 2002, <strong>Council</strong> developed a community<br />
seagrass-monitoring program to assess smallscale<br />
seasonal variability in seagrass beds within<br />
Wallis Lake. This program aimed to involve<br />
community volunteers in determining the health<br />
of Wallis Lake and its catchment and to monitor<br />
the effectiveness of environmental management<br />
within the region. Previously to this reporting<br />
period monitoring occurred at 11 sites within<br />
Wallis Lake. Volunteers measured the presence<br />
and density of seagrass, macroalgae and<br />
epiphytes species as well as the turbidity, depth<br />
and general observations.<br />
Figure 4.5.1 Paddleweed - Halophila ovalis<br />
Figure 4.5.2 False seagrass straps installed amongst Posidonia beds<br />
in Wallis Lake, August 2011<br />
Seagrasses also provide habitat for some of Wallis<br />
Lake’s sponge species, many of which are yet to be<br />
scientfically described.<br />
66 <strong>Great</strong> <strong>Lakes</strong> <strong>Council</strong> 2011 State of the Environment Report
Summary and future direction<br />
Unfortunately, data collected through <strong>Council</strong>’s<br />
Community Seagrass Monitoring Program has<br />
been rendered unusable for this report due to its<br />
vastness and subjective nature. In the delivery of<br />
the WQIP, <strong>Council</strong> has contracted the Department<br />
of Primary Industries to map the seagrass beds<br />
in the Forster Keys / Pipers Bay area of Wallis<br />
Lake. DPI is using aerial imagery to determine<br />
areas and extent of sea grass beds as well species<br />
composition in the study area. They are testing<br />
the validity of such data by ground truthing and<br />
will be able to generate robust maps of seagrass<br />
distribution and composition in the Pipers Bay<br />
area of Wallis Lake. <strong>Council</strong> are developing a<br />
program, in conjunction with DECCW scientists, to<br />
measure epiphytic grow on seagrass in the study<br />
area. This program provides clear information on<br />
seagrass health in the study area. The method is<br />
relatively simple and easy to manage in terms of<br />
data and analysis. <strong>Council</strong> will use the method<br />
to educate residents about the importance of<br />
seagrass as well engaging volunteers in a ‘userfriendly’<br />
and meaningful seagrass monitoring<br />
program.<br />
Figure 4.5.3 Community seagrass monitoring training<br />
Table 4.5.1<br />
Identified needs for action regarding seagrass<br />
Identified Need for Action<br />
Develop user-friendly<br />
seagrass monitoring and<br />
community engagement<br />
program for residents of<br />
Pipers Bay/Forster Keys.<br />
Provide on-going general<br />
education and awareness on<br />
the value of seagrass through<br />
the Healthy <strong>Lakes</strong> Program/<br />
Summer Coast Care Program<br />
Recommended key projects<br />
or actions for consideration in<br />
next year’s Management Plan<br />
Seagrass Epiphyte<br />
Monitoring Protocol<br />
developed and delivered<br />
with quarterly monitoring<br />
events<br />
Healthy <strong>Lakes</strong> Program<br />
(continue expanding<br />
initiatives through the<br />
Summer Coastcare Program)<br />
Relevant <strong>Council</strong><br />
section<br />
Natural<br />
Systems<br />
Natural<br />
Systems<br />
Are there<br />
existing<br />
resources for<br />
action<br />
Commence<br />
by/timeframe<br />
Y June 2012<br />
Y<br />
Within 2yrs<br />
<strong>Great</strong> <strong>Lakes</strong> <strong>Council</strong> 2011 State of the Environment Report 67
4.6 Recovery and threat abatement plans<br />
Introduction<br />
In New South Wales, threatened native plants<br />
and animals, populations and communities are<br />
listed on the Threatened Species Conservation Act<br />
1995 (with the exception of fish and marine plants<br />
which are listed on the Fisheries Management<br />
Act). These Acts provide for the identification,<br />
conservation and recovery of threatened species,<br />
populations and communities and also aim to<br />
reduce the threats faced by those species.<br />
Since its amendment in 2003, the preparation<br />
and implementation of recovery plans for each<br />
species, population or ecological community<br />
listed as threatened is no longer mandatory,<br />
although the recovery planning mechanism<br />
does remain for relevant threatened biodiversity.<br />
Instead, there is a requirement for the preparation<br />
and implementation of priority action statements<br />
for threatened entities. Where recovery plans are<br />
prepared and implemented, they are typically<br />
designed to return the species, population or<br />
ecological community to a point where it is viable<br />
in nature and is no longer at risk of extinction.<br />
Among other things, recovery plans outline the<br />
actions that government and other organisations<br />
are bound to undertake to achieve that recovery.<br />
It is a legislative requirement of the SoE process<br />
that actions within approved recovery plans are<br />
reported on annually.<br />
An analysis of recorded sightings of threatened<br />
biodiversity indicates that the <strong>Great</strong> <strong>Lakes</strong> LGA<br />
contains 125 threatened entities as shown in Table<br />
4.6.1.<br />
Table 4.6.1 Number of threatened entities known to occur within<br />
the <strong>Great</strong> <strong>Lakes</strong> LGA.<br />
Threatened biodiversity within the <strong>Great</strong> <strong>Lakes</strong> LGA<br />
No. known in No. known in<br />
<strong>Great</strong> <strong>Lakes</strong> <strong>Great</strong> <strong>Lakes</strong><br />
Group<br />
LGA 09/10 LGA 10/11<br />
Endangered<br />
3 3<br />
populations<br />
Endangered/<br />
11 12<br />
Vulnerable ecological<br />
communities<br />
Threatened flora 28 29<br />
Threatened mammals 27 28<br />
Threatened frogs 6 6<br />
Threatened reptiles 1 1<br />
Threatened birds 45 45<br />
Threatened aquatic<br />
1 1<br />
fauna (estuarine)<br />
Total 122 125<br />
Source: <strong>Great</strong> <strong>Lakes</strong> <strong>Council</strong><br />
Figure 4.6.1 The Red Goshawk<br />
To date, within the <strong>Great</strong> <strong>Lakes</strong> LGA, the<br />
following Approved Recovery Plans are currently<br />
operational:<br />
• State Recovery Plan for the Endangered Koala<br />
Population of Hawks Nest/ Tea Gardens<br />
• State Recovery Plan for the Yellow-bellied<br />
Glider<br />
• State Recovery Plan for the Red Goshawk<br />
• State Recovery Plan for the Little Tern<br />
• State Recovery Plan for the Bush Stonecurlew<br />
• National Recovery Plan for the Swift Parrot<br />
Monitoring<br />
For each SoE report, an annual summary will be<br />
presented on <strong>Council</strong>’s progress towards relevant<br />
recovery actions for each of the State Recovery<br />
Plans mentioned above. Only recovery actions<br />
that <strong>Council</strong> has a lead or supporting role in<br />
implementing will be reported against.<br />
68 <strong>Great</strong> <strong>Lakes</strong> <strong>Council</strong> 2011 State of the Environment Report
Results<br />
Table 4.6.2 Hawks Nest and Tea Gardens Endangered Koala<br />
Population Recovery Plan Implementation outcomes achieved to<br />
date.<br />
Hawks Nest and Tea Gardens<br />
Endangered Koala Population<br />
Recovery Plan Actions<br />
<strong>Council</strong> Action<br />
Action<br />
Commenced Completed<br />
1.1 Plan coordination Yes In progress<br />
1.2 Develop working group Yes Yes<br />
1.3 Monitoring program No No<br />
2.1 Mapping and reporting Yes No<br />
3.1 Prioritise management No No<br />
areas<br />
3.2 Survey habitat links Yes No<br />
3.3 Survey/ assessment Yes No<br />
guidelines<br />
3.4 Blackspot identification Yes No<br />
3.5 Strategic streetscaping Yes No<br />
3.6 Companion animal No No<br />
policy<br />
3.7 Coordination of dog Yes No<br />
control<br />
4.1 Habitat zoning Yes No<br />
4.2 Awareness of<br />
No No<br />
protection measures<br />
4.3 Support BFMC No No<br />
4.4 GLC Plans of<br />
Yes No<br />
Management<br />
5.1 Rehabilitation/<br />
Yes No<br />
replanting advice<br />
6.1 Establishment of<br />
Yes No<br />
database<br />
6.2 Education and<br />
Yes No<br />
awareness<br />
7.1 Information exchange Yes No<br />
7.2 Identification of release<br />
sites<br />
Yes No<br />
Table 4.6.3 Little Tern Recovery Plan Implementation outcomes<br />
achieved to date.<br />
Little Tern Recovery Plan<br />
Actions (where <strong>Council</strong> is an<br />
implementation partner)<br />
Action<br />
1.1 Inform and consult<br />
with land managers<br />
2.1 Intensive management<br />
of nesting, resting and<br />
fledgling feeding sites<br />
3.1 Investigate the<br />
potential for the<br />
incidental creation of<br />
island nesting sites<br />
using dredge spoil<br />
8.2 Targeting community<br />
groups<br />
8.4 Liaison with interest<br />
groups<br />
<strong>Council</strong> Action<br />
Commenced Completed<br />
No<br />
No<br />
No<br />
No<br />
No<br />
Table 4.6.4 Red Goshawk Recovery Plan Implementation<br />
outcomes achieved to date.<br />
Red Goshawk Recovery Plan<br />
Actions (where <strong>Council</strong> is an<br />
implementation partner)<br />
Action<br />
3.1 Formulate<br />
standardised survey<br />
methods<br />
4.1 Communicate<br />
environmental impact<br />
assessment and survey<br />
guidelines<br />
4.2 Education package<br />
on identification,<br />
distribution, habitat,<br />
status and threats<br />
5.4 Management of<br />
populations on public<br />
land<br />
5.5 Awareness of longterm<br />
protection<br />
measures<br />
5.6 Maintain strict security<br />
around nest sites<br />
No<br />
No<br />
No<br />
No<br />
No<br />
<strong>Council</strong> Action<br />
Commenced Completed<br />
No<br />
No<br />
No<br />
No<br />
No<br />
No<br />
No<br />
No<br />
No<br />
No<br />
No<br />
No<br />
<strong>Great</strong> <strong>Lakes</strong> <strong>Council</strong> 2011 State of the Environment Report 69
Table 4.6.5 Yellow-bellied Glider Recovery Plan Implementation<br />
outcomes achieved to date.<br />
Yellow-bellied Glider<br />
Recovery Plan Actions (where<br />
<strong>Council</strong> is an implementation<br />
partner)<br />
<strong>Council</strong> Action<br />
Action<br />
Commenced Completed<br />
2.1 Formulate<br />
No No<br />
standardised survey<br />
methods<br />
2.3 Inclusion of regional No No<br />
based habitat types,<br />
sap trees and sap tree<br />
species in EPI<br />
2.6 Consideration<br />
No No<br />
of impacts of<br />
fragmentation by road,<br />
easement and linear<br />
clearing design<br />
3.1 Identification of<br />
No No<br />
significant populations<br />
and their associated<br />
specific management<br />
issues<br />
4.1 Strategic research No No<br />
4.2 Information package<br />
for community<br />
awareness of<br />
habitat sap trees<br />
and protection and<br />
enhancement<br />
No No<br />
Table 4.6.6 Bush Stone-curlew Recovery Plan Implementation<br />
outcomes achieved to date.<br />
Bush Stone-curlew Recovery<br />
Plan Actions (where <strong>Council</strong><br />
is an implementation partner<br />
Action<br />
<strong>Council</strong> Action<br />
Commenced Completed<br />
1.1 Support existing<br />
No No<br />
projects<br />
2.1 Publicity activities to No No<br />
raise awareness<br />
2.2 Maintain and<br />
No No<br />
distribute information<br />
materials<br />
2.4 Bush Stone Curlew No No<br />
summit<br />
3.1 Identify and map<br />
No No<br />
habitat<br />
3.2 Field and community No No<br />
surveys<br />
3.3 Predator and pest No No<br />
control programs<br />
3.4 Annual monitoring of No No<br />
populations<br />
3.5 Manage habitat (nonpublic<br />
No No<br />
land)<br />
3.6 Apply for off-label No No<br />
permits for 1080<br />
baiting programs<br />
3.7 Protect and manage No No<br />
habitat on public land<br />
3.8 Encourage habitat No No<br />
protection on private<br />
land<br />
3.9 Establish and support No No<br />
community groups<br />
3.10 Prepare and<br />
No No<br />
implement<br />
management plans<br />
4.2 Identify sites for<br />
No No<br />
translocations<br />
4.4 Secure funding<br />
No No<br />
for post-release<br />
monitoring<br />
6.1 EIA and survey<br />
No No<br />
guidelines<br />
6.2 Consideration during No No<br />
EPI biodiversity<br />
certification<br />
6.5 Enter records into Atlas No No<br />
of <strong>NSW</strong> Wildlife<br />
7.1 Ecological research No No<br />
8.3 Research into habitat No No<br />
degradation<br />
11.1 Source funding for<br />
implementation<br />
No No<br />
70 <strong>Great</strong> <strong>Lakes</strong> <strong>Council</strong> 2011 State of the Environment Report
Table 4.6.7 Swift Parrot Recovery Plan Implementation outcomes<br />
achieved to date.<br />
National Swift Parrot<br />
Recovery Plan Actions<br />
(where <strong>Council</strong> may be an<br />
implementation partner)<br />
Action<br />
1a. Identify the extent<br />
and quality of foraging<br />
habitat within the<br />
over-wintering range<br />
(especially Coastal<br />
Spotted Gum, Swamp<br />
Mahogany and<br />
northern Forest Red<br />
Gum/ Ironbark Forests)<br />
2a. Mapping of foraging<br />
and breeding habitat<br />
2b. Management and<br />
protection of habitat<br />
5a. Community and<br />
volunteer network<br />
<strong>Council</strong> Action<br />
Commenced Completed<br />
No<br />
No<br />
No<br />
No<br />
No<br />
No<br />
No<br />
No<br />
Table 4.6.8 Large Forest Owls Recovery Plan Implementation<br />
outcomes achieved to date.<br />
Large Forest Owls Recovery<br />
Plan Actions (where <strong>Council</strong><br />
is an implementation<br />
partner<br />
Action<br />
2.1 Develop sampling<br />
strategy and regional<br />
monitoring protocols<br />
2.2 Investigate<br />
cooperative<br />
involvement of other<br />
agencies in monitoring<br />
2.3 Implement regional<br />
monitoring program<br />
4.1 Prepare and<br />
disseminate EIA<br />
guidelines<br />
4.2 Monitor effectiveness<br />
of concurrence and<br />
licence conditions<br />
4.3 Develop prescriptive<br />
guidelines<br />
4.5 Facilitate consideration<br />
of large forest owls<br />
during biodiversity<br />
certification<br />
assessments<br />
5.1 Prepare guidelines for<br />
habitat protection,<br />
management and<br />
survey<br />
6.2 Promote awareness of<br />
research needs<br />
7.1 Encourage and<br />
coordinate<br />
involvement of<br />
community groups<br />
8.2 Seek to integrate<br />
recovery actions<br />
<strong>Council</strong> Action<br />
Commenced Completed<br />
No<br />
No<br />
No<br />
No<br />
No<br />
No<br />
No<br />
No<br />
No<br />
No<br />
No<br />
No<br />
No<br />
No<br />
No<br />
No<br />
No<br />
No<br />
No<br />
No<br />
No<br />
No<br />
<strong>Great</strong> <strong>Lakes</strong> <strong>Council</strong> 2011 State of the Environment Report 71
Table 4.6.9 National Regent Honeyeater Recovery Plan<br />
Implementation outcomes achieved to date.<br />
National Regent Honeyeater<br />
Recovery Plan Actions<br />
(where <strong>Council</strong> may be an<br />
implementation partner)<br />
Action<br />
1 Establish expanded<br />
Operations Groups in<br />
all known regularly<br />
used sites<br />
2 Develop generic<br />
guidelines for content<br />
of regional work plans<br />
2 Prepare regional work<br />
plans for the key<br />
regions<br />
2 Develop an<br />
information<br />
package on habitat<br />
requirements and<br />
guidelines for habitat<br />
management<br />
2 Ensure habitat<br />
management<br />
guidelines are<br />
reflected in<br />
regional ecosystem<br />
management plans<br />
2 Identify patches of<br />
significant habitats<br />
and promote habitat<br />
management<br />
guidelines to relevant<br />
land managers and<br />
agency staff<br />
5 State agency staff and<br />
Operations Groups to<br />
promote appropriate<br />
management of<br />
significant habitat<br />
patches<br />
<strong>Council</strong> Action<br />
Commenced Completed<br />
No<br />
No<br />
No<br />
No<br />
No<br />
No<br />
No<br />
No<br />
No<br />
No<br />
No<br />
No<br />
No<br />
No<br />
Table 4.6.10 National Wallum-dependent Frog Species Recovery<br />
Plan Implementation outcomes achieved to date.<br />
National Wallum-dependent<br />
Frog Species Recovery Plan<br />
Actions (where <strong>Council</strong><br />
may be an implementation<br />
partner)<br />
Action<br />
<strong>Council</strong> Action<br />
Commenced Completed<br />
1.2 Map habitat No No<br />
1.3 Conduct surveys No No<br />
2.1 Ensure appropriate No No<br />
legislative protection<br />
of wallum froglet<br />
habitat<br />
2.3 Apply guidelines for No No<br />
habitat protection and<br />
management<br />
3 Acquire additional No No<br />
information on<br />
threats to inform<br />
management<br />
4.1 Fact sheets and poster No No<br />
boards<br />
4.2 Dissemination of<br />
No No<br />
information on<br />
wallum froglet habitat<br />
management and<br />
protection<br />
5 Rehabilitate degraded No No<br />
wallum froglet habitat<br />
6.1 Develop methodology No No<br />
for monitoring<br />
6.2 Undertake monitoring No No<br />
72 <strong>Great</strong> <strong>Lakes</strong> <strong>Council</strong> 2011 State of the Environment Report
Table 4.6.11 Brush-tailed Rock Wallaby Recovery Plan<br />
Implementation outcomes achieved to date.<br />
Brush-tailed Rock Wallaby<br />
Recovery Plan Actions<br />
(where <strong>Council</strong> is an<br />
implementation partner)<br />
Action<br />
6 Standardised survey<br />
techniques for BTRW<br />
presence/ absence<br />
7 Monitoring techniques<br />
for estimating BTRW<br />
abundance<br />
11 Research BTRW<br />
ecology<br />
12 Database on past and<br />
present occupation<br />
of BTRW sites and<br />
management actions<br />
and review<br />
13 Best practice<br />
guidelines for site<br />
management<br />
14 Site-specific<br />
management<br />
programs for priority<br />
BTRW sites within best<br />
practice guidelines<br />
15 Management network<br />
to control predators at<br />
priority sites<br />
16 Management network<br />
to control feral<br />
competitors at priority<br />
sites<br />
17 Broader community<br />
support for ongoing<br />
predator and<br />
competitor control<br />
programs<br />
18 Identify sites and land<br />
management actions<br />
to ameliorate impacts<br />
of habitat loss<br />
23 Generic community<br />
information and<br />
support for BTRW<br />
recovery<br />
24 Promote opportunities<br />
for community<br />
involvement in BTRW<br />
recovery programs<br />
26 Establish community<br />
support groups in<br />
significant populations<br />
<strong>Council</strong> Action<br />
Commenced Completed<br />
No<br />
No<br />
No<br />
No<br />
No<br />
No<br />
No<br />
No<br />
No<br />
No<br />
No<br />
No<br />
No<br />
No<br />
No<br />
No<br />
No<br />
No<br />
No<br />
No<br />
No<br />
No<br />
No<br />
No<br />
No<br />
No<br />
The names of the 70 modelled corridors of the<br />
LGA that have been identified by DECCW have<br />
been published in a previous comprehensive SoE.<br />
There has been no specific further refinement<br />
or development of wildlife corridor knowledge,<br />
conservation or planning in the LGA since the<br />
publishing of the key regional corridors project.<br />
Consequently, no additional results can be<br />
provided for this SoE. It is hoped that works to<br />
refine and update this mapping for the highest<br />
priority corridors can be strategically commenced<br />
in the near future. This may include and/ or<br />
benefit from the technical assistance of the<br />
Hunter <strong>Council</strong>s Environment Division.<br />
Summary and future direction<br />
There is a need for <strong>Council</strong>, in combination with<br />
relevant agencies, to implement the appropriate<br />
scale revision of corridor studies and commence<br />
to implement a proactive, integrated corridor<br />
strategy. This might include refinement and<br />
mapping and ultimately involve restoration/<br />
revegetation and private land conservation<br />
through incentives. Until such time as the key<br />
habitats and corridors program is refined and<br />
updated with a local emphasis and included in<br />
statutory plans, the information referred to in this<br />
indicator would remain advisory only. There is a<br />
clear need to resolve and consider local corridor<br />
planning programs across key areas of the LGA<br />
and for the highest priority corridor links, such as<br />
the Myall <strong>Lakes</strong> to Wallingat link.<br />
<strong>Great</strong> <strong>Lakes</strong> <strong>Council</strong> 2011 State of the Environment Report 73
Table 4.6.12 Identified needs for action regarding threatened species<br />
Identified Need for Action<br />
Work with DECCW to<br />
implement actions in<br />
Relevant Recovery Plans.<br />
Continue to be a lead agency<br />
in the implementation of<br />
the Hawks Nest Tea Gardens<br />
Koala Recovery Plan<br />
Develop and implement a<br />
shire-wide (comprehensive)<br />
Koala Plan of Management to<br />
support Recovery Planning<br />
for this species<br />
Develop and implement<br />
education on threatened<br />
species, populations and<br />
communities<br />
Develop and implement<br />
a program to support<br />
ecological research into<br />
key threatened species and<br />
ecologically endangered<br />
communities in the LGA<br />
Map and conserve the extent<br />
of Endangered Ecological<br />
Communities in the LGA<br />
Recommended key projects<br />
or actions for consideration in<br />
next year’s Management Plan<br />
• Assist in implementation<br />
of Threatened Species<br />
Recovery Plans and Priority<br />
Action Statements<br />
• Assist in implementation<br />
of Threatened Species<br />
Recovery Plans and Priority<br />
Action Statements<br />
• Assist in implementation<br />
of Threatened Species<br />
Recovery Plans and Priority<br />
Action Statements<br />
• Assist in implementation<br />
of Threatened Species<br />
Recovery Plans and Priority<br />
Action Statements<br />
• Biodiversity education<br />
(develop and expand<br />
initiatives)<br />
• Assist in implementation<br />
of Threatened Species<br />
Recovery Plans and Priority<br />
Action Statements<br />
• Assist in implementation<br />
of Threatened Species<br />
Recovery Plans and Priority<br />
Action Statements<br />
Relevant <strong>Council</strong><br />
section<br />
Natural<br />
Systems<br />
Natural<br />
Systems<br />
Natural<br />
Systems<br />
Natural<br />
Systems<br />
Natural<br />
Systems<br />
Natural<br />
Systems<br />
Are there<br />
existing<br />
resources for<br />
action<br />
N<br />
Y<br />
Partial<br />
Partial<br />
N<br />
N<br />
Commence<br />
by/timeframe<br />
Within 2yrs<br />
Ongoing<br />
Within 2yrs<br />
Within 2yrs<br />
Within 2yrs<br />
Within 2yrs<br />
74 <strong>Great</strong> <strong>Lakes</strong> <strong>Council</strong> 2011 State of the Environment Report
5 Waste and toxic hazards<br />
If not disposed of thoughtfully, many of the<br />
substances we use can have a devastating effect<br />
if released into the environment. Water, air and<br />
land pollution results from the release of waste<br />
and toxic hazards into our environment and can<br />
lead to significant site contamination issues.<br />
Legislation relating to a number of dangerous<br />
chemicals and waste products has been gazetted<br />
to reduce the impact of these substances on<br />
human health and the environment. However<br />
we still have some way to go in reducing the<br />
potential of waste and toxic hazards seriously<br />
affecting our natural environment.<br />
5.1 Waste<br />
Introduction<br />
Waste management is an issue for Local<br />
<strong>Government</strong> in relation to both human and<br />
environmental health. Waste disposal methods<br />
have been based on engineered landfill methods,<br />
which are the accepted standard for waste<br />
disposal. However, there has been a shift towards<br />
providing a more sustainable waste management<br />
system that provides incentives to reduce waste,<br />
opportunities to reuse recover or recycle materials<br />
and ways to efficiently dispose of the residual<br />
waste in a satisfactory manner. As such a move<br />
from landfill to integrated waste management<br />
centres has been adopted. This move has<br />
occurred in line with waste management reforms<br />
with the introduction of the Waste Avoidance<br />
and Resource Recovery Act 2000. Reducing waste<br />
through the methods mentioned above not<br />
only conserves raw materials (thus reducing the<br />
environmental impacts of extractive activities<br />
throughout the world), but it also reduces the<br />
need to convert more areas into landfill sites.<br />
<strong>Council</strong>s Waste Management Services section<br />
is responsible for managing four (4) waste<br />
management centres in the LGA at Tuncurry,<br />
Tea Gardens, Bulahdelah and Stroud. Licensing<br />
under the POEO Act (1997) has been issued<br />
for the Tuncurry operation, due to its size,<br />
and as such <strong>Council</strong> has a legal responsibility<br />
to fulfil monitoring obligations, and ensure<br />
environmental protection.<br />
Figure 5.1.1 Recycled material ready for market at the Tuncurry<br />
Waste Management Centre<br />
Monitoring<br />
At each centre the quantity of total waste is<br />
monitored as well as the breakdown of each<br />
waste component including total waste to<br />
landfill, recycling, green waste, kerb-side recycling<br />
and chemical/ hazardous waste. However, as<br />
different units of measure have been used, there<br />
are issues with the compatibility of such data.<br />
Subsequently, for the purpose of this report, data<br />
measured by volume is converted into weight as<br />
per acceptable methods of calculation (EPA land<br />
filling guidelines). Furthermore the total weight<br />
of waste per capita is based on the predicted<br />
population as derived by the 2006 census.<br />
Results<br />
Through the process of routine garbage<br />
collection, recycling initiatives and public use<br />
of <strong>Council</strong>s Waste Management Centres 80,693<br />
tonnes of waste was collected during the<br />
reporting period. A proportion, approximately<br />
31%, goes to landfill with the remaining waste<br />
distributed among <strong>Council</strong>s recycling initiatives.<br />
This includes green waste, scrap metal, general<br />
recycling material including plastic, paper, glass,<br />
metal and materials collected through the kerbside<br />
recycling program.<br />
Waste and<br />
toxic hazards<br />
<strong>Great</strong> <strong>Lakes</strong> <strong>Council</strong> 2011 State of the Environment Report 75
Table 5.1.1 The total amount of waste collected including a break<br />
down of components for recycling.<br />
2009/10 2010/11<br />
Total Waste<br />
56279 80693<br />
(Tonnes)<br />
Total Waste Per Capita<br />
1.4 2<br />
(Tonnes)<br />
Total Waste Land filled 23810 24739<br />
(Tonnes)<br />
Green Waste<br />
9585 9345<br />
(Tonnes)<br />
Scrap Metal Recycling<br />
823 825<br />
(Tonnes)<br />
General Recycling<br />
1888 4917<br />
(Tonnes)<br />
Kerb Side Recycling<br />
3127 4307<br />
(Tonnes)<br />
Clean Fill (Landfilled)<br />
16500 36534<br />
(Estimate in Tonnes)<br />
Reuse Items<br />
91 5.94<br />
(estimate only in Tonnes)<br />
Chemical / Hazardous Waste (Tonnes)<br />
Oil 17 13.04<br />
Batteries 32 8.70<br />
Chemicals 0 0<br />
Source: <strong>Great</strong> <strong>Lakes</strong> <strong>Council</strong><br />
NB: 2774 tonnes of the green waste above is from a new<br />
kerbside green waste collection which commenced in<br />
November 2009<br />
Figure 5.1.2 Concrete crushing (recycling into roadbase) – Tuncurry<br />
waste management centre<br />
Response<br />
The Waste Services section of <strong>Council</strong> has<br />
introduced a number of programs in order to help<br />
reduce waste production in the LGA, including:<br />
• The three bin program (providing three<br />
separate bins to all residents for green waste,<br />
general waste, and recycling)<br />
• The Waste Watchers education program to<br />
local schools<br />
• Promotion and coordination of Keep<br />
Australia Beautiful Day/Clean up Australia<br />
Day/Recycling Week<br />
• Regular bulky waste cleanups<br />
• Development of Reuse, Recycling and Waste<br />
Transfer Stations<br />
• Formulating a Policy and Procedures<br />
Statement on Hazardous Waste receiving and<br />
handling<br />
• Development of shared waste infrastructures<br />
and services with Taree and Gloucester<br />
<strong>Council</strong>s (Minimbah Landfill)<br />
• Trialling of resource recovery options for<br />
materials such as mattresses, building<br />
materials, rechargeable batteries, smoke<br />
detectors, gas bottles and computer towers<br />
• Reprocessing of construction and demolition<br />
waste - concrete, bricks and tiles<br />
• Active member of MidWaste, a partnership<br />
between councils in the Mid North Coast<br />
region, resulting in a number of cost sharing<br />
and improved efficiency outcomes such as<br />
the securing of regional scrap metal and<br />
greenwaste contractors and the Primary<br />
Schools recycling program.<br />
• Greenhouse gas monitoring of Tuncurry<br />
Landfill and capping of landfills to facilitate<br />
the passive oxidisation of methane.<br />
76 <strong>Great</strong> <strong>Lakes</strong> <strong>Council</strong> 2011 State of the Environment Report
Future directions<br />
The disposal of waste is an ongoing issue that<br />
has long term implications for the health of<br />
our natural environment. With continuing<br />
development and increasing affluence, there<br />
will be greater pressure on our landfills and the<br />
natural environment. The implications of this has<br />
long been recognised with a move to developing<br />
more sustainable waste management practices to<br />
minimise the quantity of rubbish and hazardous<br />
materials entering landfills and, in turn, reducing<br />
the impact on the local environment.<br />
The State <strong>Government</strong>’s Waste Avoidance and<br />
Resource Recovery Strategy focuses on turning<br />
unavoidable waste into a valuable resource. This<br />
strategy guides the efforts of State and Local<br />
government agencies, industry and the broader<br />
community in waste prevention and avoidance,<br />
reuse and recycling.<br />
<strong>Great</strong> <strong>Lakes</strong> <strong>Council</strong> is committed to reducing<br />
the quantity of waste that enters our landfill.<br />
Subsequently alternate waste management<br />
methods including recycling and reuse of many<br />
materials is encouraged. <strong>Council</strong> has also put in<br />
place a pricing policy to encourage the separation<br />
and recycling of material that is received at<br />
the waste management centre. However this<br />
is a community wide issue, which requires the<br />
commitment and cooperation of all residents<br />
to ensure the impact we have on the local<br />
environment is minimised when it comes to the<br />
management of our waste.<br />
It is therefore hoped that this indicator will show a<br />
decrease in the quantity of waste that is disposed<br />
of in landfill and a corresponding increase in the<br />
amount or proportion of material that is recycled<br />
and reused.<br />
Table 5.1.2<br />
Identified needs for action regarding waste<br />
Identified Need for Action<br />
Continue to implement<br />
promotional and educational<br />
activities that aim to reduce<br />
waste to landfill.<br />
Continue to expand and<br />
improve waste recovery<br />
options<br />
Work with Environmental<br />
Health and Natural Systems<br />
sections to target reduction<br />
of urban litter, particularly<br />
cigarette butts, plastic bags<br />
and fishing line.<br />
Work with Purchasing Officer<br />
to buy recycled content<br />
products<br />
Management of<br />
environmental hazards<br />
associated with waste<br />
management<br />
Recommended key projects<br />
or actions for consideration in<br />
next year’s Management Plan<br />
Continue and improve waste<br />
education initiatives<br />
Implement Waste Strategy<br />
actions into new contracts<br />
Continue and improve waste<br />
education initiatives<br />
Implement Sustainable<br />
Purchasing Policy<br />
Development of an<br />
Environmental Management<br />
System for the Bulahdelah<br />
Waste Transfer Station<br />
Relevant <strong>Council</strong><br />
section<br />
Are there<br />
existing<br />
resources for<br />
action<br />
Commence<br />
by/timeframe<br />
Waste Services Y Ongoing<br />
Waste Services Y Ongoing<br />
Waste Services Partial Within 2yrs<br />
<strong>Council</strong> wide Y Ongoing<br />
Natural<br />
Systems and<br />
Waste Services<br />
Y With 12<br />
months<br />
<strong>Great</strong> <strong>Lakes</strong> <strong>Council</strong> 2011 State of the Environment Report 77
5.2 Sewage treatment and disposal<br />
Introduction<br />
Inadequate sewage treatment and disposal<br />
can pose a significant threat to public and<br />
environmental health. As such, stringent<br />
regulations in the form of licensing have been<br />
imposed for all effluent management authorities.<br />
Within the <strong>Great</strong> <strong>Lakes</strong>, MidCoast Water manages<br />
the reticulated sewer system in line with<br />
licensing conditions issued by the Department<br />
of Environment, Climate Change and Water. In<br />
the <strong>Great</strong> <strong>Lakes</strong> LGA those living in most towns<br />
and villages (comprising 92% of population)<br />
have access to the centralised sewerage<br />
network with rural and some small village areas<br />
generally relying on individual/ on-site sewage<br />
management methods (e.g. septic systems).<br />
Effluent discharged into the sewer system is<br />
managed at one of five (5) sewage treatment<br />
plants (STP) located at Forster, Hallidays Point,<br />
Stroud, Hawks Nest or Bulahdelah. The Tuncurry<br />
plant has been decommissioned with waste<br />
transferred to Hallidays Point. Old Stroud STP has<br />
been decommissioned and the new STP started<br />
operation in May 2009. The new STP includes 30<br />
ML wet weather storage which allows increasing<br />
effluent re-use by farm irrigation.<br />
Dwellings outside the reticulated sewer network<br />
rely on on-site sewage management systems<br />
(OSMS) as a means of wastewater treatment and<br />
disposal. Various appropriate on-site systems<br />
are available. <strong>Great</strong> <strong>Lakes</strong> <strong>Council</strong> is responsible<br />
for managing OSMS, all of which are required by<br />
legislation to be registered with the <strong>Council</strong>. The<br />
registration process assists <strong>Council</strong> to assess and<br />
manage the impact of OSMS with regard to public<br />
and environmental health.<br />
As an indicator of environmental health, the<br />
monitoring of the number of dwellings connected<br />
to reticulated sewer and the number of on-site<br />
systems provides an indication of pressure placed<br />
on the local environment.<br />
Monitoring<br />
<strong>Council</strong>’s Environmental Health section is able<br />
to provide information in relation to the number<br />
of properties serviced by OSMSs, the type<br />
installed and the number of new on-site systems<br />
registered.<br />
MidCoast Water is the region’s sewage service<br />
provider and as such information is sourced<br />
from this authority in regards to the number<br />
of properties serviced by the sewage system,<br />
the type of connection and the number of new<br />
connections approved in the reporting year.<br />
MidCoast Water carries out a number of<br />
environmental testing programs to monitor the<br />
impact of treated effluent release on the receiving<br />
water environment. This includes the monitoring<br />
of Karuah River, Frys Creek and the Myall River, at<br />
Bulahdelah. Groundwater in the disposal areas<br />
at Hawks Nest, Hallidays Point and Stroud are<br />
also monitored and MCW conducts ecological<br />
assessments through the Forster STP ocean<br />
release study every 5 years. The ocean study<br />
includes flora and fauna in different locations and<br />
bioaccumulation of potential contaminants of<br />
concern in fish and invertebrates.<br />
Environmentally, both OSMS and sewage systems<br />
work effectively if maintained and managed<br />
appropriately. As the reticulated sewer system<br />
is heavily regulated and bound by licensing<br />
agreements, management is relatively effective.<br />
Nevertheless, there are serious risks associated<br />
with spills of untreated effluent or overflows of<br />
sewage from the sewer system. On-site Sewage<br />
Management Systems (OSMS) on the other hand<br />
are privately managed and their regulation and<br />
management is difficult. Neglected OSMS may pose<br />
a threat to the local environment if effluent enters<br />
nearby waterways or seeps into the ground water.<br />
Figure 5.2.1 Sewage treatment at MidCoast Water’s Hallidays Point<br />
sewage treatment plant.<br />
78 <strong>Great</strong> <strong>Lakes</strong> <strong>Council</strong> 2011 State of the Environment Report
Results<br />
In total there are currently 4137 properties<br />
operating registered On-site Sewage<br />
Management Systems. A breakdown of these<br />
systems has been provided in the table below.<br />
Table 5.2.1 Number of properties operating OSMS and the type of<br />
systems installed.<br />
System 09/10 10/11<br />
Aerated Wastewater Treatment 961 965<br />
Systems<br />
On-site Disposal Systems 2043 2045<br />
Pump-out Systems 628 629<br />
Composting Toilets 66 68<br />
Chemical Toilets 39 36<br />
Sanitary Pans 17 17<br />
Pit Toilets 60 61<br />
Mound 81 83<br />
Sand Filter 69 71<br />
Reed Bed 65 66<br />
Biological Filter 32 32<br />
Pump to Sewer 14 14<br />
Commercial Treatment Plant 8 7<br />
Other Systems 25 43<br />
totaL 4108 4137<br />
Table 5.2.2<br />
Number of new OSMSs installation approvals<br />
Number of new installation approvals:<br />
38<br />
Source: <strong>Great</strong> <strong>Lakes</strong> <strong>Council</strong><br />
For the reporting period 38 new systems have<br />
been approved for installation.<br />
For the reporting period 16 528 properties were<br />
connected to the reticulated sewage system, 99<br />
of these were new connections. The total volume<br />
of wastewater collected in <strong>Great</strong> <strong>Lakes</strong> sewerage<br />
system during was 3540 million litres.<br />
Table 5.2.3<br />
collected<br />
Connections to reticulated sewer and waste water<br />
09/10 10/11<br />
Number of properties connected 16429 16528<br />
to reticulated sewage system<br />
Number of new connections 88 99<br />
Total volume of waste water<br />
collected (million litres)<br />
3426 3540<br />
Source: MidCoast Water<br />
Summary<br />
Due to financial and environmental limitations it<br />
is not feasible to connect all properties within the<br />
<strong>Great</strong> <strong>Lakes</strong> LGA to the reticulated sewer system.<br />
Therefore a proportion of property owners have<br />
to utilise On-site Sewage Management Systems to<br />
treat their sewage.<br />
However OSMS’s are often difficult to regulate, so<br />
it is harder to ensure environmental safety from<br />
overflows and leaks. Hopefully over time, SoE<br />
reporting will indicate an increase in the number<br />
of properties connected to the sewage network<br />
and a reduction in the number of properties<br />
utilising OSMS’s.<br />
Current Response and future<br />
directions<br />
<strong>Great</strong> <strong>Lakes</strong> <strong>Council</strong> inspects a minimum of 500<br />
on-site systems per year to ensure they meet<br />
environmental and health requirements.<br />
Midcoast water undertakes various projects to<br />
improve sewage treatment in the LGA. While no<br />
developments have occurred within the reporting<br />
year, projects aimed at improving sewage<br />
treatment will continue in future years.<br />
<strong>Great</strong> <strong>Lakes</strong> <strong>Council</strong> 2011 State of the Environment Report 79
5.3 Toxic spills<br />
Introduction<br />
Toxic spills are usually random, one-off incidents<br />
that have the potential to cause great pressure<br />
on the <strong>Great</strong> <strong>Lakes</strong> environment. For example,<br />
toxic spills could result from sewage overflows,<br />
serious truck crashes or other contamination<br />
events. All toxic spills have an impact on the<br />
natural environment. The extent of this damage<br />
is determined by the substance(s) released, their<br />
amount and the location/ extent of the spill,<br />
especially its proximity to sensitive environmental<br />
features.<br />
Monitoring<br />
The <strong>NSW</strong> Fire Brigade and Rural Fire Service<br />
usually respond to incident-based toxic spill<br />
events and the <strong>NSW</strong> Fire Brigade maintains<br />
records on the incidents responded to. Further,<br />
DECCW, the Environmental Protection Authority,<br />
and <strong>Council</strong>’s Environmental Services section<br />
respond and manage toxic spill events in this LGA.<br />
Results<br />
The <strong>NSW</strong> Fire Brigade are responsible for<br />
maintaining records on toxic spills.<br />
For the last two reporting periods their records<br />
are as follows:<br />
Table 5.3.1<br />
Number and Type of spills in LGA<br />
Type and Number 2009/10 2010/11<br />
Combustible spills 0 0<br />
Heat related 0 0<br />
Other hazardous materials 0 0<br />
Miscellaneous hazardous 0 0<br />
Aircraft incidents 0 0<br />
Other 0 0<br />
Total 0 0<br />
Source: <strong>NSW</strong> Fire Brigade<br />
The information on Table 5.3.2 represents<br />
pollution incidents reported to the DECCW/EPA<br />
where the EPA is the Appropriate Regulatory<br />
Authority (ARA) for the incident. Generally <strong>Council</strong><br />
will not have a role in managing or responding<br />
to these reports but the data indicates what<br />
incidents have occurred in the LGA.<br />
Table 5.3.2<br />
the ARA<br />
Number and Type of spills in LGA where DECCW/EPA is<br />
Type and Number 2009/2010 2010/2011<br />
Air 14 6<br />
Chemicals 2 4<br />
Threatened Species 3 1<br />
NatVeg 11 16<br />
Contaminated Land 1 0<br />
Noise 33 27<br />
Pesticides 3 1<br />
Water 6 10<br />
Total 73 65<br />
The information on Table 5.3.3 represents calls<br />
made by <strong>Great</strong> <strong>Lakes</strong> residents direct to the DECCW<br />
Environment Line where some form of pollution or<br />
environmental issue was occurring. In these cases,<br />
after an initial assessment by Environment Line, it<br />
was determined that <strong>Great</strong> <strong>Lakes</strong> <strong>Council</strong> was the<br />
ARA and the caller was referred and/or transferred<br />
back to <strong>Council</strong> for further action or investigation.<br />
Table 5.3.3<br />
DECCW<br />
Number and Type of spills in LGA referred to GLC from<br />
Type and Number 2009/2010 2010/2011<br />
Air 2 1<br />
Corporate 1 15<br />
Noise 1 4<br />
Water 1 13<br />
Total 5 33<br />
The data from the <strong>NSW</strong> Fire Brigade and DECCW<br />
does not give an indication of the nature or<br />
seriousness of the substance(s) spilled.<br />
Summary<br />
It is important that all toxic spills are recorded<br />
and that <strong>Council</strong> is satisfied that all responses to<br />
such incidents are appropriate and effective. It is<br />
particularly important that a means to identify if<br />
there is an area of high risk or recurrence of spills<br />
is implemented such that toxic spill blackspots<br />
can be identified and appropriately managed.<br />
80 <strong>Great</strong> <strong>Lakes</strong> <strong>Council</strong> 2011 State of the Environment Report
6 Land<br />
The way we plan and construct our built<br />
landscape has a direct impact on the health<br />
and function of our natural environment.<br />
Development in response to the demands of<br />
the increasing population remains one of the<br />
largest impacts on the <strong>Great</strong> <strong>Lakes</strong> LGA. Unless<br />
this development is planned in a sustainable<br />
and environmentally appropriate manner and<br />
includes the provision for open space, nature<br />
reserves, biodiversity, etc the very aesthetics and<br />
charm of the <strong>Great</strong> <strong>Lakes</strong> will be irreversibly lost.<br />
6.1 Development<br />
pressures<br />
Introduction<br />
Development provides for much needed<br />
growth in urban populations and employment<br />
and provides for increasing affluence and<br />
socio-economic growth over time. However,<br />
inappropriate development in environmentally<br />
sensitive areas can have detrimental and serious<br />
effects on the environment on which we all rely.<br />
Over-development can also have cumulative<br />
environmental impacts that may be less obvious<br />
but equally serious. There is a clear need for<br />
development to be sustainable and within the<br />
thresholds imposed by social, physical and<br />
environmental conditions. Consequently, <strong>Council</strong><br />
has significant responsibilities to carefully manage<br />
and provide for growth and development in a<br />
sustainable and responsible manner.<br />
This SoE recognises that development can<br />
impact on the environment negatively. While<br />
it is not a direct indication of specific and<br />
measurable environmental impact, the number<br />
of development applications approved within<br />
the LGA does provide a measure of the amount<br />
Figure 6.3.1 An example of development<br />
within the <strong>Great</strong> <strong>Lakes</strong> region.<br />
of development pressures with which the<br />
LGA is being subjected to. For example, heavy<br />
development pressures are associated with<br />
increased demand for urban land and subdivision,<br />
which may in turn increase clearing pressures and<br />
affects on waterways through increased pollution.<br />
As well as describing the annual trends associated<br />
with the number of Development Approvals<br />
within the LGA, this indicator describes trends<br />
in relation to how many of these Development<br />
Applications involve the consideration of<br />
environmental factors, i.e. how many DAs have<br />
the potential to exert significant pressures on the<br />
environment.<br />
Monitoring<br />
Data pertaining to the number and type of<br />
activities consented to through development<br />
approvals is collected and maintained by <strong>Council</strong>’s<br />
Planning and Environmental Services division.<br />
When development activities are likely to require<br />
consideration of environment factors they are<br />
referred to the Natural Systems section, where<br />
data on the nature and scope of environmental<br />
impacts is collected and is included in this SoE.<br />
This indicator also considers the changes to<br />
planning zones made during the year in relation<br />
to area (ie. rural to environmental protection). This<br />
information is collected by the Strategic Planning<br />
section.<br />
Results<br />
For the 2010/11 reporting period <strong>Great</strong> <strong>Lakes</strong><br />
<strong>Council</strong> received 590 development applications<br />
and processed 506 construction certificates.<br />
Table 6.1.1 Number of Development Applications and<br />
Construction Certificates received.<br />
Year<br />
Number of<br />
Development<br />
Applications<br />
Number of<br />
Construction<br />
Certificates<br />
09/10 601 563<br />
10/11 590 506<br />
57 DA’s were referred to <strong>Council</strong>’s Natural Systems<br />
and Estuaries section pertaining to environmental<br />
matters. From these referrals, the following data<br />
has been collated:<br />
Land<br />
<strong>Great</strong> <strong>Lakes</strong> <strong>Council</strong> 2011 State of the Environment Report 81
Table 6.1.2 Number of DAs referred to <strong>Council</strong>’s Natural Systems<br />
Section on Ecological Grounds<br />
No. of DA Referrals to Natural Systems<br />
on Ecological Grounds<br />
Location 09/10 10/11<br />
Bombah Point 1 0<br />
Boolambayte 0 0<br />
Booral 2 4<br />
Bulahdelah 7 0<br />
Bundabah 1 0<br />
Bungwahl 1 0<br />
Bunyah 0 1<br />
Carrington 0 0<br />
Coolongolook 2 5<br />
Coomba Park 2 0<br />
Darawank 1 1<br />
Duralie 0 0<br />
Failford 8 7<br />
Forster 4 2<br />
Girvan 0 0<br />
Green Point 0 0<br />
Hawks Nest 0 5<br />
Karuah 0 0<br />
Limeburners 3 0<br />
Markwell 1 1<br />
Mayers Flat 2 0<br />
Minimbah 0 1<br />
Monkerai 0 1<br />
Nabiac 1 1<br />
Nerong 0 1<br />
Nooroo 1 0<br />
North Arm Cove 2 2<br />
Pacific Palms 3 3<br />
Pindimar 0 2<br />
Seal Rocks 0 0<br />
Smiths Lake 4 4<br />
Stroud 1 1<br />
Stroud Road 0 1<br />
Tarbuck Park 0 0<br />
Tea Gardens 3 4<br />
The Branch 1 0<br />
Tiona 0 0<br />
Topi Topi 0 1<br />
Tuncurry 2 4<br />
Upper Karuah River 1 0<br />
Upper Myall 0 0<br />
Wallingat 1 1<br />
Wallis Island 0 0<br />
Wallis Lake 1 0<br />
Wards River 2 2<br />
Warranulla 0 1<br />
Washpool 1 0<br />
Weismantels 0 0<br />
Whoota 0 1<br />
Wootton 1 0<br />
Total 60 57<br />
Table 6.1.3 Type of Development referrals to the Natural Systems<br />
section on Ecological Grounds<br />
No of DA Referrals to Natural Systems<br />
on Ecological Grounds<br />
Development Type 09/10 10/11<br />
Aged Care 0 1<br />
Agriculture 0 0<br />
Aquaculture 0 0<br />
Boat Ramp/ Jetty 2 1<br />
Boundary Adjustment 1 2<br />
Building Envelope 0 1<br />
Bulk earthworks/ filling of land 0 2<br />
Carpark 0 0<br />
Commercial Development 2 3<br />
Dredging 3 0<br />
Driveway/ Road 1 0<br />
Extensions/ additions 0 2<br />
Fence 0 0<br />
Industrial Development 0 0<br />
Landscaping/ Landscape Mound 0 0<br />
Mining/ Extraction 0 0<br />
Multiple dwellings 1 1<br />
Place of Worship 0 0<br />
Poultry/ Turkey Shed 1 2<br />
Public Events/ Recreation 1 3<br />
Retaining Wall 1 1<br />
Rural Land-sharing<br />
0 1<br />
Development<br />
Sheds/ Garages 1 0<br />
Single dwelling - residential 24 5<br />
zone<br />
Single dwelling - rural<br />
6<br />
residential zone<br />
Single dwelling - rural zone 12<br />
Single dwelling - conservation<br />
1<br />
zone<br />
Subdivision - residential 5 7<br />
(14:36 lots)<br />
Subdivision - rural residential 2<br />
(2:63 lots)<br />
Subdivision - rural 12 3<br />
(8:7 lots)<br />
Swimming Pool 0 0<br />
Tall Building 0 0<br />
Telecommunications 1 0<br />
Tourist Development 2 1<br />
Waste Facilities 2 0<br />
Total 60 57<br />
82 <strong>Great</strong> <strong>Lakes</strong> <strong>Council</strong> 2011 State of the Environment Report
Table 6.1.4 Ecological reporting and outcomes for DAs referred to<br />
Natural Systems<br />
Ecological Reporting<br />
and outcomes 09/10 10/11<br />
No/ Percentage of DA’s<br />
requiring no specific<br />
ecological reporting<br />
No/ Percentage of DA’s<br />
requiring/ provided<br />
with an Assessment of<br />
Significance<br />
No/ Percentage of DA’s<br />
requiring an SIS<br />
No/ Percentage of DA’s<br />
requiring an EIS<br />
No/ Percentage of<br />
DA’s approved with no<br />
ecological conditions<br />
No/ Percentage of<br />
DA’s approved subject<br />
to specified ecological<br />
conditions<br />
No/ Percentage of DA’s<br />
where assessment was<br />
deferred pending the<br />
provision of additional<br />
information<br />
No/ Percentage of DA’s<br />
recommended for<br />
refusal by the Natural<br />
Systems Branch on<br />
ecological grounds<br />
No of DA’s assessed<br />
as State Significant<br />
Developments<br />
No of DA’s assessed<br />
in the <strong>NSW</strong> Land and<br />
Environment Court<br />
49<br />
(81.7%)<br />
10<br />
(16.7%)<br />
0<br />
(0%)<br />
1<br />
(1.7%)<br />
1<br />
(1.7%)<br />
54<br />
(90.0%)<br />
2<br />
(3.3%)<br />
3<br />
(5.0%)<br />
43<br />
(75.4%)<br />
14<br />
(24.6%)<br />
0<br />
(0.0%)<br />
0<br />
(0.0%)<br />
3<br />
(5.3%)<br />
53<br />
(93.0%)<br />
0<br />
(0.0%)<br />
1<br />
(1.8%)<br />
2 1 0<br />
2 2 0<br />
Table 6.1.5<br />
Referred DAs relating to Threatened Species<br />
Threatened Species 09/10 10/11<br />
No/ Percentage of DA’s<br />
involving land known or<br />
found to contain habitat of<br />
an endangered ecological<br />
community<br />
No/ Percentage of DA’s<br />
involving land known or<br />
found to contain the habitat<br />
of an endangered population<br />
No/ Percentage of DA’s<br />
involving land known or<br />
found to contain threatened<br />
flora or fauna species<br />
8<br />
(13.3%)<br />
0<br />
(0%)<br />
11<br />
(18.3%)<br />
2<br />
(3.5%)<br />
2<br />
(3.5%)<br />
15<br />
(26.3%)<br />
No of DA’s where the following species, populations or<br />
communities were detected:<br />
Asperula asthenes 0 1<br />
Lindernia alsinoides 1 0<br />
Syzygium paniculatum 0 0<br />
Brush-tailed Phascogale 0 1<br />
Koala 1 4<br />
Yellow-bellied Glider 0 0<br />
Squirrel Glider 2 5<br />
Grey-headed Flying Fox 1 4<br />
Eastern Blossom Bat 0 0<br />
Yellow-bellied Sheathtail Bat 0 0<br />
Eastern Freetail Bat 1 0<br />
Eastern False Pipistrelle 0 1<br />
<strong>Great</strong>er Broad-nosed Bat 0 3<br />
Little Bent-wing Bat 3 2<br />
Eastern Bent-wing Bat 2 0<br />
Southern Myotis 1 0<br />
Eastern Cave Bat 2 0<br />
Wallum Froglet 0 3<br />
Osprey 0 0<br />
Pied Oystercatcher 1 0<br />
Glossy Black Cockatoo 5 1<br />
Powerful Owl 0 0<br />
Barking Owl 1 0<br />
Masked Owl 1 0<br />
Grass Owl 0 0<br />
Subtropical Coastal<br />
0 1<br />
Floodplain Forest EEC<br />
Swamp Oak EEC 3 0<br />
Swamp Sclerophyll Forest EEC 1 1<br />
Saltmarsh EEC 1 2<br />
Littoral Rainforest EEC 1 0<br />
Lowland Rainforest EEC 3 0<br />
Themeda Grassland EEC 0 0<br />
<strong>Great</strong> <strong>Lakes</strong> <strong>Council</strong> 2011 State of the Environment Report 83
The following table gives an indication of the<br />
area of land occurring within each zoning in the<br />
<strong>Great</strong> <strong>Lakes</strong> LGA. These zones determine what<br />
developments can and cannot take place in<br />
certain areas and represent an important method<br />
of strategic planning. Over time, reporting this<br />
information will indicate the growth or decline<br />
of important zones such as 7a1 Environmental<br />
Protection. Please note that some figures recorded<br />
may appear inaccurate as they have been sourced<br />
from planning documents that have not been<br />
progressively updated to reflect changes in tenure<br />
(for example, the area of National Parks is known to<br />
be larger than the area represented in zone 8 and<br />
the area of Open Space reported in Section 6.2 is<br />
greater than the area represented in zone 6a).<br />
Table 6.1.6<br />
Planning Zone<br />
Area of land contained in each zone<br />
Area (ha) in<br />
each zone<br />
2009/10<br />
Area (ha) in<br />
each zone<br />
2010/11<br />
1(a) Rural 194,711 194,500.23<br />
1(c) Future Urban<br />
2,139 1956.65<br />
Investigation<br />
1(d) Small Holdings 1,372 1471.61<br />
1(d1) Rural Residential 107 128.008<br />
1(f) Forestry 78,357 78357.23<br />
2 Village 1,263 1263.18<br />
2(a) Low Density<br />
970 1052.41<br />
Residential<br />
2(b) Medium Density<br />
150 151.871<br />
Residential<br />
2(c) High Density<br />
38 37.515<br />
Residential<br />
2(f) Mixed Residential- 206 205.526<br />
Commercial<br />
2(g) Environmental<br />
34 34.432<br />
living/ low impact<br />
development<br />
3(a) General Business 35 35.163<br />
3(d) Special Business<br />
6 6.286<br />
Waterfront<br />
4(a) General Industrial 83 94.119<br />
5(a) Special Uses 215 212.071<br />
5(c) Local Road<br />
4 9.235<br />
Reservation<br />
5(d) Arterial Road<br />
- -<br />
Reservation<br />
6(a) Open Space 567 576.151<br />
7(a) Wetlands &<br />
2,403 2314.31<br />
Littoral Rainforest<br />
7(a1) Environmental 1,010 1264.96<br />
Protection<br />
7(b) Conservation 6,599 6599.48<br />
7(c) Scenic Protection 1,857 1857.46<br />
7(f1) Coastal Lands<br />
557 557.054<br />
Protection<br />
7(f2) Coastal Lands<br />
63 62.938<br />
Acquisition<br />
8(a) National Parks & 34,507 34506.91<br />
State Recreation<br />
8(b) National Parks &<br />
State Recreation Areas<br />
191 191.053<br />
Restricted Access – 1.287 ha<br />
B6 – 3.247 ha<br />
MLEP – 1,183.06 ha<br />
Figure 6.1.1 Development can mean the loss of important habitat<br />
for fauna<br />
84 <strong>Great</strong> <strong>Lakes</strong> <strong>Council</strong> 2011 State of the Environment Report
Table 6.1.7<br />
Project<br />
LEP No. 27<br />
& 50<br />
Strategic Plans in Progress<br />
Location<br />
North Hawks<br />
Nest<br />
Area of land<br />
rezoned from 1<br />
(c)* or unspecified<br />
to Environment<br />
Protection (ha)<br />
Area of land<br />
rezoned from 1<br />
(c)* or unspecified<br />
to Residential/<br />
Rural Residential/<br />
Industrial etc (ha)<br />
Status<br />
500 90 Draft LEP adopted by <strong>Council</strong>. Awaiting<br />
VPA signoff before submitting to<br />
Minister to be made.<br />
350 17 LEP (Stage 2), VPA and DCP currently<br />
being prepared.<br />
6.7 21 Draft LEP and DCP adopted by <strong>Council</strong><br />
awaiting finalisation of VPA<br />
33 9 Draft LEP adopted by <strong>Council</strong> awaiting<br />
finalisation of VPA and DCP<br />
LEP No. 13 Pacific Palms<br />
-Stage 2<br />
LEP No. 52 Carmona<br />
Drive<br />
LEP No. 72 Tropic<br />
Gardens<br />
Drive<br />
LEP No. 70 North 48 74 Pending gazettal. VPA to be finalised<br />
Shearwater<br />
and exhibited.<br />
LEP No. 23 Myall River Not yet<br />
Not yet<br />
Planning Proposal being prepared<br />
Downs determined determined<br />
LEP No. 73 Fairview West 0 21 Draft LEP adopted by <strong>Council</strong> awaiting<br />
finalisation of VPA<br />
LEP No. 46 Follyfoot 7 21 Pending gazettal<br />
Farm<br />
LEP No. 74 Bulahdelah Not yet<br />
Not yet<br />
Planning Proposal currently being<br />
determined determined prepared<br />
* 1(c) - Future Urban Investigation<br />
LEP = Local Environmental Plan,<br />
LES = Local Environmental Study<br />
VPA = Voluntary Planning Agreement<br />
<strong>Great</strong> <strong>Lakes</strong> <strong>Council</strong> 2011 State of the Environment Report 85
Response<br />
<strong>Council</strong> currently has a number of strategic plans<br />
in place to manage development. Strategic<br />
landuse planning is the forward planning which<br />
provides an overall sense of direction and a<br />
context for detailed decisions that councils and<br />
state agencies make in relation to future land use<br />
and service provision. A strategic plan outlines a<br />
vision for the future development of a region or<br />
locality and a strategy to achieve it.<br />
Strategic planning can be done for part of, or<br />
the entire local government area (LGA). Strategic<br />
plans sit at the top of the planning hierarchy<br />
and set the overall “big-picture” with consistent<br />
aims, objectives and guiding principles. Local<br />
Environmental Plans (LEP) allows the strategic<br />
plans to be implemented by setting rules for<br />
the development of specified land. Finally,<br />
Development Control Plans (DCP) outline the<br />
detailed development outcomes of subject areas.<br />
Summary and future<br />
directions<br />
Inappropriate development is a key threat to the<br />
health of our local environment and needs to be<br />
monitored carefully. There is an identified need to<br />
establish a small working group and re-formulate<br />
internal <strong>Council</strong> reporting and data management<br />
procedures so that development statistics are<br />
accurately reportable. There is also a need to<br />
formulate a clear process and procedure to ensure<br />
that all developments that concern environmental<br />
factors are given adequate consideration by the<br />
appropriate environmental staff in council.<br />
More detailed information on Strategic Plans<br />
and Local Environmental Plans is available from<br />
<strong>Council</strong> Offices and <strong>Council</strong>’s website.<br />
Table 6.1.8<br />
Identified needs for action regarding land development<br />
Identified Need for Action<br />
Develop and implement<br />
a policy for ecological<br />
considerations in<br />
development assessment<br />
planning that includes<br />
standard survey and<br />
assessment guidelines,<br />
standard ecological<br />
conditions and codes<br />
of practice/ design<br />
considerations for pertinent<br />
ecological features<br />
Recommended key projects<br />
or actions for consideration in<br />
next year’s Management Plan<br />
Develop a policy/<br />
direction for Development<br />
Assessment advice<br />
Relevant <strong>Council</strong><br />
section<br />
Natural<br />
Systems<br />
Are there<br />
existing<br />
resources for<br />
action<br />
N<br />
Commence<br />
by/timeframe<br />
Ongoing<br />
86 <strong>Great</strong> <strong>Lakes</strong> <strong>Council</strong> 2011 State of the Environment Report
6.2 Open space<br />
Introduction<br />
<strong>Council</strong>, as part of its ongoing commitment to<br />
provide appropriate and effective sport and<br />
recreation opportunities, currently manages an<br />
array of reserves that make up the open space<br />
network. This network includes land categorised<br />
into sports fields, parks, bushland, and reserve.<br />
Each have a specific purpose and the basis of<br />
supply is underpinned by community need,<br />
access to opportunities and a general ratio<br />
per population. Each of these qualifiers can<br />
not be used in isolation, however, combined<br />
make a powerful strategic tool in identifying<br />
the requirements of the existing and future<br />
population.<br />
Monitoring and results<br />
The cataloguing of these opportunities, and<br />
the needs assessed from a gap analysis, are<br />
contained in the Recreation Open Space Strategy<br />
Plan (2006). That plan highlighted the current<br />
population has 746ha of land offered in various<br />
forms to meet the recreation, social and cultural<br />
needs of the community. There are also significant<br />
stretches of natural areas including foreshores<br />
that ensure the ecological sustainability of<br />
vulnerable areas is maintained. The data collected<br />
in the recreation strategy suggests that there is<br />
currently 22ha per 1000 people.<br />
Summary and future<br />
directions<br />
Recognising both assessment tools need to be<br />
updated the Recreation Open Space Strategy Plan<br />
is scheduled for review in 2011/2012. This will<br />
identify what previously determined needs have<br />
been fulfilled and what still require addressing.<br />
This will be a continuing process as community<br />
needs change over time and the provision of<br />
quality open space is essential in assisting with<br />
community well being.<br />
Figure 6.2.1 Our LGL contains 22 ha of public open space per<br />
1000 people.<br />
As mentioned, the provision of open space<br />
purely on a ratio basis is not guaranteed to meet<br />
demand. It should be underpinned by additional<br />
user analysis. In 2009, council finalised the<br />
findings of its comprehensive community survey.<br />
The results of which showed the communities<br />
opinion on the importance of Parks and Reserves<br />
was “Highly” and the current provision as being<br />
“Satisfactory”.<br />
<strong>Great</strong> <strong>Lakes</strong> <strong>Council</strong> 2011 State of the Environment Report 87
6.3 Roads<br />
Introduction<br />
The construction and use of roads, even when<br />
sensitively designed, can significantly impact on<br />
the local environment. A number of issues which<br />
may arise due to road development include:<br />
• Chemical and noise pollution<br />
• Fragmentation of wildlife habitat<br />
• The formation of barriers to wildlife<br />
movement and dispersal<br />
• Mortality of wildlife through collisions with<br />
vehicles<br />
• Impact on the aesthetic value of an area<br />
• Pollution issues during construction and use<br />
• Vegetation removal<br />
• Degradation of natural patterns and<br />
processes eg. erosion<br />
• The spread of weeds and feral pests<br />
As such, where possible the construction of<br />
roads should be minimised and where road<br />
development is essential, all of the above issues<br />
need to be considered and resolved to ensure<br />
minimal impact on the local environment.<br />
Monitoring<br />
Records are available within the Transport Assets<br />
section of <strong>Council</strong>’s Engineering Division, on an<br />
annual basis, in relation to the total length and<br />
area of urban, rural and regional roads that are<br />
maintained by <strong>Council</strong>. This data also provides a<br />
record on the proportion of unsealed and sealed<br />
roads in the LGA.<br />
The intent of this indicator is to monitor the<br />
construction and quality of roads within urban,<br />
rural and regional areas of the LGA.<br />
Results<br />
In total the <strong>Great</strong> <strong>Lakes</strong> LGA contains 1,119 km of<br />
council controlled roads. Table 6.3.1 identifies the<br />
proportion of the road network that is unsealed.<br />
Table 6.3.1 Total length and area of <strong>Council</strong> maintained roads and<br />
proportion of unsealed roads.<br />
09/10 10/11<br />
Urban Road Length (km) 260 262<br />
Proportion Unsealed of 6.5% 6.9%<br />
Urban Road Length<br />
Rural Road Length (km) 698 699<br />
Proportion Unsealed of 63.9 66.6<br />
Rural Road Length)<br />
Regional Road Length<br />
136 136<br />
(km)<br />
Proportion Unsealed of<br />
0% 0%<br />
Regional Road Length)<br />
Total Road Length (km) 1116 1119<br />
Total Proportion of<br />
41.6% 41.4%<br />
unsealed length<br />
Total Road Area (m2) 7,193,664 7,210,303<br />
Total Proportion of<br />
Unsealed Area<br />
32.5% 32.4%<br />
Source: <strong>Great</strong> <strong>Lakes</strong> <strong>Council</strong>.<br />
Please note: road network was remeasured in 2005.<br />
Summary<br />
Sealed roads occupy the majority of the total<br />
<strong>Council</strong> controlled road network in relation<br />
to both total road length and total road area.<br />
However a significant length of unsealed roads is<br />
present in this LGA, particularly in rural areas.<br />
88 <strong>Great</strong> <strong>Lakes</strong> <strong>Council</strong> 2011 State of the Environment Report
Response and future directions<br />
<strong>Council</strong> is aware of the environmental impacts<br />
of roads, in particular the impacts of unsealed<br />
roads (for example erosion and sedimentation of<br />
waterways and drainage lines). <strong>Council</strong> currently<br />
has a rolling program in place to seal all urban<br />
unsealed roads over a twenty year period from<br />
1998. This is part of the Urban Road Construction<br />
Program.<br />
The Rural Road Construction Program was<br />
deferred for the 20010/11 reporting year. Road<br />
sealing of the approaches to Old Inn Road<br />
crossing and Wild Cattle Creek were completed in<br />
the previous reporting period as result of acquired<br />
funding. The following is the priority list when the<br />
program recommences:<br />
• Bundabah Road<br />
• Seal Rocks Road<br />
• Bombah Point Road<br />
• Wattley Hill Road<br />
• The Branch Lane<br />
• Willina Road<br />
Figure 6.3.1 Roads, such as the Pacific highway, greatly damage<br />
and fragment habitat<br />
Table 6.3.2<br />
Identified needs for action regarding roads<br />
Identified Need for Action<br />
Develop plans and<br />
procedures for managing<br />
and reducing environmental<br />
impacts during road<br />
maintenance (Roadside<br />
environmental management<br />
plans/strategies).<br />
Reduce sediment and<br />
erosion impacts from road<br />
construction<br />
Recommended key projects<br />
or actions for consideration in<br />
next year’s Management Plan<br />
Roadside Environmental<br />
Management Plan (progress<br />
development)<br />
Implement and monitor<br />
erosion and sediment<br />
control management system<br />
for road construction<br />
Relevant <strong>Council</strong><br />
section<br />
Engineering<br />
Services<br />
Natural<br />
systems and<br />
Engineering<br />
Services<br />
Are there<br />
existing<br />
resources for<br />
action<br />
Y<br />
Y<br />
Commence<br />
by/timeframe<br />
Ongoing<br />
Ongoing<br />
<strong>Great</strong> <strong>Lakes</strong> <strong>Council</strong> 2011 State of the Environment Report 89
7 Air<br />
The quality of the air we breathe has always<br />
been a contentious issue in Australia. Through<br />
a deterioration of air quality, the health of<br />
the community can be compromised and the<br />
sustainability of our lifestyles and economies can<br />
be negatively impacted.<br />
Air quality within the <strong>Great</strong> <strong>Lakes</strong> is comparatively<br />
good due to the area’s low population base and<br />
minimal industrial operations. However, residents<br />
of the <strong>Great</strong> <strong>Lakes</strong> contribute to the overall<br />
deterioration of the world’s atmosphere through<br />
the electricity we use, the cars we drive, the wood<br />
we burn in our heaters, etc. Of great concern is<br />
climate change and the amount of carbon we<br />
contribute to the atmosphere. The predicted<br />
effects of global warming would have a significant<br />
impact on our infrastructure, the environment<br />
and our lifestyles. This would be due to the<br />
predicted occurrences of sea level rise and altered<br />
climate (increased storms, etc).<br />
Introduction<br />
Burning fossil fuels such as coal for the generation<br />
of electricity has been identified as a major<br />
contributor to global warming. During the<br />
generation process carbon dioxide, a greenhouse<br />
gas is emitted. Naturally carbon dioxide is an<br />
essential part of the atmosphere. However in<br />
excessive amounts carbon dioxide can overheat<br />
the earth. This warming has the potential to<br />
drastically alter natural systems to the point<br />
where plant and animal species are unable to<br />
adapt to the new conditions and may die out.<br />
There is also the risk that melting polar ice caps<br />
will cause higher sea levels that could greatly<br />
impact on coastal regions such as the <strong>Great</strong> <strong>Lakes</strong>.<br />
Figure 7.1<br />
Car exhaust emits pollution into the atmosphere.<br />
7.1 Electricity usage and green house gas<br />
emissions<br />
Monitoring<br />
Overall greenhouse gas emission from electricity<br />
usage within the <strong>Great</strong> <strong>Lakes</strong> is relatively low<br />
due to our small population size. Information in<br />
relation to energy sources, usage and emission of<br />
greenhouse gas within domestic and commercial<br />
premises is available from the regional electricity<br />
authority, Country Energy.<br />
Results<br />
The table below shows the breakdown of energy<br />
consumption in the <strong>Great</strong> <strong>Lakes</strong> LGA.<br />
Due to the impact of energy generation on the<br />
environment and the non renewable nature of<br />
fossil fuels, renewable sources of energy such as<br />
wind, tidal and solar power are being investigated<br />
globally. Until such time as alternate sources of<br />
energy become widely available it is essential that<br />
energy use be kept to a minimum to reduce the<br />
effect of carbon dioxide on the environment.<br />
Figure 7.1.1 Burning fossil fuels for electricity contributes to global<br />
warming<br />
90 <strong>Great</strong> <strong>Lakes</strong> <strong>Council</strong> 2011 State of the Environment Report
Table 7.1.1<br />
Energy consumption for <strong>Great</strong> <strong>Lakes</strong> LGA<br />
Year 2005/06 2006/07 2007/08 2008/09 2009/10 2010/11<br />
Residential energy usage (MWhs) 128,385 112,930 119,447.60 121,225 115,209 120,618<br />
Commercial energy usage (MWhs) 81,334 93,804 83,340.20 82,618 79,682 79,025<br />
Total MWh’s 209,719 206,734 202,787.80 203,843 194,891 199,643<br />
Residential CO2 produced (tonnes) 135,318 111,236 127,092.20 128,498 122,698 129,061<br />
Commercial CO2 produced (tonnes) 85,726 92,397 88,674.00 87,575 84,861 84,557<br />
Total CO2 tonnes 221,044 203,632 215,766.20 216,073 207,558 213,618<br />
Source: Country Energy<br />
The table above shows the <strong>Great</strong> <strong>Lakes</strong> LGA used<br />
199,643 Mega Watt hours of electricity over the<br />
reporting period and produced 213,618 tonnes of<br />
carbon dioxide by using this electricity.<br />
The <strong>Great</strong> <strong>Lakes</strong> LGA has an approximate growth<br />
rate of 1.33% per annum. While total carbon<br />
emissions have increased slightly over recent<br />
years, total CO2 emissions per head of population<br />
have reduced (see below).<br />
Tonnes of CO 2<br />
per<br />
head of population<br />
6.80<br />
6.60<br />
6.40<br />
6.20<br />
6.00<br />
5.80<br />
5.60<br />
5.40<br />
5.20<br />
2005/06 2009/10 2010/11<br />
Figure 7.1.2 Carbon emissions per head of population for <strong>Great</strong><br />
<strong>Lakes</strong> LGA<br />
Response and future directions<br />
There is growing evidence indicating that<br />
coal powered electricity is unsustainable<br />
and detrimentally effects our environment,<br />
particularly through global warming and climate<br />
change. All sectors of society need to take action<br />
to reduce unsustainable electricity consumption<br />
including residents, business and government.<br />
During the reporting period, and in line with<br />
the previous recommendation from last years<br />
SoE report, energy audits have been conducted<br />
at major council buildings and GLC is currently<br />
monitoring all of its electricity and water<br />
consuming assets through the Planet Footprint<br />
Environmental Scorekeeping service. The results<br />
of this will feed into the development of policy<br />
for all of council and assist the development of<br />
key-performance indicators for the sustainability<br />
of council’s operations into the future.<br />
Air<br />
Table 7.1.2<br />
Identified needs for action regarding electricity usage and green house gas emissions<br />
Identified Need for Action<br />
Develop indicators to include<br />
greenhouse emissions from<br />
other sources eg. Car use,<br />
food production.<br />
Attempt to formulate policy<br />
and action such that <strong>Council</strong><br />
operations and decision<br />
making progress towards<br />
being carbon neutral<br />
Recommended key projects<br />
or actions for consideration in<br />
next year’s Management Plan<br />
Continue to implement<br />
<strong>Great</strong> <strong>Lakes</strong> <strong>Council</strong>s<br />
Sustainability Strategy<br />
Continue to implement<br />
<strong>Great</strong> <strong>Lakes</strong> <strong>Council</strong>s<br />
Sustainability Strategy<br />
/ Review integration of<br />
existing Sustainability<br />
Strategy with Community<br />
Strategic Plan<br />
Relevant <strong>Council</strong><br />
section<br />
Natural<br />
Systems<br />
Natural<br />
Systems<br />
Are there<br />
existing<br />
resources for<br />
action<br />
Partial<br />
N<br />
Commence<br />
by/timeframe<br />
Within 2yrs<br />
Within 5yrs<br />
<strong>Great</strong> <strong>Lakes</strong> <strong>Council</strong> 2011 State of the Environment Report 91
8 Noise<br />
9 Heritage<br />
Noise pollution can disturb our work,<br />
concentration, relaxation and sleep. It can cause<br />
stress and create or worsen physical problems<br />
such as high blood pressure, chronic exhaustion<br />
and heart disease. A quieter environment is<br />
a restful place that promotes relaxation and a<br />
happier and healthier community.<br />
Within the <strong>Great</strong> <strong>Lakes</strong> premises/ activities that<br />
create potential excessive noise are regulated<br />
through the DA process. Furthermore <strong>Council</strong><br />
addresses separate noise complaints in<br />
accordance with the POEO Act. Therefore noise<br />
generation is not considered a viable indicator<br />
of environmental trends at this time. As such, no<br />
indicators for this theme are deemed relevant to<br />
<strong>Council</strong>’s SoE process at this time.<br />
The <strong>NSW</strong> Heritage Act 1977 defines<br />
environmental heritage as being ‘those places,<br />
buildings, works, relics, moveable objects, and<br />
precincts, of State or local heritage significance’.<br />
Two key pieces of legislation, the National Parks<br />
and Wildlife Act 1974 and the Environmental<br />
Planning and Assessment Act 1979, protect<br />
Aboriginal heritage within the <strong>Great</strong> <strong>Lakes</strong> LGA.<br />
9.1 Non-Aboriginal<br />
heritage<br />
Introduction<br />
Sites of natural and cultural heritage significance<br />
are subject to pressures from development and<br />
urbanisation, particularly where developments<br />
are proposed or take place immediately in the<br />
vicinity of such heritage items. Heritage items<br />
are also subject to environmental and additional<br />
anthropogenic pressures depending on their<br />
nature and tenure.<br />
Monitoring and results<br />
<strong>Council</strong>’s Strategic Planning section has compiled<br />
a <strong>Great</strong> <strong>Lakes</strong> Heritage Study, which was adopted<br />
by <strong>Council</strong> in May 2007. The study, which has<br />
been developed with the aid of the community,<br />
identifies items of heritage significance and<br />
heritage conservation areas. The study is based<br />
on guidelines issued by the <strong>NSW</strong> Heritage Office<br />
for community based heritage studies and lists<br />
354 heritage items, including contributory items.<br />
Items of contributory significance have been<br />
identified as having heritage significance but after<br />
consideration have not been recommended for<br />
individual heritage listing.<br />
Figure 9.1.1 Pilot Hill, Forster is listed as a place of local historical<br />
importance - maritime shipping<br />
92 <strong>Great</strong> <strong>Lakes</strong> <strong>Council</strong> 2011 State of the Environment Report
Table 9.1.1 lists 19 items of natural heritage<br />
significance, and their respective identifier codes,<br />
which have been listed within the <strong>Great</strong> <strong>Lakes</strong><br />
Heritage Study.<br />
The Heritage Study, including the location<br />
of heritage items can be viewed on <strong>Council</strong>’s<br />
website, or alternately can be purchased at<br />
<strong>Council</strong>’s Offices upon request.<br />
Table 9.1.1<br />
Location<br />
Natural Heritage Items<br />
Heritage site<br />
BULAHDELAH 1. Bulahdelah Mountain also known as the Alum Mountain (Bu04) - Includes<br />
the Underground Rock Orchid, Rock Orchid - Dendrobium species, Aboriginal<br />
Scarred Trees, and the Alum Mountain Park.<br />
CARRINGTON 2. Three Moreton Bay Fig Trees on waterfront near oyster lease (Ca13) -<br />
(contributory item only).<br />
3. Tahlee House grounds and gardens (Ca10) - Important relics of early garden<br />
and landscape styles.<br />
FORSTER 4. Waterfront, Little St, waterside vegetation, the ‘little baths’ and concrete<br />
block from Albert von Ehlefeldt’s shop and bakery wharf - (Fo08) - Includes<br />
important remnants of remaining littoral vegetation<br />
5. Forster Breakwater (Fo08) - Of maritime shipping historical importance.<br />
6. Pilot Hill, Forster (Fo09) - Of maritime shipping historical importance as well<br />
as important open space reserve, local landmark and geographical feature.<br />
7. Cape Hawke Drive, Reynolds Hill (Fo17) - Includes Moreton Bay Fig.<br />
NABIAC 8. Dwelling including Canary Island Palms (Na04) - Mature Canary Island Palms<br />
with conspicuous streetscape element.<br />
SEAL ROCKS 9. Blowhole (SR09) - possibly of Aboriginal significance. Further investigation by<br />
NPWS required (contributory item only).<br />
STROUD RoaD 10. Washpool, near Washpool Bridge (SD03) - Important site from Australian<br />
Agricultural Company days but no physical evidence remains other than the<br />
pool (also listed as an item of heritage significance in <strong>Great</strong> <strong>Lakes</strong> LEP 1996).<br />
TEA GARDENS/ HAWKS<br />
NEST/ WINDA WHOPPA<br />
TIONA<br />
TUNCURRY<br />
11. Large fig tree near 59 marine Drive and large fig tree outside Police<br />
Residence, 51 Marine Drive (TG17) - Strong streetscape value.The first item in<br />
particular is an excellent example of its type.Both appear to be native to the<br />
area.<br />
12. Norfolk Island pines near 45 - 47 Marine Drive (TG34) - Prominent streetscape<br />
elements and historically popular and significant planting in seaside and<br />
riverbank localities (one suffering dieback).<br />
13. Norfolk Island pines, 38 The Anchorage, Winda Woppa (HN06) - Significance<br />
as a landmark and historic navigational point.<br />
14. Memorial Park (TG36) - War memorial park and entrance gates.<br />
15. The Green Cathedral including adjacent wharf remains (Ti01) - Important for<br />
social and historical reasons as the <strong>Great</strong> <strong>Lakes</strong> area’s first and only outdoor<br />
cathedral.<br />
16. John Wright Park including Norfolk Pines (Tu08) - Important association with<br />
the Wright family. Important landscape waterfront element.<br />
17. Memorial Park (TU14) - Important open space and visual element of the<br />
proposed Tuncurry Heritage Conservation Area.<br />
18. Six Canary Island palms on Taree St and at Tokelau (Tu10) - Conspicuous<br />
streetscape elements that enhance the proposed Tuncurry Heritage<br />
Conservation Area’s historical significance.<br />
19. Norfolk Island Pines, Tokelau (TU11) - Conspicuous streetscape elements<br />
that enhance the proposed Tuncurry Heritage Conservation Area’s historical<br />
significance.<br />
Heritage<br />
<strong>Great</strong> <strong>Lakes</strong> <strong>Council</strong> 2011 State of the Environment Report 93
9.2 Aboriginal heritage<br />
Introduction<br />
Similarly to natural and cultural heritage items,<br />
sites of Aboriginal heritage are also subject to<br />
development and environmental pressures.<br />
There is a legislative requirement for <strong>Council</strong>s to<br />
consider items and sites of Aboriginal cultural<br />
significance in their decision making processes.<br />
As such, archaeological investigations are<br />
commonly required as supporting material for<br />
Development Applications, Local Environmental<br />
Studies and Reviews of Environmental Factors.<br />
The management/ conservation of Aboriginal<br />
cultural sites is often a complex issue that entails<br />
such considerations as adequate site protection,<br />
cultural sensitivities, etc.<br />
Monitoring<br />
Aboriginal Site management is principally the<br />
responsibility of the Department of Environment,<br />
Climate Change and Water (DECCW), with the<br />
assistance of the relevant Local Aboriginal Land<br />
<strong>Council</strong>/ Aboriginal community. An Aboriginal<br />
Heritage Information Management System<br />
(AHIMS) is administered by DECCW with respect<br />
to Aboriginal Sites. The AHIMS includes a<br />
database and recording cards for all Aboriginal<br />
objects, Aboriginal places and other Aboriginal<br />
heritage values in <strong>NSW</strong> that have been reported<br />
to the NPWS in addition to a database index<br />
of archaeological reports and a library of these<br />
reports.<br />
Previous SoE reports had attempted to<br />
include an indicator on Aboriginal sites and<br />
their management (protection, destruction,<br />
etc). However, considering that much of the<br />
information on Aboriginal historical sites/items<br />
is maintained by the DECCW this has proved<br />
to be beyond the scope of the SoE. As such, no<br />
indicator for Aboriginal site management has<br />
been provided in the present SoE report.<br />
Results<br />
The <strong>Great</strong> <strong>Lakes</strong> Heritage Study was intended to<br />
cover all aspects of European cultural and natural<br />
heritage. During the preparation of the study a<br />
number of Aboriginal sites/items were brought<br />
to the attention of <strong>Council</strong>. These items were<br />
included in the study to ensure their ongoing<br />
protection, notwithstanding that DECCW (under<br />
the National Parks & Wildlife Act 1974) is the<br />
primary agency responsible for the identification<br />
and listing of Aboriginal items/sites of heritage<br />
significance.<br />
Continued investigation is needed to accurately<br />
document items and sites of Aboriginal cultural<br />
heritage significance that have not previously<br />
been identified within the <strong>Great</strong> <strong>Lakes</strong> area by<br />
either DECCW or <strong>Council</strong>.<br />
Summary and future<br />
directions<br />
This SoE has identified the need for enhanced<br />
liaison, understanding and cooperation between<br />
<strong>Council</strong>, the Aboriginal community and the<br />
relevant government agencies to ensure that<br />
sites are appropriately managed and protected.<br />
This should occur both through proactive<br />
land management programs and through<br />
development and rezoning proposals.<br />
To this end, <strong>Council</strong> should aim to foster and<br />
promote constructive liaison with the local<br />
Aboriginal community and establish appropriate<br />
and meaningful protocols for Aboriginal site<br />
management and protection in the Development<br />
Application process, rezonings and its own works<br />
program.<br />
Figure 9.2.1 Aboriginal Heritage Conservation Officer, Steve<br />
Brereton delivers a cultural heritage education session at Burgess<br />
Beach open campsite<br />
94 <strong>Great</strong> <strong>Lakes</strong> <strong>Council</strong> 2011 State of the Environment Report
Table 9.2.1<br />
Identified needs for action regarding Aboriginal heritage<br />
Identified Need for Action<br />
Investigate the employment<br />
of a Aboriginal Liaison Officer<br />
such that greater cooperation<br />
and action with respect of<br />
cultural sensitivity, liaison<br />
and opportunities can be<br />
achieved between <strong>Council</strong><br />
and the local Aboriginal<br />
community, with respect<br />
of economic, social and<br />
environmental outcomes;<br />
As part of any future review<br />
of <strong>Council</strong>’s development<br />
consent processes, devise and<br />
implement an appropriate<br />
range of tools for respecting,<br />
managing and protecting<br />
Aboriginal heritage and<br />
allowing greater consultation,<br />
between <strong>Council</strong> and the<br />
local Aboriginal community,<br />
in the determination/<br />
approvals process. Develop a<br />
framework that considers and<br />
addresses issues associated<br />
with landscape conservation<br />
with due respect to cultural<br />
sensitivities.<br />
Recommended key projects<br />
or actions for consideration in<br />
next year’s Management Plan<br />
Aboriginal Liaison Officer<br />
(employment)<br />
Collaborative Framework for<br />
consideration of Aboriginal<br />
Heritage<br />
Cultural heritage training for<br />
relevant staff<br />
Relevant <strong>Council</strong><br />
section<br />
Are there<br />
existing<br />
resources for<br />
action<br />
Commence<br />
by/timeframe<br />
<strong>Council</strong> wide N Immediate<br />
<strong>Council</strong> wide N Within 2yrs<br />
<strong>Council</strong> wide N Within 2 yrs<br />
<strong>Great</strong> <strong>Lakes</strong> <strong>Council</strong> 2011 State of the Environment Report 95
10 Community Involvement<br />
10.1 Community volunteers<br />
<strong>Great</strong> <strong>Lakes</strong> <strong>Council</strong> facilitates and supports many voluntary groups that work on council property across<br />
the LGA. This includes, weeding, revegetation works, water quality monitoring and an underwater group.<br />
The following table provides and outline of the groups and their main activities.<br />
Group<br />
Blueys Beach<br />
Dunecare<br />
Bennetts Head<br />
Landcare<br />
Boomerang<br />
Beach<br />
DuneCare<br />
Burgess Beach<br />
CoastCare<br />
Burraneer<br />
Saltmarsh<br />
Work<br />
Location<br />
Blueys<br />
Beach<br />
Bennetts<br />
Head<br />
North<br />
Boomerang<br />
Burgess<br />
Beach<br />
Burraneer<br />
Road<br />
Vegetation<br />
Community<br />
Coastal Heath<br />
with Littoral<br />
Rainforest<br />
patches (on<br />
headland and at<br />
southern end of<br />
beach).<br />
Themeda<br />
Grassland<br />
next to cliff,<br />
with scattered<br />
rainforest<br />
patches, adjacent<br />
to large mown<br />
areas. Large<br />
rainforest area<br />
to the south of<br />
Lookout<br />
Coastal Heath /<br />
Scrub, Tuckeroo<br />
patches<br />
throughout<br />
(hind dune and<br />
in southern<br />
area near toilet),<br />
Themeda<br />
Grassland at foot<br />
of Boomerang<br />
Head.<br />
Littoral<br />
Rainforest, with<br />
Cynanchum<br />
elegans (3<br />
populations).<br />
Saltmarsh,<br />
Mangrove,<br />
Casuarina /<br />
Sclerophyll forest<br />
Weeds<br />
Bitou (Chrysanthemoides<br />
monilifera var. rotunda),<br />
Senna (Senna pendula var<br />
glabrata, Mother of Millions<br />
(Bryophyllum sp.), Lantana<br />
(Lantana camara), Turkey<br />
Rhubarb (Acetosa sagitatta),<br />
Glory Lily (Gloriosa superba),<br />
Gazania (Gazania rigens),<br />
Asparagus Fern (Asparagus<br />
aethiopicus)<br />
Lantana (Lantana<br />
camara), Mother Millions<br />
(Bryophyllum sp.), Madiera<br />
Vine (Anredera cordifolia),<br />
Paspalum, Kikuyu.<br />
Main threat = Bitou<br />
(Chrysanthemoides<br />
monilifera var. rotunda), also<br />
Asparagus fern (Asparagus<br />
aethiopicus), Senna (Senna<br />
pendula var glabrata),<br />
Gazania (Gazania rigens),<br />
and Lantana (Lantana<br />
camara)<br />
Climber weeds (see mgt<br />
plan), Senna (Senna<br />
pendula var glabrata),<br />
Lantana (Lantana camara),<br />
Bitou (Chrysanthemoides<br />
monilifera var. rotunda)<br />
Lantana, Senna, Ipomoea,<br />
White Passionflower,<br />
Asparagus aethiopicus,<br />
Araujia hortorum<br />
Main tasks<br />
(Group)<br />
Bitou Bush<br />
removal<br />
along beach,<br />
Asparagus Fern<br />
on Headland<br />
Trail, Senna,<br />
Lantana<br />
Working from<br />
northern end,<br />
targeting bitou<br />
and other<br />
emergent<br />
weeds,<br />
replanting.<br />
Awaiting<br />
approval to<br />
commence<br />
works<br />
Primary and<br />
follow-up<br />
weeding<br />
Meeting Time<br />
/ Frequency<br />
One<br />
Saturday per<br />
month, 2-3<br />
hours<br />
Friday<br />
mornings,<br />
2-3 hours.<br />
Thursday<br />
mornings,<br />
8:30am, 2-3<br />
hours<br />
Monday<br />
mornings,<br />
8am, 2-3<br />
hours<br />
As required<br />
(only one<br />
volunteer)<br />
96 <strong>Great</strong> <strong>Lakes</strong> <strong>Council</strong> 2011 State of the Environment Report
Group<br />
Coomba<br />
Aquatic Club<br />
Landcare<br />
Coomba<br />
Foreshore<br />
Group<br />
Coomba Road<br />
Saltmarsh<br />
Darawank Park<br />
Friends of<br />
Booti Booti<br />
- Elizabeth<br />
Beach (NP)<br />
Friends of<br />
Booti Booti -<br />
Shelley Beach<br />
(NP)<br />
Friends of<br />
Pebbly Beach<br />
Work<br />
Location<br />
Coomba<br />
Aquatic<br />
Gardens<br />
Coomba<br />
Foreshore<br />
Opposite<br />
16 Coomba<br />
Road<br />
Wallamba<br />
River,<br />
Darawahk<br />
Elizabeth<br />
Beach<br />
Shelley<br />
Beach<br />
Bennetts<br />
Head<br />
Vegetation<br />
Community<br />
Wetland -<br />
Saltmarsh,<br />
Casuarina / Palm<br />
Forest; Peninsula<br />
- Eucalyptus<br />
tereticornis/<br />
spotted gum/<br />
casuarina,<br />
with rainforest<br />
emergents along<br />
southern flank.<br />
Swamp Oak,<br />
Forest Red Gum<br />
with rainforest<br />
emergents.<br />
Saltmarsh,<br />
Mangrove, Mown<br />
edges<br />
Mown park, with<br />
Casuarina edge<br />
along Wallamba<br />
Littoral<br />
Rainforest,<br />
Coastal Scrub<br />
Littoral<br />
Rainforest,<br />
Coastal Scrub<br />
(including<br />
Melaleca<br />
armillaris stands),<br />
Coastal Heath,<br />
Themeda<br />
Grassland,<br />
Wet and Dry<br />
Sclerophyll forest<br />
Littoral Rainforest<br />
(Frewins Walk),<br />
Coastal Scrub<br />
(Banksia,<br />
Themeda).<br />
Weeds<br />
Moth Vine (Araujia<br />
hortorum) Passiflora<br />
suberosa, Ipomoea cairica,<br />
Asparagus aethiopicus,<br />
Asparagus asparagoides,<br />
Senna pendula var. glabrata,<br />
Senecio mikanioides<br />
Lantana (Lantana camara),<br />
Madiera Vine (Anredera<br />
cordifolia), Passiflora<br />
subpeltata, Ipomoea cairica,<br />
Asparagus aethiopicus, Grass<br />
weeds (Rhodes, Panic Veldt,<br />
Kikuyu).<br />
Asparagus aethiopicus, A.<br />
asparagoides, Ipomoea<br />
cairica, Araujia hortorum.<br />
Mother of Millions,<br />
Senna pendula var.<br />
glabrata, Lantana camara,<br />
Cinnamomum camphora,<br />
Ipomoea indica<br />
Climbing Asparagus<br />
(Asparagus plumosus),<br />
Lantana (Lantana camara),<br />
Bitou (Chrysanthemoides<br />
monilifera var. rotunda)<br />
Lantana (Lantana camara),<br />
Bitou (Chrysanthemoides<br />
monilifera var. rotunda),<br />
Passiflora subpeltata, Araujia<br />
hortorum<br />
Asparagus aethiopicus,<br />
Lantana camara,<br />
Tradescantia albiflora,<br />
Senna pendula var. glabrata,<br />
Senencio mikanoides,<br />
Ipomoea cairica, Ehrharta<br />
erecta<br />
Main tasks<br />
(Group)<br />
Ground<br />
Maintenance<br />
(Mowing, track<br />
maintenance,<br />
amenity<br />
maintenance),<br />
follow-up<br />
weeding on<br />
peninsula<br />
bushland and<br />
wetland.<br />
Most of the<br />
primary<br />
weeding is<br />
complete<br />
(Lantana<br />
removal along<br />
path), followup<br />
weeding<br />
of vine weeds<br />
and lantana,<br />
planting.<br />
Follow-up<br />
weeding,<br />
planting<br />
Mowing,<br />
planting<br />
Track fence<br />
posts removed,<br />
primary<br />
weeding<br />
along track<br />
completed<br />
Followup<br />
weeding<br />
around Shelley<br />
beach and up<br />
to fire trail.<br />
follow-up<br />
weeding, track<br />
maintenance,<br />
mowing,<br />
landscaping<br />
Meeting Time<br />
/ Frequency<br />
Thursday<br />
mornings,<br />
8:30am, 2-3<br />
hours<br />
Tuesday<br />
mornings,<br />
9am, 2-3<br />
hours<br />
As required<br />
Weekly,<br />
Thurs<br />
morning<br />
8-10am<br />
Inactive<br />
Third<br />
Thursday of<br />
each month;<br />
8am, 3 hours<br />
Friday<br />
mornings,<br />
7:30am, 2-3<br />
hours.<br />
Community<br />
Involvement<br />
<strong>Great</strong> <strong>Lakes</strong> <strong>Council</strong> 2011 State of the Environment Report 97
Group<br />
Green Point<br />
CoastCare<br />
Myall Koala &<br />
Environmental<br />
Support Group<br />
Nabiac<br />
Landcare<br />
One Mile<br />
DuneCare<br />
Pindimar<br />
CoastCare<br />
Smiths Lake<br />
Foreshore<br />
Group<br />
Smiths Lake<br />
Landcare<br />
The Sanctuary<br />
Group<br />
Work<br />
Location<br />
Green Point<br />
Foreshore<br />
Koala<br />
Reserve,<br />
Hawks Nest<br />
Bullocky<br />
Wharf,<br />
Nabiac<br />
One Mile<br />
Beach<br />
Pindimar<br />
Foreshore<br />
Frothy<br />
Coffee,<br />
Smiths Lake<br />
Cellito<br />
Beach<br />
The<br />
Sanctuary,<br />
Forster<br />
Community<br />
Nursery,<br />
Tuncurry<br />
Vegetation<br />
Community<br />
Casuarina,<br />
Palm Forest,<br />
Forest Red gum<br />
with rainforest<br />
emergents<br />
Various, Swamp<br />
Mahogany,<br />
Broad-leaved<br />
Paperbark,<br />
Blackbutt<br />
Swamp Oak,<br />
Forest Red Gum<br />
with rainforest<br />
emergents.<br />
Littoral Rainforest<br />
with Cynanchum<br />
elegans<br />
Mangrove,<br />
mown foreshore<br />
with scattered<br />
remnant trees<br />
Swamp Oak/<br />
Broad-leaved<br />
Paperbark; Dry<br />
Sclerophyll<br />
Forest (Grey<br />
Gum, Spotted<br />
Gum; Blackbutt,<br />
Angophora) with<br />
rainforest patches<br />
(in gullies) and<br />
heath on sand<br />
hills.<br />
Littoral<br />
Rainforest,<br />
Coastal Scrub,<br />
Themeda<br />
Grassland on Seacliffs<br />
Broad-leaved<br />
Paperbark;<br />
Wet heath;<br />
Angophora/<br />
Blackbutt/<br />
Banksia<br />
Weeds<br />
Ipomoea indica, I.<br />
Cairica, Senna pendula<br />
var. glabrata, Asparagus<br />
aethiopicus, Lantana camara,<br />
Tradescantia albiflora<br />
Ipomoea indica, I. Cairica,<br />
Senna pendula var.<br />
glabrata, Asparagus<br />
aethiopicus, Lantana camara,<br />
Tradescantia albiflora,<br />
Chrysanthemoides monilifera<br />
var rotunda.<br />
Ligustrum lucidium,<br />
Cinnamomum camphora,<br />
Lantana camara,<br />
Tradescantia albiflora<br />
Yucca, Asparagus<br />
aethiopicus, Senecio<br />
mikanoides, Ipomoea<br />
cairica, I. Indica, Solanum<br />
seaforthianum, Ochna<br />
serrulata, Senna pendula var.<br />
glabrata<br />
Opuntia, Bitou<br />
(Chrysanthemoides<br />
monilifera var. rotunda),<br />
Gazania rigens<br />
Lantana camara, Olea<br />
africanus, Chrysanthemoides<br />
monilifera var. rotunda,<br />
Ipomoea indica, Thunbergia<br />
elata, Asparagus aethiopicus<br />
Bitou (Chrysanthemoides<br />
monilifera var. rotunda),<br />
Senna (Senna pendula var<br />
glabrata, Lantana (Lantana<br />
camara), Cape Ivy (Senecio<br />
mikanoides), Moth Vine<br />
(Araujia hortorum), Brazillian<br />
Nightshade (Solaum<br />
seaforthianum)<br />
Cinnamomum camphora,<br />
Lantana camara, Lonicera<br />
japonica, Senna pendula var.<br />
glabrata, Ochna serrulata<br />
Main tasks<br />
(Group)<br />
follow-up<br />
weeding,<br />
planting,<br />
follow-up<br />
weeding,<br />
planting,<br />
follow-up<br />
weeding,<br />
planting,<br />
follow-up<br />
weeding,<br />
planting<br />
weeding<br />
follow-up<br />
weeding<br />
follow-up<br />
weeding ,<br />
planting,<br />
garbage<br />
removal,<br />
follow-up<br />
weeding;<br />
Nursery work<br />
Meeting Time<br />
/ Frequency<br />
Thursday<br />
mornings<br />
8:30am, 2-3<br />
hours<br />
Various<br />
Wednesday<br />
mornings,<br />
8-11am<br />
Weekly,<br />
Wednesday<br />
morning,<br />
8:30am,<br />
2-3hours<br />
Various<br />
Weekly,<br />
Wednesday<br />
morning,<br />
9am,<br />
2-3hours<br />
Weekly,<br />
Monday<br />
morning,<br />
8-11am<br />
Weekly,<br />
Tuesday<br />
morning,<br />
8-12<br />
98 <strong>Great</strong> <strong>Lakes</strong> <strong>Council</strong> 2011 State of the Environment Report
Group<br />
Tarbuck Bay<br />
BushCare<br />
Tuncurry<br />
DuneCare<br />
Tuncurry Flora<br />
Reserve<br />
Seal Rocks<br />
Community<br />
Group<br />
North<br />
Arm Cove<br />
Environment<br />
Group<br />
<strong>Great</strong> <strong>Lakes</strong><br />
Underwater<br />
Group<br />
Dad’s Navy<br />
Forster<br />
Community<br />
Gardens<br />
<strong>Great</strong> <strong>Lakes</strong><br />
Coastal Land<br />
Management<br />
Network<br />
Work<br />
Location<br />
Tarbuck<br />
Foreshore<br />
Tuncurry<br />
Beach<br />
Tuncurry<br />
Flora<br />
Reserve<br />
Seal Rocks<br />
Headland<br />
Cove Bvd<br />
Foreshore<br />
Reserve<br />
Blackhead<br />
to Port<br />
Stephens<br />
near shore<br />
reefs.<br />
Pipers<br />
Creek<br />
Penenton<br />
Creek<br />
Region<br />
Wide<br />
Vegetation<br />
Community<br />
Swamp Oak<br />
/ Eucalyptus<br />
grandis<br />
Coastal Scrub /<br />
Tuckeroo<br />
Blackbutt /<br />
Angophora<br />
Littoral Rainforest<br />
Dry Sclerophyll<br />
Forest<br />
Weeds<br />
Ipomoea cairica, Thunbergia<br />
elata, Chrysanthemoides<br />
monilifera var. rotunda,<br />
Lantana camara, Senna<br />
pendula var. glabrata<br />
Asparagus aethiopicus,<br />
Lantana camara, Senna<br />
pendula var. glabrata,<br />
Ipomoea cairica, Gloriosa<br />
superba<br />
Main tasks<br />
(Group)<br />
Currently only<br />
mowing<br />
follow-up<br />
weeding,<br />
planting,<br />
rubbish<br />
removal<br />
- follow-up<br />
weeding ,<br />
planting,<br />
garbage<br />
removal,<br />
Asparagus plumosus, Senna<br />
pendula var. glabrata,<br />
Chyrsanthemoides monilifera<br />
var. rotunda, Asparagus<br />
aethiopicus<br />
Asparagus aethiopicus,<br />
Lantana camara,<br />
Chrysanthemoides monilifera<br />
var. rotunda<br />
follow-up<br />
weeding,<br />
rubbish<br />
removal<br />
Primary and<br />
follow-up<br />
weeding<br />
Marine None found to date Monitoring<br />
marine<br />
biodiversity<br />
and collecting<br />
marine debris<br />
Estuarine None found to date Estuarine<br />
clean-up, water<br />
quality testing<br />
Sub-tropical<br />
rainforest on<br />
Floodplain;<br />
mangrove.<br />
Riparian<br />
Anredera cordifolia, Senna<br />
pendula var glabrata,<br />
Asparagus aethiopicus,<br />
Lantana camara,<br />
Cinnamomum camphora,<br />
Neph<br />
Vegetable<br />
gardens<br />
and riparian<br />
regeneration<br />
N/A - N/A - Representative<br />
Committee<br />
formed to<br />
discuss coastal<br />
priorities for<br />
volunteer<br />
groups and<br />
funding in the<br />
<strong>Great</strong> <strong>Lakes</strong><br />
Area.<br />
Meeting Time<br />
/ Frequency<br />
Inactive<br />
Weekly,<br />
Friday<br />
mornings<br />
8:30am, 2-3<br />
hours<br />
Weekly,<br />
Monday<br />
9-11am<br />
Quarterly,<br />
Saturday<br />
mornings<br />
9am, 2-3<br />
hours<br />
Weekly,<br />
Thurs<br />
morning<br />
8-10am<br />
Various<br />
As needed<br />
Tuesday<br />
mornings,<br />
9am, 2-3<br />
hours<br />
Meet<br />
quarterly<br />
<strong>Great</strong> <strong>Lakes</strong> <strong>Council</strong> 2011 State of the Environment Report 99
Response<br />
<strong>Council</strong> will continue to support the actions of community groups involved in on-ground environmental<br />
management activities.<br />
Table 10.1.1 Identified needs for action regarding community involvement<br />
Identified Need for Action<br />
Continue to implement<br />
actions that target<br />
improvements in and<br />
protection of water<br />
quality (area of significant<br />
community concern)<br />
Continually develop<br />
actions to address issues<br />
recognised as very important<br />
to the community, such as<br />
protection of vegetation<br />
and biodiversity and the<br />
control of development so<br />
that it is sustainable and<br />
environmentally appropriate.<br />
Develop and implement<br />
an education program<br />
aimed at increasing the<br />
empowerment of community<br />
members to have input into<br />
environmental management<br />
Recognise the preference<br />
of the community<br />
for information on<br />
environmental issues to be<br />
sourced from newspapers<br />
and utilise this in education<br />
initiatives (and education<br />
strategies)<br />
Recommended key projects<br />
or actions for consideration in<br />
next year’s Management Plan<br />
• Implement actions<br />
identified in the Water<br />
Quality Improvement Plan<br />
• Wallis Lake Catchment<br />
Management (progress<br />
implementation),<br />
• Healthy <strong>Lakes</strong> Program<br />
(continue and expand<br />
initiatives)<br />
Implement Sustainability<br />
Strategy<br />
Develop Education for<br />
Sustainability strategy and<br />
environmental initiatives<br />
Develop Education for<br />
Sustainability strategy and<br />
environmental initiatives<br />
Relevant <strong>Council</strong><br />
section<br />
Natural<br />
Systems<br />
Natural<br />
Systems, Whole<br />
of <strong>Council</strong><br />
Natural<br />
Systems<br />
Natural<br />
Systems<br />
Are there<br />
existing<br />
resources for<br />
action<br />
Y<br />
Y<br />
Partial<br />
Y<br />
Commence<br />
by/timeframe<br />
Ongoing<br />
Ongoing<br />
Within 2yrs<br />
Ongoing<br />
100 <strong>Great</strong> <strong>Lakes</strong> <strong>Council</strong> 2011 State of the Environment Report
11 Environmental Plans and Strategies<br />
It is generally recognised that sound<br />
environmental management and the<br />
achievement of key environmental outcomes<br />
needs to be based on effective planning<br />
principles. Consequently, <strong>Great</strong> <strong>Lakes</strong> <strong>Council</strong><br />
has developed a range of Plans and Strategies to<br />
guide natural resource management and identify/<br />
implement high priority actions across a range<br />
of natural resource management issues. This<br />
includes catchment and estuary management,<br />
urban stormwater management and threatened<br />
species recovery planning.<br />
The State of the Environment reporting<br />
framework is an ideal vehicle in which to<br />
achieve enhanced and strategic natural resource<br />
management. One of its key aims is to report on<br />
environmental achievements, but also this revised<br />
SoE procedure is intended to formulate a holistic<br />
and strategic action plan that addresses priorities<br />
and which is incorporated in the Management<br />
Plan, budget and work plan program. In this<br />
manner, the SoE can identify and describe the<br />
actions within relevant plans and strategies,<br />
report on achievements and outline and propose<br />
models to address priority actions within a<br />
strategic and holistic manner. This process will<br />
ensure that important and well resourced plans<br />
and strategies are not ignored or inadequately<br />
referenced.<br />
The relevant environmental plans and strategies<br />
that are active, operational and in the process of<br />
being implemented with <strong>Council</strong> as a lead agency<br />
or nominated partner are listed in Table 11 against<br />
a summary of their progress.<br />
To maintain a strategic approach to<br />
environmental management the progress of<br />
these plans and strategies need to be reviewed<br />
annually. An annual review of environmental<br />
plans and programs should also be used to<br />
evaluate the effectiveness of these programs<br />
in improving the environment. Obviously,<br />
this review should be based on the findings<br />
and outcomes of this SoE report, with<br />
specific reference to the outcomes of the key<br />
environmental indicators. The outcomes of this<br />
review should be reflected in the management<br />
systems of <strong>Great</strong> <strong>Lakes</strong> <strong>Council</strong> and be reported in<br />
subsequent SoE reports.<br />
Environmental Plans<br />
and Strategies<br />
<strong>Great</strong> <strong>Lakes</strong> <strong>Council</strong> 2011 State of the Environment Report 101
Table 11.1 Relevant active plans and strategies<br />
Water Quality Improvement Plan, Wallis, Smiths and Myall <strong>Lakes</strong>,n<strong>Great</strong> <strong>Lakes</strong> Co uncil, 2008<br />
Number of Actions<br />
Actions completed or<br />
ongoing<br />
Actions commenced<br />
Actions yet to<br />
commence<br />
Planned Review<br />
44 19 3 22 2015<br />
Smiths Lake Estuary Management Study and Management Plan, Webb McKeown & Associates, 2001<br />
Number of Actions<br />
Actions completed or<br />
ongoing<br />
Actions commenced<br />
Actions yet to<br />
commence<br />
Planned review<br />
54 21 3 23 Overdue<br />
Wallis Lake Catchment Management Plan, <strong>Great</strong> <strong>Lakes</strong> <strong>Council</strong>, 2003<br />
Number of Actions<br />
Actions completed or<br />
ongoing<br />
Actions commenced<br />
Actions yet to<br />
commence<br />
Planned review<br />
95 46 18 29 Overdue<br />
Lower Wallamba River Rivercare Plan, Skelton, S, 2003<br />
Number of Actions<br />
Actions completed or<br />
ongoing<br />
Actions commenced<br />
Actions yet to<br />
commence<br />
Planned review<br />
23 12 3 8 -<br />
Wallis Lake Estuary Management Plan, <strong>Great</strong> <strong>Lakes</strong> <strong>Council</strong>, 2005<br />
Number of Actions<br />
Actions completed or<br />
ongoing<br />
Actions commenced<br />
Actions yet to<br />
commence<br />
Planned review<br />
158 67 40 70 2010<br />
Darawakh Creek and Frogalla Swamp Wetland Management Plan, WetlandCare Australia, 2004<br />
Number of Actions<br />
Actions completed or<br />
ongoing<br />
Actions commenced<br />
Actions yet to<br />
commence Planned review date<br />
23 7 14 2 -<br />
Hawks Nest and Tea Gardens Endangered Koala Population Recovery Plan, <strong>NSW</strong> DEC, 2004<br />
Number of Actions<br />
Actions completed or<br />
ongoing<br />
Actions commenced<br />
Actions yet to<br />
commence<br />
Planned review<br />
21 6 12 3 -<br />
Wallis Lake Stormwater Source Control Study, Jelliffe Environmental, 1999<br />
Number of Actions<br />
Actions completed or<br />
ongoing<br />
Actions commenced<br />
Actions yet to<br />
commence<br />
Planned review<br />
26 11 5 6 -<br />
Tea Gardens, Hawks Nest and Bulahdelah Stormwater Management Plan, Jelliffe Environmental, 2000<br />
Number of Actions<br />
Actions completed or<br />
ongoing<br />
Actions commenced<br />
Actions yet to<br />
commence<br />
Planned review<br />
No data No data No data No Data No Data<br />
Port Stephens/ Myall <strong>Lakes</strong> Estuary Management Plan, Umwelt (Australia), 2000<br />
Number of Actions<br />
Actions completed or<br />
ongoing<br />
Actions commenced<br />
Actions yet to<br />
commence<br />
Planned review<br />
68 17 15 46 Overdue<br />
102 <strong>Great</strong> <strong>Lakes</strong> <strong>Council</strong> 2011 State of the Environment Report
12 Acronyms & Abbreviations<br />
DECCW<br />
DNR<br />
I&I<br />
ESD<br />
GIS<br />
GLC<br />
GPT<br />
GTCC<br />
HCRCMA<br />
HRC<br />
LEP<br />
LGA<br />
MER<br />
MCW<br />
NPWS<br />
NRM<br />
<strong>NSW</strong><br />
OECD<br />
PAL<br />
POEO Act<br />
PSR<br />
SoE<br />
TPO<br />
WONS<br />
WQIP<br />
WSUD<br />
Department of Environment, Climate Change & Water<br />
Department of Natural Resources<br />
Industry and Investment <strong>NSW</strong><br />
Ecologically Sustainable Development<br />
Geographic Information System<br />
<strong>Great</strong> <strong>Lakes</strong> <strong>Council</strong><br />
Gross Pollutant Trap<br />
<strong>Great</strong>er Taree City <strong>Council</strong><br />
Hunter Central Rivers Catchment Management Authority<br />
Healthy Rivers Commission<br />
Local Environment Plan<br />
Local <strong>Government</strong> Area<br />
Monitoring Evaluation and Reporting<br />
MidCoast Water<br />
National Park and Wildlife Service<br />
Natural Resource Management<br />
New South Wales<br />
Organisation for Economic Corporation and Development<br />
Participatory Action Learning<br />
Protection of the Environment Operations Act<br />
Pressure – State – Response<br />
State of the Environment<br />
Tree Preservation Order<br />
Weed of National Significance<br />
Water Quality Improvement Plan<br />
Water Sensitive Urban Design<br />
Acronyms and<br />
Abbreviations<br />
<strong>Great</strong> <strong>Lakes</strong> <strong>Council</strong> 2011 State of the Environment Report 103
13 Appendix 1<br />
2011 Waterway & Catchment Report Card<br />
for Wallis, Smiths and Myall <strong>Lakes</strong><br />
104 <strong>Great</strong> <strong>Lakes</strong> <strong>Council</strong> 2011 State of the Environment Report
<strong>Great</strong> <strong>Lakes</strong><br />
C O U N C I L<br />
Enquires should be directed to:<br />
<strong>Great</strong> <strong>Lakes</strong> <strong>Council</strong><br />
PO Box 450<br />
Forster <strong>NSW</strong> 2428<br />
telephone: (02) 6591 7222<br />
fax: (02) 6591 7221<br />
email: council@greatlakes.nsw.gov.au<br />
© 2011 <strong>Great</strong> <strong>Lakes</strong> <strong>Council</strong>