Enantiomeric resolution of amino acids by thin-layer ... - INCT-Inofar
Enantiomeric resolution of amino acids by thin-layer ... - INCT-Inofar
Enantiomeric resolution of amino acids by thin-layer ... - INCT-Inofar

You also want an ePaper? Increase the reach of your titles
YUMPU automatically turns print PDFs into web optimized ePapers that Google loves.
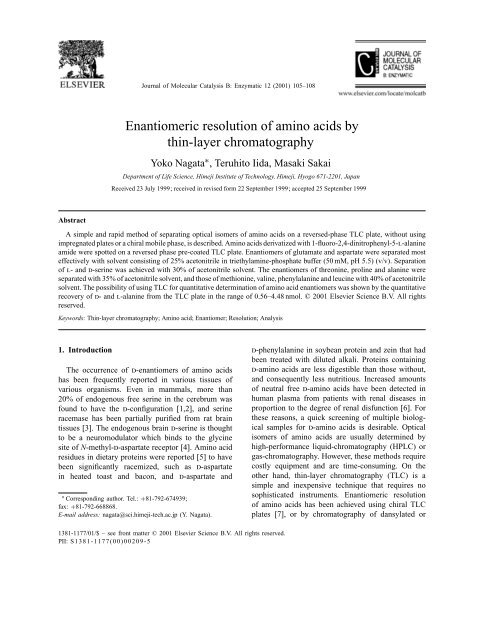
Journal <strong>of</strong> Molecular Catalysis B: Enzymatic 12 (2001) 105–108<br />
<strong>Enantiomeric</strong> <strong>resolution</strong> <strong>of</strong> <strong>amino</strong> <strong>acids</strong> <strong>by</strong><br />
<strong>thin</strong>-<strong>layer</strong> chromatography<br />
Yoko Nagata ∗ , Teruhito Iida, Masaki Sakai<br />
Department <strong>of</strong> Life Science, Himeji Institute <strong>of</strong> Technology, Himeji, Hyogo 671-2201, Japan<br />
Received 23 July 1999; received in revised form 22 September 1999; accepted 25 September 1999<br />
Abstract<br />
A simple and rapid method <strong>of</strong> separating optical isomers <strong>of</strong> <strong>amino</strong> <strong>acids</strong> on a reversed-phase TLC plate, without using<br />
impregnated plates or a chiral mobile phase, is described. Amino <strong>acids</strong> derivatized with 1-fluoro-2,4-dinitrophenyl-5-l-alanine<br />
amide were spotted on a reversed phase pre-coated TLC plate. Enantiomers <strong>of</strong> glutamate and aspartate were separated most<br />
effectively with solvent consisting <strong>of</strong> 25% acetonitrile in triethylamine-phosphate buffer (50 mM, pH 5.5) (v/v). Separation<br />
<strong>of</strong> l- and d-serine was achieved with 30% <strong>of</strong> acetonitrile solvent. The enantiomers <strong>of</strong> threonine, proline and alanine were<br />
separated with 35% <strong>of</strong> acetonitrile solvent, and those <strong>of</strong> methionine, valine, phenylalanine and leucine with 40% <strong>of</strong> acetonitrile<br />
solvent. The possibility <strong>of</strong> using TLC for quantitative determination <strong>of</strong> <strong>amino</strong> acid enantiomers was shown <strong>by</strong> the quantitative<br />
recovery <strong>of</strong> d- and l-alanine from the TLC plate in the range <strong>of</strong> 0.56–4.48 nmol. © 2001 Elsevier Science B.V. All rights<br />
reserved.<br />
Keywords: Thin-<strong>layer</strong> chromatography; Amino acid; Enantiomer; Resolution; Analysis<br />
1. Introduction<br />
The occurrence <strong>of</strong> d-enantiomers <strong>of</strong> <strong>amino</strong> <strong>acids</strong><br />
has been frequently reported in various tissues <strong>of</strong><br />
various organisms. Even in mammals, more than<br />
20% <strong>of</strong> endogenous free serine in the cerebrum was<br />
found to have the d-configuration [1,2], and serine<br />
racemase has been partially purified from rat brain<br />
tissues [3]. The endogenous brain d-serine is thought<br />
to be a neuromodulator which binds to the glycine<br />
site <strong>of</strong> N-methyl-d-aspartate receptor [4]. Amino acid<br />
residues in dietary proteins were reported [5] to have<br />
been significantly racemized, such as d-aspartate<br />
in heated toast and bacon, and d-aspartate and<br />
∗ Corresponding author. Tel.: +81-792-674939;<br />
fax: +81-792-668868.<br />
E-mail address: nagata@sci.himeji-tech.ac.jp (Y. Nagata).<br />
d-phenylalanine in soybean protein and zein that had<br />
been treated with diluted alkali. Proteins containing<br />
d-<strong>amino</strong> <strong>acids</strong> are less digestible than those without,<br />
and consequently less nutritious. Increased amounts<br />
<strong>of</strong> neutral free d-<strong>amino</strong> <strong>acids</strong> have been detected in<br />
human plasma from patients with renal diseases in<br />
proportion to the degree <strong>of</strong> renal disfunction [6]. For<br />
these reasons, a quick screening <strong>of</strong> multiple biological<br />
samples for d-<strong>amino</strong> <strong>acids</strong> is desirable. Optical<br />
isomers <strong>of</strong> <strong>amino</strong> <strong>acids</strong> are usually determined <strong>by</strong><br />
high-performance liquid-chromatography (HPLC) or<br />
gas-chromatography. However, these methods require<br />
costly equipment and are time-consuming. On the<br />
other hand, <strong>thin</strong>-<strong>layer</strong> chromatography (TLC) is a<br />
simple and inexpensive technique that requires no<br />
sophisticated instruments. <strong>Enantiomeric</strong> <strong>resolution</strong><br />
<strong>of</strong> <strong>amino</strong> <strong>acids</strong> has been achieved using chiral TLC<br />
plates [7], or <strong>by</strong> chromatography <strong>of</strong> dansylated or<br />
1381-1177/01/$ – see front matter © 2001 Elsevier Science B.V. All rights reserved.<br />
PII: S1381-1177(00)00209-5
106 Y. Nagata et al. / Journal <strong>of</strong> Molecular Catalysis B: Enzymatic 12 (2001) 105–108<br />
dinitrophenylated <strong>amino</strong> <strong>acids</strong> on impregnated TLC<br />
plates [8–10].<br />
In the present report, we describe a simple and<br />
rapid method <strong>of</strong> separating optical isomers <strong>of</strong> <strong>amino</strong><br />
<strong>acids</strong> on a reversed-phase TLC plate, without using<br />
expensive impregnated plates or chiral mobile phase.<br />
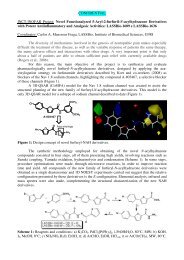
Our method was developed from that <strong>of</strong> Marfey<br />
[11], which resolves <strong>amino</strong> acid enantiomers through<br />
high-performance liquid chromatography (HPLC).<br />
In Marfey’s method, <strong>amino</strong> <strong>acids</strong> are derivatized<br />
with 1-fluoro-2,4-dinitrophenyl-5-l-alanine amide<br />
(FDAA) to form diastereomers <strong>of</strong> <strong>amino</strong> <strong>acids</strong>. The<br />
enantiomeric separation <strong>of</strong> FDAA <strong>amino</strong> <strong>acids</strong> is performed<br />
<strong>by</strong> HPLC, using a reversed-phase C 18 column<br />
and eluting with a linear gradient from 10 to 40%<br />
acetonitrile in triethylamine-phosphate buffer (pH<br />
3.5) over 45 min [11,12].<br />
2. Materials and methods<br />
Amino <strong>acids</strong> were derivatized with 1-fluoro-2,4-<br />
dinitrophenyl-5-l-alanine amide (FDAA or Marfey’s<br />
reagent [11], Pierce, Rockford, IL, USA) according to<br />
Marfey’s methods [11]. Briefly, 100 g<strong>of</strong>adl-<strong>amino</strong><br />
acid in 20 l H 2 O and 8 l 1 M NaHCO 3 was mixed<br />
with 400 g FDAAin40l acetone, and incubated<br />
at 40 ◦ C for 1 h with occasional shaking. The reaction<br />
was terminated <strong>by</strong> adding 4 l 2 M HCl. The acetone,<br />
water and HCl were removed <strong>by</strong> evaporation under<br />
reduced pressure in a centrifugal evaporator. After<br />
evaporation, 20 l methanol was added to dissolve the<br />
resultant FDAA <strong>amino</strong> acid. FDAA <strong>amino</strong>-acid solution<br />
(2 l) thus prepared (0.5%, w/v) was spotted on<br />
a reversed phase pre-coated TLC plate (RP-18 F 254S ,<br />
5cm × 10 cm, Merck, Darmstadt, Germany), and<br />
developed with acetonitrile/triethylamine-phosphate<br />
buffer (50 mM, pH 5.5) at 25/75 (v/v), 30/70, 35/65<br />
or 40/60 in a pre-equilibrated glass chamber at 25 ◦ C.<br />
The FDAA <strong>amino</strong> acid spots were yellow and visible.<br />
When the ascending solvent front neared the<br />
top margin, the plate was removed from the chamber<br />
and dried with a hair-drier. The TLC was completed<br />
in 20 min at 25 ◦ C. A trial for quantitative analysis<br />
was made <strong>by</strong> applying several different amounts <strong>of</strong><br />
dl-alanine to the plate. The yellow spots were scraped<br />
<strong>of</strong>f the plate after the chromatography, and extracted<br />
with methanol/water (1/1, v/v). The absorbance <strong>of</strong> the<br />
extracts was measured at 340 nm with a spectrophotometer.<br />
Since FDAA is light sensitive, the FDAA<br />
<strong>amino</strong> <strong>acids</strong> were protected from exposure to light<br />
during all procedures.<br />
All reagents used were <strong>of</strong> analytical or chromatographic<br />
grade, purchased from Nacalai (Kyoto, Japan)<br />
or Sigma (St. Louis, MO, USA).<br />
3. Results and discussion<br />
The R F values for each l- and d-enantiomer<br />
<strong>of</strong> <strong>amino</strong> <strong>acids</strong>, and the ratio <strong>of</strong> the R F value for<br />
each l-enantiomer to that <strong>of</strong> the corresponding<br />
d-enantiomer (the l/d ratio <strong>of</strong> R F ) are given in Table 1.<br />
Fig. 1 shows the chromatograms <strong>of</strong> FDAA <strong>amino</strong><br />
<strong>acids</strong> whose enantiomeric <strong>resolution</strong> is the best <strong>of</strong> several<br />
trials with various concentrations <strong>of</strong> acetonitrile<br />
from 10 to 60% in solvent, except for serine (Fig. 1A).<br />
The spots <strong>of</strong> l-enantiomers move faster than those<br />
<strong>of</strong> the corresponding d-enantiomers, i.e. the FDAA<br />
d-enantiomers have greater affinity for the C 18 silica<br />
gel than the corresponding FDAA l-enantiomers.<br />
The enantiomers <strong>of</strong> glutamate and aspartate were<br />
separated most effectively with a solvent consisting<br />
Table 1<br />
Separation <strong>of</strong> FDAA <strong>amino</strong> <strong>acids</strong> on a reversed phase TLC plate<br />
Racemate<br />
Solvent<br />
(acetonitrile %)<br />
R F value<br />
l d l/d<br />
Ser 25 0.201 0.165 1.220<br />
Glu 25 0.150 0.114 1.319<br />
Asp 25 0.176 0.133 1.377<br />
Ser 30 0.367 0.320 1.147<br />
Glu 30 0.317 0.271 1.149<br />
Ser 35 0.437 0.394 1.109<br />
Glu 35 0.417 0.375 1.112<br />
Asp 35 0.438 0.403 1.087<br />
Thr 35 0.395 0.328 1.204<br />
Pro 35 0.276 0.224 1.232<br />
Ala 35 0.270 0.203 1.330<br />
Ser 40 0.475 0.449 1.058<br />
Glu 40 0.450 0.420 1.071<br />
Met 40 0.326 0.239 1.364<br />
Val 40 0.294 0.200 1.470<br />
Phe 40 0.235 0.143 1.643<br />
Leu 40 0.216 0.144 1.500
Y. Nagata et al. / Journal <strong>of</strong> Molecular Catalysis B: Enzymatic 12 (2001) 105–108 107<br />
Fig. 1. Separation <strong>of</strong> optical isomers <strong>of</strong> FDAA <strong>amino</strong> <strong>acids</strong> on reversed phase TLC plates. Each racemic FDAA <strong>amino</strong> acid was spotted<br />
and developed in solvent, acetonitrile/50 mM triethylamine-phosphate buffer (pH 5.5): 25/75 (A); 30/70 (B); 35/65 (C) or 40/60, v/v (D)<br />
for 20 min at 25 ◦ C. The upper and the lower spots are l-and d-isomers, respectively, solvent front 75 mm.<br />
<strong>of</strong> 25% acetonitrile in triethylamine-phosphate buffer<br />
(pH 5.5) (v/v) (Table 1, Fig. 1A). l- and d-serine<br />
were separated well with 30% <strong>of</strong> acetonitrile solvent<br />
(Table 1, Fig. 1B), the enantiomers <strong>of</strong> threonine,<br />
proline and alanine, with 35% <strong>of</strong> acetonitrile solvent<br />
(Table 1, Fig. 1C), and the enantiomers <strong>of</strong> methionine,<br />
valine, phenylalanine and leucine, with 40% <strong>of</strong><br />
acetonitrile solvent (Table 1, Fig. 1D). As seen with<br />
serine and glutamate in Table 1, the R F values <strong>of</strong><br />
FDAA <strong>amino</strong> <strong>acids</strong> increased with increasing acetonitrile<br />
concentration in the elution solvent, while<br />
the l/d ratios <strong>of</strong> R F values decreased. The l/d ratio<br />
<strong>of</strong> R F value indicates the magnitude <strong>of</strong> difference <strong>of</strong><br />
R F values. The l/d ratio <strong>of</strong> serine was highest when<br />
eluted with 25% <strong>of</strong> acetonitrile solvent. However, the<br />
shape <strong>of</strong> the spots was different from that developed<br />
with 30% <strong>of</strong> acetonitrile solvent: the spots formed<br />
with 25% <strong>of</strong> acetonitrile solvent were slightly longer<br />
than those formed with 30% <strong>of</strong> acetonitrile solvent<br />
(Fig. 1A and B). Because <strong>of</strong> these factors, the best<br />
separation <strong>of</strong> serine enantiomers was achieved with<br />
30% <strong>of</strong> acetonitrile solvent, indicating that the shape<br />
<strong>of</strong> the spot is important for a clear separation, in addition<br />
to the difference in R F values between the l- and<br />
d-enantiomers. In spite <strong>of</strong> the elongation <strong>of</strong> the spots,<br />
sufficient separation <strong>of</strong> the optical isomers <strong>of</strong> methionine,<br />
valine, phenylalanine and leucine was achieved<br />
(Fig. 1D) because <strong>of</strong> the considerable difference in the<br />
R F values. The width <strong>of</strong> the FDAA <strong>amino</strong> acid spots<br />
decreased with reduced application <strong>of</strong> sample, but<br />
their length remained unchanged. The separation <strong>of</strong><br />
the enantiomers <strong>of</strong> FDAA-asparagine and -glutamine<br />
was less complete than that <strong>of</strong> the above <strong>amino</strong> <strong>acids</strong>.<br />
A better separation was obtained <strong>by</strong> repeating the<br />
chromatography, i.e. <strong>by</strong> putting the developed and<br />
dried plate back into the glass chamber for further development.<br />
The enantiomers were well-separated after<br />
the third development. The enantiomers <strong>of</strong> histidine<br />
were separated <strong>by</strong> two-dimensional TLC [12], using<br />
a plate coated with ordinary silica gel and developed<br />
in the first direction with 1-butanol/acetic acid/water<br />
and in the second direction <strong>by</strong> phenol/water.<br />
All phenylthiohydantoin (PTH) <strong>amino</strong> <strong>acids</strong> are<br />
sensitive to light, and the PTH <strong>amino</strong> <strong>acids</strong>, which<br />
are optically active racemize easily [13]. The formation<br />
<strong>of</strong> FDAA <strong>amino</strong> <strong>acids</strong>, however, proceeds<br />
quantitatively and no racemization occurs during the<br />
reaction [12]. In this study, the amount <strong>of</strong> FDAA
108 Y. Nagata et al. / Journal <strong>of</strong> Molecular Catalysis B: Enzymatic 12 (2001) 105–108<br />
Fig. 2. Quantitative recovery <strong>of</strong> FDAA l-and d-alanine from reversed<br />
phase TLC plate. Various amounts <strong>of</strong> racemic FDAA alanine<br />
were spotted on the TLC plate and developed. After the<br />
separation <strong>of</strong> FDAA alanine into enantiomers on the plate, each<br />
spot was scraped from the plate, 1.0 ml water was added to the<br />
dried scrapings and the absorbance at 340 nm was measured using<br />
a spectrophotometer ((––), FDAA l-alanine; (– –), FDAA<br />
d-alanine). The same amount <strong>of</strong> either <strong>of</strong> FDAA l-alanine or<br />
FDAA d-alanine as applied to the TLC plate was added to 1.0 ml<br />
water, and the absorbance at 340 nm was measured ((......)<br />
FDAA l-alanine; (......)FDAAd-alanine).<br />
derivatives. This treatment prevents the tail end <strong>of</strong> a<br />
large l-enantiomer spot from overlapping with the<br />
small d-enantiomer spot on the TLC plate.<br />
Szókán et al. [14] separated FDAA d- and l-<strong>amino</strong><br />
<strong>acids</strong> <strong>by</strong> HPLC using a reversed phase column and<br />
methanol/Na-acetate buffer eluent system. Since a<br />
good separation <strong>of</strong> d- and l-serine was reported<br />
(the retention time was 5.6 and 10.0 min for l- and<br />
d-serine, respectively) [14], we tried to separate the<br />
optical isomers <strong>of</strong> serine <strong>by</strong> TLC using the reversed<br />
phase plate employed in the present method, and the<br />
same buffer as above, i.e. methanol/20 mM Na-acetate<br />
buffer (pH 4.0) (1/4, v/v). The enantiomers could<br />
not be separated with this system, however, all the<br />
spots on the TLC plate were connected to the point<br />
<strong>of</strong> sample application <strong>by</strong> long tails.<br />
Acknowledgements<br />
This work was supported in part <strong>by</strong> a Grant-in-Aid<br />
for Cooperative Research (A) (No. 07308048) to YN<br />
from the Ministry <strong>of</strong> Education, Science and Culture<br />
<strong>of</strong> Japan.<br />
alanine extracted from the plate was linearly related<br />
to that <strong>of</strong> FDAA alanine spotted onto the plate, wi<strong>thin</strong><br />
the range <strong>of</strong> 0.56–4.48 nmol applied (Fig. 2). Therefore,<br />
given a standard calibration curve, this method<br />
can be used for quantitative determination <strong>of</strong> the<br />
concentration <strong>of</strong> each enantiomer <strong>of</strong> any <strong>amino</strong> acid.<br />
The enantiomeric determination <strong>of</strong> free <strong>amino</strong><br />
<strong>acids</strong> in biological samples and foods may be carried<br />
out as follows: the free <strong>amino</strong> <strong>acids</strong> in a homogenate<br />
<strong>of</strong> the sample are separated from proteins <strong>by</strong><br />
trichloroacetic-acid treatment, and are then purified<br />
<strong>by</strong> ion-exchange chromatography, and treated with<br />
FDAA. Each FDAA <strong>amino</strong> acid can be separated from<br />
the others <strong>by</strong> two-dimensional TLC [12]. Any FDAA<br />
<strong>amino</strong> acid can then be extracted from the plate with<br />
methanol/water (1/1, v/v), and subsequently analyzed<br />
<strong>by</strong> the method described in this paper to determine<br />
its enantiomeric configuration. In the presence <strong>of</strong><br />
excess amounts <strong>of</strong> l-enantiomer over the corresponding<br />
d-enantiomer, treatment <strong>of</strong> the free <strong>amino</strong><br />
acid sample with l-<strong>amino</strong> acid oxidase (EC 1.4.3.2)<br />
may be required before the formation <strong>of</strong> FDAA<br />
References<br />
[1] A. Hashimoto, T. Nishikawa, T. Hayashi, N. Fujii, K. Harada,<br />
T. Oka, K. Takahashi, FEBS Lett. 296 (1992) 33–36.<br />
[2] Y. Nagata, Experientia 48 (1992) 753–755.<br />
[3] H. Wolosker, K.N. Sheth, M. Takahashi, J.P. Mothet, R.O.<br />
Brady Jr., C.D. Ferris, S.H. Snyder, Proc. Natl. Acad. Sci.<br />
USA 96 (1999) 721–723.<br />
[4] M.J. Schell, R.O. Brady Jr., M.E. Molliver, S.H. Snyder, J.<br />
Neurosci. 17 (1997) 1604–1615.<br />
[5] E.H. Man, Ann. Rev. Nutr. 7 (1987) 209–225.<br />
[6] Y. Nagata, T. Akino, K. Ohno, Y. Kataoka, T. Ueda, T.<br />
Sakurai, K. Shiroshita, T. Yasuda, Clin. Sci. 73 (1987) 105–<br />
108.<br />
[7] K. Günter, J. Chromatogr. 448 (1988) 11–30.<br />
[8] A. Alak, D.W. Armstrong, Anal. Chem. 58 (1986) 582–584.<br />
[9] R. Marchelli, R. Virgili, E. Armani, A. Dossena, J.<br />
Chromatogr. 355 (1986) 354–357.<br />
[10] M. Sinibaldi, A. Messina, A.M. Girelli, Analyst (London)<br />
113 (1988) 1245–1247.<br />
[11] P. Marfey, Carlsberg Res. Commun. 49 (1984) 591–596.<br />
[12] Y. Nagata, K. Yamamoto, T. Shimojo, J. Chromatogr. 575<br />
(1992) 147–152.<br />
[13] E. Stahl, In: E. Stahl (Ed.), Thin <strong>layer</strong> chromatography, 2nd<br />
Edition, Springer, Berlin, 1969, p. 773.<br />
[14] G. Szókán, G. Mez, F. Hudecz, J. Chromatogr. 444 (1988)<br />
115–122.