Click here to download this presentation in PDF format. - Sybase
Click here to download this presentation in PDF format. - Sybase
Click here to download this presentation in PDF format. - Sybase

You also want an ePaper? Increase the reach of your titles
YUMPU automatically turns print PDFs into web optimized ePapers that Google loves.
Caveats<br />
• Optimizer analysis is not someth<strong>in</strong>g you’ll have <strong>to</strong> do every<br />
day. But, know<strong>in</strong>g the basics of how <strong>to</strong> do it can be helpful<br />
when the need arises<br />
• These are general steps and suggestions - your mileage may<br />
vary<br />
• Should you need <strong>to</strong> call Tech Support hav<strong>in</strong>g done an<br />
analysis yourself will help them focus the issue
Make Sure “The Same” is actually “The Same”<br />
When compar<strong>in</strong>g the same query on different<br />
datasets/servers “the same” may not be<br />
Make sure that datasets and configurations are as identical as is<br />
possible – if not the differences may result <strong>in</strong> differ<strong>in</strong>g plans<br />
• Use dump and load, if possible, <strong>to</strong> <strong>in</strong>sure datasets are the same<br />
• Row & page counts<br />
• Data distribution – are the values the same?<br />
• Server configs – <strong>to</strong>tal memory, cache pools and cache sizes,<br />
parallel<br />
Make sure <strong>to</strong> use the same version of ASE
Tools And Techniques Of Optimizer Analysis<br />
T<strong>here</strong> are several <strong>to</strong>ols at your disposal <strong>to</strong> perform an<br />
optimizer analysis<br />
ASE conta<strong>in</strong>s most of what you’ll need, such as:<br />
• showplan<br />
• statistics io and statistics time<br />
• traceon 302 and 310<br />
T<strong>here</strong> are external utilities that are important <strong>to</strong>o<br />
• optdiag (11.9.2 and above), ISQL<br />
• sp__optdiag – a non-<strong>Sybase</strong> proc that will output optdiag output<br />
without go<strong>in</strong>g <strong>to</strong> the command l<strong>in</strong>e. Not supported by <strong>Sybase</strong>,<br />
but very useful. Available at - http://www.sypron.nl/optdiag.html
Us<strong>in</strong>g A Force or An Abstract Plan<br />
As A Resolution or a Tool<br />
A force option or an AP may be the best short term<br />
resolution – force <strong>in</strong>dex, forceplan, Abstract Plan<br />
Analysis can take time. Consider us<strong>in</strong>g a force or and AP while<br />
you are analyz<strong>in</strong>g the situation or work<strong>in</strong>g with Tech Support<br />
• A force or an AP may be the best resolution for a handful of<br />
<strong>in</strong>efficient queries<br />
• You won’t be able <strong>to</strong> use a force option if you can’t get <strong>to</strong> the<br />
query, however an AP may be usable<br />
• A force or an AP can be used <strong>to</strong> verify that an access is efficient<br />
• See the P&T Guide for syntax
Tools And Techniques Of<br />
Optimizer Analysis – noexec and fm<strong>to</strong>nly<br />
When you want <strong>to</strong> get optimizer outputs without execut<strong>in</strong>g<br />
anyth<strong>in</strong>g<br />
noexec – when on anyth<strong>in</strong>g follow<strong>in</strong>g will not execute. Batch<br />
SQL will be compiled (optimized)<br />
• Useful when you want <strong>to</strong> analyze optimization but don’t want<br />
the query <strong>to</strong> run<br />
• Syntax set noexec {on | off}<br />
fm<strong>to</strong>nly – when on s<strong>to</strong>red procedures will not execute but will be<br />
compiled. Only procs that return a result set<br />
• Useful when you don’t want the proc <strong>to</strong> run but need <strong>to</strong> get<br />
optimizer outputs<br />
• Execute proc with recompile<br />
• Syntax set fm<strong>to</strong>nly {on | off}
Tools And Techniques Of<br />
Optimizer Analysis - showplan<br />
Showplan pr<strong>in</strong>ts the query plan used <strong>to</strong> execute the query<br />
Easy <strong>to</strong> read description of the query plan<br />
• Well known and documented extension of the set command -<br />
See P&TG for good write up on the output<br />
• Syntax set showplan {on | off}<br />
• sp_showplan returns showplan <strong>in</strong><strong>format</strong>ion for spids
Tools And Techniques Of<br />
Optimizer Analysis – set statistics io and time<br />
set statistics io pr<strong>in</strong>ts the type and quantity of I/O<br />
performed by a query<br />
• Syntax set statistics io {on | off}<br />
• Used as a fundamental measurement of performance - well<br />
documented<br />
• Statistics io will show how much physical and logical I/O is done<br />
for the query<br />
• If the query is long runn<strong>in</strong>g don’t bother with statistics io - use<br />
noexec
Tools And Techniques Of<br />
Optimizer Analysis - stats time<br />
• Statistics time measures parse and compile time, server<br />
time and elapsed time - well documented<br />
• Syntax set statistics time {on | off}<br />
• Times reported <strong>in</strong> milliseconds and CPU ticks<br />
• Useful when you need <strong>to</strong> see how long optimization is<br />
tak<strong>in</strong>g - parse and compile time<br />
• Can be used when noexec is on <strong>to</strong> measure parse and<br />
compile time
dbcc Traceon 302 & 310 Are at<br />
The Heart Of An In-Depth Analysis<br />
dbcc traceon 302 and 310 pr<strong>in</strong>t the optimizer’s cost estimates<br />
Pr<strong>in</strong>ts the optimizer’s <strong>in</strong>dex selection and ‘search eng<strong>in</strong>e’ phases<br />
• Traceon 302 – <strong>in</strong>dex cost<strong>in</strong>g and selection <strong>in</strong><strong>format</strong>ion. Compares the cost<br />
of a table scan <strong>to</strong> the cost of access<strong>in</strong>g an <strong>in</strong>dex<br />
• Tracon 310 – search eng<strong>in</strong>e phase. Physical I/O cost<strong>in</strong>g, Cache cost<strong>in</strong>g,<br />
Jo<strong>in</strong> order cost<strong>in</strong>g, can demote and <strong>in</strong>dex <strong>to</strong> a table scan<br />
• Both are documented <strong>in</strong> the “ASE P&T Guide - Query Tun<strong>in</strong>g”<br />
• It’s best <strong>to</strong> use them <strong>to</strong>gether<br />
• Syntax dbcc traceon (3604,302,310) use 3604 <strong>to</strong> send output <strong>to</strong> client,<br />
3605 <strong>to</strong> send <strong>to</strong> errorlog (not recommended)
Tools And Techniques Of<br />
Optimizer Analysis - traceon 302<br />
Traceon on 302 output is divided <strong>in</strong><strong>to</strong> five <strong>in</strong><strong>format</strong>ion<br />
blocks:<br />
• Table <strong>in</strong><strong>format</strong>ion block - row & page counts, datapage<br />
cluster ratio, number of partitions, size of largest partition,<br />
partition skew (used <strong>in</strong> cost<strong>in</strong>g a parallel query) and<br />
correlation name if one is used<br />
• Check that row and page counts are reasonable
Tools And Techniques Of<br />
Optimizer Analysis - traceon 302<br />
*******************************<br />
Beg<strong>in</strong>n<strong>in</strong>g selection of qualify<strong>in</strong>g <strong>in</strong>dexes for table<br />
'li_2',varno = 0, objectid 304004114.<br />
The table (Allpages) has 600572 rows, 40646<br />
pages,<br />
Data Page Cluster Ratio 0.999990<br />
The table has 4 partitions.<br />
The largest partition has 40639 pages.<br />
The partition skew is 3.999114.
Tools And Techniques Of<br />
Optimizer Analysis - traceon 302<br />
Base cost block - conta<strong>in</strong>s the cost of a table scan <strong>in</strong> rows and<br />
pages. Chosen I/O size, cache name and id and the buffer<br />
replacement strategy.<br />
• Used <strong>to</strong> compare <strong>to</strong> all other access that are costed<br />
Table scan cost is 600572 rows, 40646 pages,<br />
us<strong>in</strong>g no data prefetch (size 2K I/O),<br />
<strong>in</strong> data cache 'default data cache' (cacheid 0)<br />
with MRU replacement
Tools And Techniques Of<br />
Optimizer Analysis - traceon 302<br />
The Clause Block - Conta<strong>in</strong>s <strong>in</strong>fo about the clause(s) be<strong>in</strong>g costed<br />
for the current table. SARGs are costed first followed by jo<strong>in</strong>s. For<br />
jo<strong>in</strong>s current table is always the outer (left) <strong>in</strong> the clause.<br />
• Are the clauses of the query listed? SARGs and jo<strong>in</strong>s. If you don’t<br />
see it, the optimizer isn’t cost<strong>in</strong>g it.<br />
• Are t<strong>here</strong> any unknown SARG values?<br />
• Will use a default selectivity value or <strong>to</strong>tal density based on the<br />
SARG opera<strong>to</strong>r<br />
• Usually caused by local variable <strong>in</strong> a query or proc<br />
• Are t<strong>here</strong> any mismatched datatypes?<br />
• See the P&T Guide for more <strong>in</strong><strong>format</strong>ion on datatype<br />
mismatches
Tools And Techniques Of<br />
Optimizer Analysis - traceon 302<br />
Clause Block cont. -<br />
Select<strong>in</strong>g best <strong>in</strong>dex for the SEARCH CLAUSE:<br />
t1.l_partkey unknown-value<br />
• If SARGs/jo<strong>in</strong>s not pr<strong>in</strong>ted may be datatype<br />
mismatch<br />
Select<strong>in</strong>g best <strong>in</strong>dex for the JOIN CLAUSE:<br />
l.l_orderkey = o.o_orderkey<br />
l.l_orderkey < 10000
Tools And Techniques Of<br />
Optimizer Analysis - traceon 302<br />
Column Block - Conta<strong>in</strong>s selectivity of all columns <strong>in</strong> the clause(s).<br />
Selectivity is based on the statistics and the clause(s).<br />
Estimated selectivity for B, selectivity = 0.001283,<br />
upper limit = 0.052642.<br />
‘selectivity’ - Range cell density<br />
‘upper limit’ – weight of qualify<strong>in</strong>g cell<br />
No statistics available for colA, us<strong>in</strong>g the default<br />
range selectivity <strong>to</strong> estimate selectivity.<br />
Estimated selectivity for colA, selectivity = 0.330000.<br />
• No statistics - optimizer will have no <strong>in</strong>fo about <strong>this</strong> column<br />
• Consider add<strong>in</strong>g statistics <strong>to</strong> the column – Highly recommended<br />
• Default selectivity value used will depend on the opera<strong>to</strong>r
Tools And Techniques Of<br />
Optimizer Analysis - traceon 302<br />
Index Selection Block - pr<strong>in</strong>ts <strong>in</strong>fo on all qualify<strong>in</strong>g <strong>in</strong>dexes for<br />
the clause(s). Scan and filter selectivity values, estimated<br />
number of rows and pages, <strong>in</strong>dex height and cluster ratios.<br />
• Scan selectivity used <strong>to</strong> estimate the number of <strong>in</strong>dex rows<br />
and pages <strong>to</strong> be read<br />
• Filter selectivity used <strong>to</strong> estimate the number of data pages <strong>to</strong><br />
be accessed<br />
• Used <strong>to</strong> estimate the cost of access<strong>in</strong>g composite <strong>in</strong>dexes<br />
when SARG <strong>in</strong>cludes more than one column of the <strong>in</strong>dex<br />
• Adds another layer of filter<strong>in</strong>g <strong>to</strong> <strong>in</strong>dex cost<strong>in</strong>g
Tools And Techniques Of<br />
Optimizer Analysis - traceon 302<br />
• The cluster ratios for the <strong>in</strong>dex are pr<strong>in</strong>ted -<br />
Data Row Cluster Ratio 0.030877,<br />
Index Page Cluster Ratio 0.998118,<br />
Data Page Cluster Ratio 0.023310<br />
• Data row cluster ratio - how well clustered <strong>in</strong>dex rows are <strong>in</strong> relation<br />
<strong>to</strong> data rows. Used <strong>to</strong> cost a non-clustered or DOL clustered <strong>in</strong>dex<br />
• Data page cluster ratio - used <strong>to</strong> estimate the effectiveness of large<br />
I/O when us<strong>in</strong>g <strong>this</strong> <strong>in</strong>dex <strong>to</strong> access data pages<br />
• Index page cluster ratio - used <strong>to</strong> estimate the cost of large I/O for<br />
queries that need <strong>to</strong> read many leaf pages from a non-clustered or<br />
DOL clustered <strong>in</strong>dex<br />
• The lower the cluster ratio the less cluster<strong>in</strong>g t<strong>here</strong> is, and the less<br />
likely the <strong>in</strong>dex or a large I/O will be used
Tools And Techniques Of<br />
Optimizer Analysis - traceon 302<br />
Estimat<strong>in</strong>g selectivity of <strong>in</strong>dex 'l<strong>in</strong>eitem_sdate',<br />
<strong>in</strong>did 5<br />
scan selectivity 0.002300,<br />
filter selectivity 0.000000<br />
1 rows, 4 pages, <strong>in</strong>dex height 2,<br />
Data Row Cluster Ratio 0.030877,<br />
Index Page Cluster Ratio 0.998118,<br />
Data Page Cluster Ratio 0.023310
Tools And Techniques Of<br />
Optimizer Analysis - traceon 302<br />
Best Access Block - pr<strong>in</strong>ts the best access for the clauses<br />
exam<strong>in</strong>ed <strong>in</strong> <strong>this</strong> section of 302 for the current table. Repeats<br />
much of the <strong>in</strong>dex selection <strong>in</strong>fo also conta<strong>in</strong>s the chosen I/O<br />
size, the cache <strong>to</strong> be used and the replacement strategy<br />
The best qualify<strong>in</strong>g <strong>in</strong>dex is <strong>in</strong>d_name<br />
Best qualify<strong>in</strong>g access is a table scan<br />
• This is not the f<strong>in</strong>al word on which access will be used, that<br />
happens later <strong>in</strong> the search eng<strong>in</strong>e phase. This access will<br />
however be used <strong>in</strong> that phase
Tools And Techniques Of<br />
Optimizer Analysis - traceon 310<br />
The FINAL PLAN at the end of 310 is the plan that will be<br />
executed – <strong>this</strong> is the optimizer’s f<strong>in</strong>al word <strong>in</strong> the plan<br />
• Pr<strong>in</strong>ts the first plan costed and each subsequently cheaper plan<br />
• Traceon 310 is not currently as well organized as 302<br />
• This is the end of the optimization phase of query process<strong>in</strong>g
Tools And Techniques Of<br />
Optimizer Analysis - traceon 302<br />
QUERY IS CONNECTED<br />
Number of tables <strong>in</strong> jo<strong>in</strong>: 6<br />
Number of tables considered at a time: 4<br />
Table count sett<strong>in</strong>g: 4<br />
• Indicates that the query is not a Cart product. In <strong>this</strong> case t<strong>here</strong><br />
are 6 tables <strong>in</strong> the jo<strong>in</strong> and 4 at a time will be costed<br />
IGNORING THIS PERMUTATION<br />
0 - 1 - 2 - 5 -<br />
• Indicates that <strong>this</strong> jo<strong>in</strong> order has no plans cheaper than the<br />
cheapest one found <strong>to</strong> <strong>this</strong> po<strong>in</strong>t
Tools And Techniques Of<br />
Optimizer Analysis - traceon 310<br />
NEW PLAN (<strong>to</strong>tal cost = 1080):<br />
• A plan that is cheapest <strong>to</strong> <strong>this</strong> po<strong>in</strong>t has been costed, the cost is<br />
pr<strong>in</strong>ted<br />
TOTAL # PERMUTATIONS: 864<br />
• This is the <strong>to</strong>tal number of jo<strong>in</strong> orders exam<strong>in</strong>ed by the optimizer<br />
TOTAL # PLANS CONSIDERED: 1997<br />
• This is the number of plans that were costed by the optimizer<br />
CACHE USED BY THIS PLAN:<br />
CacheID = 0: (2K) 50920 (4K) 0 (8K) 0<br />
(16K) 43520<br />
• This is the amount and sizes of the caches <strong>to</strong> be used
Tools And Techniques Of<br />
Optimizer Analysis - traceon 310<br />
P A R A LLEL:<br />
number of worker processes = 20<br />
max parallel degree = 5<br />
m<strong>in</strong>(configured,set) parallel degree = 5<br />
m<strong>in</strong>(configured,set) hash scan parallel<br />
degree = 5<br />
• This is parallelism that will be used for <strong>this</strong> query plan
Tools And Techniques Of<br />
Optimizer Analysis - traceon 310<br />
This is query plan that will be executed (only a portion <strong>in</strong> <strong>this</strong> case)<br />
FINAL PLAN (<strong>to</strong>tal cost = 641):<br />
varno=5 (nrn_cis_cust) <strong>in</strong>dexid=0 ()<br />
path=0xf7740800 pathtype=sclause<br />
method=NESTED ITERATION<br />
scanthreads=1 outerrows=1 rows=105<br />
jo<strong>in</strong>sel=1.000000 scanpgs=63978 data_prefetch=YES<br />
data_iosize=16 data_bufreplace=LRU<br />
scanlio=142 scanpio=469
Tools And Techniques Of<br />
Optimizer Analysis - Optdiag<br />
Command l<strong>in</strong>e utility designed <strong>to</strong> allow you <strong>to</strong> read write<br />
and simulate statistics<br />
Most statistics are s<strong>to</strong>red as varb<strong>in</strong>ary and are hard, at best, <strong>to</strong><br />
read and write <strong>in</strong> the system tables.<br />
• Use <strong>to</strong> check the state of the statistics<br />
• Last time statistics were modified<br />
• Check table/<strong>in</strong>dex fragmentation - empty pages, forwarded<br />
rows, deleted rows, space utilization and large I/O efficiency<br />
• Check for highly duplicated values<br />
Check P&TG for syntax
Tools And Techniques Of<br />
Optimizer Analysis - Optdiag<br />
Statistics for table: "t2"<br />
Data page count: 14249<br />
Empty data page count:16<br />
Data row count: 200000.00000<br />
Forwarded row count: 527.00000<br />
Deleted row count: 42.000000<br />
Data page CR count: 5811.000000<br />
Index page CR count: 311.000000<br />
Data row CR count: 44579.000000<br />
Derived statistics:<br />
Data page cluster ratio: 0.9930327868852459<br />
Index page cluster ratio: 0.9986085343228200<br />
Data row cluster ratio: 0.9995110244218134
Tools And Techniques Of<br />
Optimizer Analysis - Optdiag<br />
Statistics for column: ”col_A"<br />
Last update of column statistics: Mar 22 2000<br />
11:44:16:053AM<br />
Range cell density: 0.0000050000000000<br />
Total density: 0.0000050000000000<br />
Range selectivity: default used (0.33)<br />
In between selectivity: default used (0.25)<br />
When chang<strong>in</strong>g the default selectivity values -<br />
Range selectivity: 0.00033
Tools And Techniques Of<br />
Optimizer Analysis - Optdiag<br />
The his<strong>to</strong>gram - describes the distribution of values <strong>in</strong> the<br />
column.<br />
• Two types of cells - Range Cells conta<strong>in</strong> more than one value.<br />
Frequency Count Cells conta<strong>in</strong> only one value, will appear for<br />
highly duplicated values. FC are the most accurate form of cell<br />
• Weight - the percentage of the column occupied by the value(s)<br />
<strong>in</strong> the cell. The higher the weight the more the value(s) is<br />
duplicated<br />
• A very high weight will <strong>in</strong>dicate highly duplicated values - not<br />
bad but be aware of it
Tools And Techniques Of<br />
Optimizer Analysis - Optdiag<br />
• Opera<strong>to</strong>r - helps describe the type of cell. The weights are<br />
what you want <strong>to</strong> look at.<br />
• Value - <strong>this</strong> is the boundary value of the cell. Cell <strong>in</strong>cludes the<br />
upper boundary (value) but not the lower boundary (value of<br />
previous cell)<br />
Check the number of cells. If you have duplicated values or<br />
range SARGs consider <strong>in</strong>creas<strong>in</strong>g the requested step count.
Tools And Techniques Of<br />
Optimizer Analysis - Optdiag<br />
Step Weight Value<br />
1 0.00000000
Conclusion<br />
Optimizer analysis is not someth<strong>in</strong>g you need <strong>to</strong> do all the<br />
time<br />
• But, if you need <strong>to</strong> do it hav<strong>in</strong>g <strong>in</strong><strong>format</strong>ion on how <strong>to</strong> do it<br />
may help you resolve issues quickly and avoid them <strong>in</strong><br />
the future
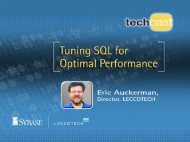
More Optimizer<br />
Resources and Help<br />
• The latest Performance and Tun<strong>in</strong>g Guide<br />
• Don’t be put off by the ASE 12.0 <strong>in</strong> the title, it covers the 11.9.2<br />
features/functionality <strong>to</strong>o<br />
• http://sybooks.sybase.com/onl<strong>in</strong>ebooks/group-as/asg1200e<br />
• Any “What’s New” docs for a new ASE release<br />
• Tech Docs at <strong>Sybase</strong> Support<br />
• http://tech<strong>in</strong>fo.sybase.com/css/tech<strong>in</strong>fo.nsf/Home
More Optimizer<br />
Resources and Help<br />
• The <strong>Sybase</strong> Cus<strong>to</strong>mer newsgroups<br />
• http://support.sybase.com/newsgroups<br />
• The <strong>Sybase</strong> list server<br />
• SYBASE-L@LISTSERV.UCSB.EDU<br />
• The external <strong>Sybase</strong> FAQ<br />
• http://www.isug.com/<strong>Sybase</strong>_FAQ/<br />
• Jo<strong>in</strong> the ISUG, ISUG Technical Journal, feature requests<br />
• http://www.isug.com
<strong>Sybase</strong> Developer Network (SDN)<br />
Additional Resources for Developers/DBAs<br />
• S<strong>in</strong>gle po<strong>in</strong>t of access <strong>to</strong> developer software,<br />
services, and up-<strong>to</strong>-date technical <strong>in</strong><strong>format</strong>ion:<br />
• White papers and documentation<br />
• Collaboration with other developers and <strong>Sybase</strong><br />
eng<strong>in</strong>eers<br />
• Code samples and beta programs<br />
• Technical record<strong>in</strong>gs<br />
• Free software<br />
• Jo<strong>in</strong> <strong>to</strong>day: www.sybase.com/developer