Tatry mountain resorts, a.s. Peer Group Presentation
Tatry mountain resorts, a.s. Peer Group Presentation
Tatry mountain resorts, a.s. Peer Group Presentation

You also want an ePaper? Increase the reach of your titles
YUMPU automatically turns print PDFs into web optimized ePapers that Google loves.
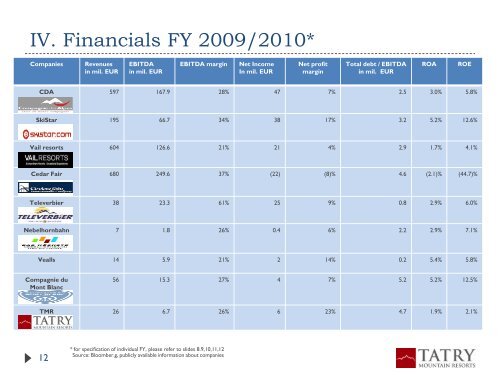
IV. Financials FY 2009/2010*<br />
Companies<br />
Revenues<br />
in mil. EUR<br />
EBITDA<br />
in mil. EUR<br />
EBITDA margin<br />
Net Income<br />
In mil. EUR<br />
Net profit<br />
margin<br />
Total debt / EBITDA<br />
in mil. EUR<br />
ROA<br />
ROE<br />
CDA 597 167.9 28% 47 7% 2.5 3.0% 5.8%<br />
SkiStar 195 66.7 34% 38 17% 3.2 5.2% 12.6%<br />
Vail <strong>resorts</strong> 604 126.6 21% 21 4% 2.9 1.7% 4.1%<br />
Cedar Fair 680 249.6 37% (22) (8)% 4.6 (2.1)% (44.7)%<br />
Televerbier 38 23.3 61% 25 9% 0.8 2.9% 6.0%<br />
Nebelhornbahn 7 1.8 26% 0.4 6% 2.2 2.9% 7.1%<br />
Vealls 14 5.9 21% 2 14% 0.2 5.4% 5.8%<br />
Compagnie du<br />
Mont Blanc<br />
56 15.3 27% 4 7% 5.2 5.2% 12.5%<br />
TMR 26 6.7 26% 6 23% 4.7 1.9% 2.1%<br />
12<br />
* for specification of individual FY, please refer to slides 8.9,10,11,12<br />
Source: Bloomber.g, publicly available information about companies