VIDYASAGAR UNIVERSITY JOURNAL OF COMMERCE
VIDYASAGAR UNIVERSITY JOURNAL OF COMMERCE
VIDYASAGAR UNIVERSITY JOURNAL OF COMMERCE

Create successful ePaper yourself
Turn your PDF publications into a flip-book with our unique Google optimized e-Paper software.
A DISCRIMINANT ANALYSIS AND PREDICTION <strong>OF</strong> LIQUIDITY-PR<strong>OF</strong>ITABILITY<br />
balance sheet figures as on 31 st march, 2008, as published in the data book (CMIE) on 8 th<br />
January 2008 are available. Thus, 20 companies are selected. Out of these, based on<br />
operating profit, 10 companies are profit-making and 10 are loss-making. In the course of<br />
analysis in this study, twelve financial ratios are selected which cover liquidity and<br />
profitability viz. current ratio (CR), cash position ratio (CPR), return on investment ratio<br />
(ROIR), earning per share (EPS). Among statistical tools, Arithmetic Mean, D-scorediscriminant<br />
analysis (DA), etc. have been applied. The values of the ratios are taken as<br />
published or calculated from the figures published. The uses of all these tools at different<br />
places have been made in the light of requirement of analysis.<br />
Limitations of the Study<br />
The study suffers from certain limitations. These are written as follows :<br />
• Study solely depends on the published financial data, so it is subject to all limitations<br />
that are inherent in the condensed published financial statements.<br />
• We have selected twenty private sector pharmaceutical companies only.<br />
• Again our study is based on the data and information relating to the year 2006-07.<br />
Findings of the Study<br />
Liquidity Position based on Discriminant Analysis<br />
• The purpose of discriminant analysis is to identify liquidity position from two<br />
liquidity ratios (i.e., CR and CPR) as inputs which are relevant in distinguishing<br />
between profit-making and loss-making companies. The mean values of the<br />
ratios for both the groups are shown in Tables 1 and 2.<br />
• Table 3 reveals the coefficients of discriminant function for the selected two<br />
ratios. It is thus expressed as : D = 1.18 X 1 – 0.91 X 2 .<br />
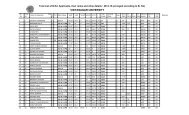
Table-1: Liquidity Indicators of Selected Profit-making Companies<br />
Profit-making companies<br />
Liquidity ratios<br />
1. Cadila Healthcare Ltd.<br />
2. Cipla Ltd.<br />
3. Glaxosmithkline Pharma Ltd.<br />
4. Ipca Laboratories Ltd.<br />
5. Lupin Ltd.<br />
6. Nicholas Piramal India Ltd.<br />
7. Panacea Biotec Ltd.<br />
8. Ranbaxy Laboratories Ltd.<br />
9. Torrent Pharmaceuticals Ltd.<br />
10. Wockhardt Ltd.<br />
Mean<br />
S.E. of mean<br />
CR<br />
1.41<br />
2.78<br />
1.30<br />
1.89<br />
2.47<br />
1.05<br />
2.50<br />
1.11<br />
2.42<br />
3.46<br />
2.04<br />
0.26<br />
CPR<br />
0.03<br />
0.25<br />
0.14<br />
0.05<br />
0.99<br />
0.09<br />
1.12<br />
0.04<br />
0.07<br />
2.22<br />
0.50<br />
0.23<br />
102 Vidyasagar University Journal of Commerce