VIDYASAGAR UNIVERSITY JOURNAL OF COMMERCE
VIDYASAGAR UNIVERSITY JOURNAL OF COMMERCE
VIDYASAGAR UNIVERSITY JOURNAL OF COMMERCE

Create successful ePaper yourself
Turn your PDF publications into a flip-book with our unique Google optimized e-Paper software.
WTO AND INDIA: TIME FOR RENAISSANCE <strong>OF</strong> THE FARM SECTOR<br />
relationship. This theoretical concept has not worked out well in Indian economy, where one<br />
sector’s (industry) growth is on a continuous acceleration and the other sector’s (farm)<br />
growth is on a continuous deceleration. Hence, the mutual dependence has not proved<br />
prolific in the last few years. Indian farm sector is also playing a significant role in the<br />
international trade. The export of farm products constitutes a significant portion of the total<br />
exports. In percentage terms, agricultural products constituted 10.95 % of total national<br />
export in 2005-06.<br />
Indian farm sector has still not entered the phase of take-off. Besides the conventional<br />
challenges of inadequate production and less productivity, new challenges are also posing<br />
newer threats. The WTO agreement at this juncture is also enhancing the criticality of the<br />
farm sector by way of its Agreement on Agriculture (AoA) clause. The AoA clauses<br />
specifically ask for withdrawing domestic and export subsidies, and allow market<br />
accessibility to member nations. Both the internal and external challenges are issues of<br />
concern for the farm sector. Indian farm sector has not matured enough in the last few<br />
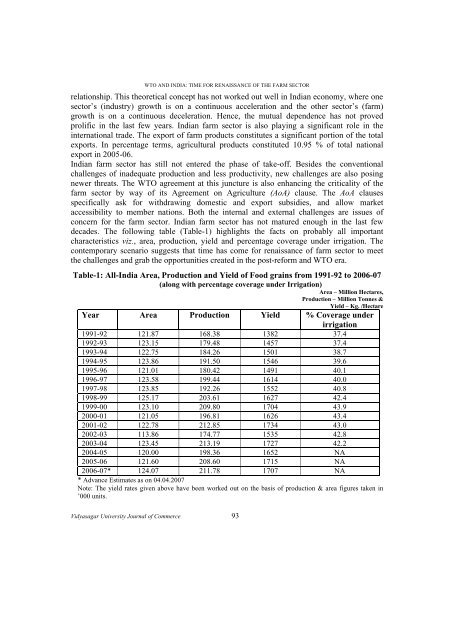
decades. The following table (Table-1) highlights the facts on probably all important<br />
characteristics viz., area, production, yield and percentage coverage under irrigation. The<br />
contemporary scenario suggests that time has come for renaissance of farm sector to meet<br />
the challenges and grab the opportunities created in the post-reform and WTO era.<br />
Table-1: All-India Area, Production and Yield of Food grains from 1991-92 to 2006-07<br />
(along with percentage coverage under Irrigation)<br />
Area – Million Hectares,<br />
Production – Million Tonnes &<br />
Yield – Kg. /Hectare<br />
Year Area Production Yield % Coverage under<br />
irrigation<br />
1991-92 121.87 168.38 1382 37.4<br />
1992-93 123.15 179.48 1457 37.4<br />
1993-94 122.75 184.26 1501 38.7<br />
1994-95 123.86 191.50 1546 39.6<br />
1995-96 121.01 180.42 1491 40.1<br />
1996-97 123.58 199.44 1614 40.0<br />
1997-98 123.85 192.26 1552 40.8<br />
1998-99 125.17 203.61 1627 42.4<br />
1999-00 123.10 209.80 1704 43.9<br />
2000-01 121.05 196.81 1626 43.4<br />
2001-02 122.78 212.85 1734 43.0<br />
2002-03 113.86 174.77 1535 42.8<br />
2003-04 123.45 213.19 1727 42.2<br />
2004-05 120.00 198.36 1652 NA<br />
2005-06 121.60 208.60 1715 NA<br />
2006-07* 124.07 211.78 1707 NA<br />
* Advance Estimates as on 04.04.2007<br />
Note: The yield rates given above have been worked out on the basis of production & area figures taken in<br />
’000 units.<br />
Vidyasagar University Journal of Commerce 93