spatial and temporal variability of the solar resource in the united ...
spatial and temporal variability of the solar resource in the united ...
spatial and temporal variability of the solar resource in the united ...

You also want an ePaper? Increase the reach of your titles
YUMPU automatically turns print PDFs into web optimized ePapers that Google loves.
SPATIAL AND TEMPORAL VARIABILITY OF THE SOLAR RESOURCE<br />
IN THE UNITED STATES<br />
Stephen Wilcox<br />
National Renewable Energy Laboratory<br />
1617 Cole Blvd.<br />
Golden, CO 80401<br />
e-mail: stephen.wilcox@nrel.gov<br />
Christian A. Gueymard<br />
Solar Consult<strong>in</strong>g Services<br />
P.O. Box 392<br />
Colebrook, NH 03576<br />
e-mail: Chris@SolarConsult<strong>in</strong>gServices.com<br />
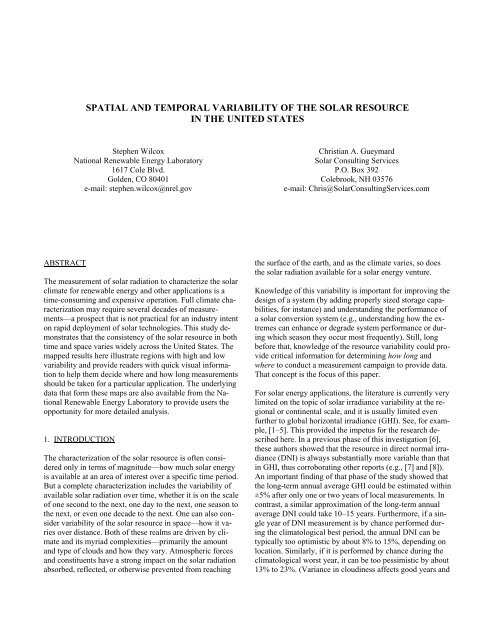
ABSTRACT<br />
The measurement <strong>of</strong> <strong>solar</strong> radiation to characterize <strong>the</strong> <strong>solar</strong><br />
climate for renewable energy <strong>and</strong> o<strong>the</strong>r applications is a<br />
time-consum<strong>in</strong>g <strong>and</strong> expensive operation. Full climate characterization<br />
may require several decades <strong>of</strong> measurements—a<br />
prospect that is not practical for an <strong>in</strong>dustry <strong>in</strong>tent<br />
on rapid deployment <strong>of</strong> <strong>solar</strong> technologies. This study demonstrates<br />
that <strong>the</strong> consistency <strong>of</strong> <strong>the</strong> <strong>solar</strong> <strong>resource</strong> <strong>in</strong> both<br />
time <strong>and</strong> space varies widely across <strong>the</strong> United States. The<br />
mapped results here illustrate regions with high <strong>and</strong> low<br />
<strong>variability</strong> <strong>and</strong> provide readers with quick visual <strong>in</strong>formation<br />
to help <strong>the</strong>m decide where <strong>and</strong> how long measurements<br />
should be taken for a particular application. The underly<strong>in</strong>g<br />
data that form <strong>the</strong>se maps are also available from <strong>the</strong> National<br />
Renewable Energy Laboratory to provide users <strong>the</strong><br />
opportunity for more detailed analysis.<br />
1. INTRODUCTION<br />
The characterization <strong>of</strong> <strong>the</strong> <strong>solar</strong> <strong>resource</strong> is <strong>of</strong>ten considered<br />
only <strong>in</strong> terms <strong>of</strong> magnitude—how much <strong>solar</strong> energy<br />
is available at an area <strong>of</strong> <strong>in</strong>terest over a specific time period.<br />
But a complete characterization <strong>in</strong>cludes <strong>the</strong> <strong>variability</strong> <strong>of</strong><br />
available <strong>solar</strong> radiation over time, whe<strong>the</strong>r it is on <strong>the</strong> scale<br />
<strong>of</strong> one second to <strong>the</strong> next, one day to <strong>the</strong> next, one season to<br />
<strong>the</strong> next, or even one decade to <strong>the</strong> next. One can also consider<br />
<strong>variability</strong> <strong>of</strong> <strong>the</strong> <strong>solar</strong> <strong>resource</strong> <strong>in</strong> space—how it varies<br />
over distance. Both <strong>of</strong> <strong>the</strong>se realms are driven by climate<br />
<strong>and</strong> its myriad complexities—primarily <strong>the</strong> amount<br />
<strong>and</strong> type <strong>of</strong> clouds <strong>and</strong> how <strong>the</strong>y vary. Atmospheric forces<br />
<strong>and</strong> constituents have a strong impact on <strong>the</strong> <strong>solar</strong> radiation<br />
absorbed, reflected, or o<strong>the</strong>rwise prevented from reach<strong>in</strong>g<br />
<strong>the</strong> surface <strong>of</strong> <strong>the</strong> earth, <strong>and</strong> as <strong>the</strong> climate varies, so does<br />
<strong>the</strong> <strong>solar</strong> radiation available for a <strong>solar</strong> energy venture.<br />
Knowledge <strong>of</strong> this <strong>variability</strong> is important for improv<strong>in</strong>g <strong>the</strong><br />
design <strong>of</strong> a system (by add<strong>in</strong>g properly sized storage capabilities,<br />
for <strong>in</strong>stance) <strong>and</strong> underst<strong>and</strong><strong>in</strong>g <strong>the</strong> performance <strong>of</strong><br />
a <strong>solar</strong> conversion system (e.g., underst<strong>and</strong><strong>in</strong>g how <strong>the</strong> extremes<br />
can enhance or degrade system performance or dur<strong>in</strong>g<br />
which season <strong>the</strong>y occur most frequently). Still, long<br />
before that, knowledge <strong>of</strong> <strong>the</strong> <strong>resource</strong> <strong>variability</strong> could provide<br />
critical <strong>in</strong>formation for determ<strong>in</strong><strong>in</strong>g how long <strong>and</strong><br />
where to conduct a measurement campaign to provide data.<br />
That concept is <strong>the</strong> focus <strong>of</strong> this paper.<br />
For <strong>solar</strong> energy applications, <strong>the</strong> literature is currently very<br />
limited on <strong>the</strong> topic <strong>of</strong> <strong>solar</strong> irradiance <strong>variability</strong> at <strong>the</strong> regional<br />
or cont<strong>in</strong>ental scale, <strong>and</strong> it is usually limited even<br />
fur<strong>the</strong>r to global horizontal irradiance (GHI). See, for example,<br />
[1–5]. This provided <strong>the</strong> impetus for <strong>the</strong> research described<br />
here. In a previous phase <strong>of</strong> this <strong>in</strong>vestigation [6],<br />
<strong>the</strong>se authors showed that <strong>the</strong> <strong>resource</strong> <strong>in</strong> direct normal irradiance<br />
(DNI) is always substantially more variable than that<br />
<strong>in</strong> GHI, thus corroborat<strong>in</strong>g o<strong>the</strong>r reports (e.g., [7] <strong>and</strong> [8]).<br />
An important f<strong>in</strong>d<strong>in</strong>g <strong>of</strong> that phase <strong>of</strong> <strong>the</strong> study showed that<br />
<strong>the</strong> long-term annual average GHI could be estimated with<strong>in</strong><br />
±5% after only one or two years <strong>of</strong> local measurements. In<br />
contrast, a similar approximation <strong>of</strong> <strong>the</strong> long-term annual<br />
average DNI could take 10–15 years. Fur<strong>the</strong>rmore, if a s<strong>in</strong>gle<br />
year <strong>of</strong> DNI measurement is by chance performed dur<strong>in</strong>g<br />
<strong>the</strong> climatological best period, <strong>the</strong> annual DNI can be<br />
typically too optimistic by about 8% to 15%, depend<strong>in</strong>g on<br />
location. Similarly, if it is performed by chance dur<strong>in</strong>g <strong>the</strong><br />
climatological worst year, it can be too pessimistic by about<br />
13% to 23%. (Variance <strong>in</strong> cloud<strong>in</strong>ess affects good years <strong>and</strong>
ad years <strong>in</strong> roughly equal amounts, but additional aerosol<br />
burdens from volcanic activity can only lower DNI—hence,<br />
<strong>the</strong> stronger <strong>variability</strong> effect dur<strong>in</strong>g bad years.)<br />
Although modeled <strong>solar</strong> data are commonly available, <strong>the</strong><br />
source <strong>of</strong> data with <strong>the</strong> lowest uncerta<strong>in</strong>ty is generally obta<strong>in</strong>ed<br />
from radiometers located at a target location. Data<br />
sets spann<strong>in</strong>g decades are not only accurate measures <strong>of</strong> <strong>the</strong><br />
magnitude but also a def<strong>in</strong>itive source <strong>of</strong> data to determ<strong>in</strong>e<br />
<strong>variability</strong>. A s<strong>in</strong>gle year <strong>of</strong> data—no matter how accurate—<br />
cannot assume to represent all years by any statistical measure<br />
(especially for DNI) because climate factors <strong>in</strong>fluence<br />
radiation differently each year. However, if advance knowledge<br />
<strong>in</strong>dicates an area <strong>of</strong> <strong>in</strong>terest has low <strong>in</strong>terannual <strong>variability</strong>,<br />
one could reason that a shorter period <strong>of</strong> time could<br />
yield a data set likely to hold means <strong>and</strong> <strong>variability</strong> similar<br />
to those seen over longer time spans. Likewise, knowledge<br />
<strong>of</strong> lower <strong>spatial</strong> <strong>variability</strong> could provide justification for<br />
us<strong>in</strong>g a <strong>solar</strong> <strong>resource</strong> data set from <strong>the</strong> measurement location<br />
for a location some distance away. Because <strong>of</strong> <strong>the</strong> high<br />
cost <strong>of</strong> <strong>solar</strong> measurements, <strong>the</strong>se are attractive prospects.<br />
Knowledge <strong>of</strong> <strong>variability</strong> <strong>the</strong>n becomes valuable when decid<strong>in</strong>g<br />
how long to make measurements at a particular location<br />
<strong>and</strong> whe<strong>the</strong>r <strong>the</strong> character <strong>of</strong> <strong>the</strong> <strong>solar</strong> <strong>resource</strong> at that<br />
location can be extended to o<strong>the</strong>r nearby locations.<br />
2. METHODOLOGY FOR IRRADIANCE VARIABLITY<br />
ANALYSIS<br />
The <strong>temporal</strong> COV is<br />
C t = σ t / < E p >.<br />
The COV <strong>in</strong> this report are expressed as percentages. Although<br />
<strong>the</strong> actual scatter <strong>in</strong> <strong>the</strong> data is likely larger than<br />
what <strong>the</strong> COV <strong>in</strong>dicates, <strong>the</strong> COV expresses <strong>the</strong> likelihood<br />
<strong>of</strong> data fall<strong>in</strong>g with<strong>in</strong> <strong>the</strong> result<strong>in</strong>g value range around <strong>the</strong><br />
mean. More specifically, outlier years could exceed <strong>the</strong><br />
range def<strong>in</strong>ed by ±σ t because, by assum<strong>in</strong>g a Gaussian<br />
distribution <strong>of</strong> <strong>the</strong> monthly or annual total irradiance, <strong>the</strong>re<br />
is only a 66% likelihood that measurements for any given<br />
year will be with<strong>in</strong> <strong>the</strong> distance from <strong>the</strong> mean just stated.<br />
Alternatively, one can assume a 95% likelihood that <strong>the</strong><br />
<strong>in</strong>dividual data po<strong>in</strong>ts are with<strong>in</strong> a range twice as wide (i.e.,<br />
±2σ t ). For applications <strong>in</strong> which so-called “bankable<br />
data” are required, <strong>and</strong> only a 5% marg<strong>in</strong> <strong>of</strong> error is admissible,<br />
<strong>the</strong> use <strong>of</strong> <strong>the</strong> 95% confidence rule is highly recommended.<br />
This translates <strong>in</strong>to doubl<strong>in</strong>g all <strong>the</strong> COV numbers<br />
provided here.<br />
Us<strong>in</strong>g results from <strong>the</strong> NSRDB, <strong>the</strong> analysis just described<br />
was performed for DNI <strong>and</strong> for a global tilt irradiance (GTI)<br />
modeled for a surface tilted at <strong>the</strong> location’s latitude [10].<br />
GTI is a comb<strong>in</strong>ation <strong>of</strong> DNI <strong>and</strong> diffuse irradiance, which<br />
normally varies <strong>in</strong> opposition to DNI. Therefore, GTI’s <strong>variability</strong><br />
must be lower than that <strong>of</strong> DNI.<br />
Eight years (1998–2005) <strong>of</strong> data from <strong>the</strong> National Solar<br />
Radiation Database (NSRDB) [9] have been analyzed <strong>in</strong><br />
both realms <strong>of</strong> <strong>temporal</strong> <strong>and</strong> <strong>spatial</strong> <strong>variability</strong>. The analysis<br />
summarizes <strong>the</strong> values <strong>in</strong> each 10-x-10-km cell <strong>of</strong> <strong>the</strong> satellite-derived<br />
irradiance data <strong>in</strong> <strong>the</strong> NSRDB (derived from <strong>the</strong><br />
State University <strong>of</strong> New York at Albany model, hereafter<br />
SUNY model) <strong>and</strong> calculated monthly mean daily totals,<br />
annual mean daily totals, <strong>and</strong> <strong>the</strong> mean daily total for <strong>the</strong><br />
entire eight-year period.<br />
2.1 Temporal Variability<br />
For each cell, eight annual values are used to calculate a<br />
coefficient <strong>of</strong> variation (COV). The eight-year mean irradiance<br />
<strong>and</strong> each annual value E i are used to derive <strong>the</strong><br />
st<strong>and</strong>ard deviation <strong>of</strong> <strong>the</strong> data set, accord<strong>in</strong>g to<br />
⎡ i=8<br />
⎤<br />
σ t = ⎢ ∑(< E p >−E i ) 2 /8⎥<br />
⎣ ⎢<br />
⎦ ⎥<br />
i=1<br />
1/2<br />
.<br />
Fig. 1: Interannual COV for DNI. Note similar patterns with<br />
GTI <strong>in</strong> Fig. 2, but higher magnitude for DNI by about a factor<br />
<strong>of</strong> two.
Januaries, Februaries, etc.). The results, expressed as percentages,<br />
represent a measure <strong>of</strong> <strong>the</strong> <strong>variability</strong> <strong>in</strong> <strong>the</strong> <strong>solar</strong><br />
<strong>resource</strong> over time at <strong>the</strong> cell’s geographic location. The<br />
result<strong>in</strong>g COV for DNI <strong>and</strong> GTI for all cells plotted as contour<br />
maps <strong>of</strong> <strong>the</strong> United States are shown <strong>in</strong> Figs. 1 <strong>and</strong> 2,<br />
respectively, provid<strong>in</strong>g a quick visual measure <strong>of</strong> differences<br />
<strong>in</strong> <strong>in</strong>terannual <strong>variability</strong> for a 66% confidence level. The<br />
DNI <strong>temporal</strong> COV for <strong>the</strong> 48 United States for this analysis<br />
ranges from a low <strong>of</strong> 0.49% <strong>in</strong> south-central Wash<strong>in</strong>gton<br />
State to a high <strong>of</strong> 15.8% <strong>in</strong> northwest Wash<strong>in</strong>gton State—an<br />
<strong>in</strong>terest<strong>in</strong>g contrast <strong>of</strong> climate with<strong>in</strong> a s<strong>in</strong>gle state. See discussion<br />
<strong>in</strong> Section 3.<br />
Fig. 2: Interannual COV for GTI. See comment under Fig.<br />
1.<br />
To underst<strong>and</strong> <strong>the</strong> <strong>variability</strong> <strong>in</strong> a seasonal scope, <strong>the</strong><br />
process was repeated on monthly b<strong>in</strong>s <strong>of</strong> data (e.g. <strong>the</strong> eight<br />
Although <strong>the</strong> geographical patterns <strong>of</strong> <strong>temporal</strong> <strong>variability</strong><br />
between DNI <strong>and</strong> GTI are very similar, <strong>the</strong> magnitude <strong>of</strong><br />
<strong>the</strong> <strong>variability</strong> <strong>in</strong> DNI is about twice that <strong>in</strong> GTI, thus confirm<strong>in</strong>g<br />
an earlier report, which was based on a longer, 30-<br />
year dataset [8]. Similar plots for <strong>the</strong> monthly DNI <strong>and</strong> GTI<br />
<strong>temporal</strong> COV are shown <strong>in</strong> Figs. 3 <strong>and</strong> 4, respectively.<br />
Note <strong>the</strong> significant changes <strong>in</strong> <strong>the</strong> pattern <strong>of</strong> <strong>variability</strong><br />
among months, with a strong seasonal modulation (summer<br />
versus w<strong>in</strong>ter).<br />
Fig. 3: DNI <strong>in</strong>terannual COV by month.
Fig. 4: GTI <strong>in</strong>terannual COV by month.<br />
2.2 Spatial Variability<br />
The eight-year daily total means for each 10-x-10-km cell<br />
can also be compared with a matrix <strong>of</strong> surround<strong>in</strong>g cells to<br />
determ<strong>in</strong>e <strong>the</strong> <strong>variability</strong> <strong>of</strong> <strong>the</strong> <strong>solar</strong> <strong>resource</strong> with<strong>in</strong> <strong>the</strong><br />
matrix, as depicted <strong>in</strong> Fig. 5.<br />
1/2<br />
⎡ i=n<br />
⎤<br />
σ s = ⎢ ∑ (E p − E i ) 2 / n⎥<br />
⎣ ⎢ i=1<br />
⎦ ⎥<br />
<strong>and</strong> <strong>the</strong> <strong>spatial</strong> COV is<br />
C s = σ s / E p .<br />
The process is applied to both DNI <strong>and</strong> GTI for each pixel.<br />
The same process is also applied to <strong>the</strong> eight-year means on<br />
a monthly level (e.g., <strong>the</strong> means <strong>of</strong> all Januaries, Februaries,<br />
etc.).<br />
Fig. 5: 3x3 grid layout with anchor cell <strong>in</strong> <strong>the</strong> center <strong>and</strong><br />
eight surround<strong>in</strong>g neighbor cells.<br />
Here, <strong>the</strong> st<strong>and</strong>ard deviations <strong>of</strong> <strong>the</strong> surround<strong>in</strong>g cells are<br />
calculated as<br />
Two matrix sizes are analyzed: 3x3, as shown above <strong>in</strong> Fig.<br />
5, <strong>and</strong> a larger matrix <strong>of</strong> 5x5. These represent areas <strong>of</strong> approximately<br />
30x30 <strong>and</strong> 50x50 km, respectively, <strong>and</strong> likewise<br />
roughly represent an area with<strong>in</strong> 15 <strong>and</strong> 25 km <strong>of</strong> a<br />
measurement site. The results for annual DNI <strong>spatial</strong> <strong>variability</strong><br />
<strong>and</strong> both <strong>spatial</strong> matrixes, expressed as percentages,<br />
are mapped <strong>in</strong> Fig. 6, which provides a quick visual representation<br />
<strong>of</strong> how <strong>the</strong> <strong>solar</strong> <strong>resource</strong> varies with distance, still<br />
with a 66% confidence level. Similarly, <strong>the</strong> results for annual<br />
GTI are shown <strong>in</strong> Fig. 7.
Fig. 6: DNI annual <strong>spatial</strong> COV for 3x3 cell matrix (upper)<br />
<strong>and</strong> 5x5 cell matrix (lower). Note similar patterns but different<br />
magnitudes (b<strong>in</strong>n<strong>in</strong>g scales are identical).<br />
For DNI <strong>and</strong> <strong>the</strong> 3x3 matrix, <strong>the</strong> values range from 0.12% <strong>in</strong><br />
central Missouri to about 11.5% along a corridor between<br />
Los Angeles <strong>and</strong> San Bernard<strong>in</strong>o, California. Greater <strong>variability</strong><br />
tends to occur <strong>in</strong> coastal areas (particularly <strong>the</strong> California<br />
coast) <strong>and</strong> mounta<strong>in</strong>ous areas. Greater <strong>variability</strong> is<br />
seen <strong>in</strong> <strong>the</strong> 5x5 matrix, which is to be expected because <strong>of</strong><br />
<strong>the</strong> microclimate effects <strong>of</strong> topography. Fur<strong>the</strong>r, <strong>the</strong> general<br />
pattern <strong>of</strong> high <strong>and</strong> low <strong>variability</strong> (though <strong>of</strong> different magnitudes)<br />
is quite similar between <strong>the</strong> 3x3 <strong>and</strong> 5x5 maps,<br />
<strong>in</strong>dicat<strong>in</strong>g that, <strong>in</strong> locations <strong>of</strong> significant <strong>variability</strong>, <strong>the</strong><br />
magnitude <strong>of</strong> C s is much a function <strong>of</strong> distance, which could<br />
be expected. The monthly <strong>spatial</strong> DNI <strong>and</strong> GTI maps for <strong>the</strong><br />
5x5 matrix are shown <strong>in</strong> Figs. 8 <strong>and</strong> 9. The monthly 3x3<br />
matrixes are not presented here because <strong>of</strong> <strong>the</strong> similarity <strong>of</strong><br />
<strong>variability</strong> patterns with <strong>the</strong> 5x5 matrixes.<br />
Fig. 7: GTI annual <strong>spatial</strong> COV for 3x3 cell matrix (upper)<br />
<strong>and</strong> 5x5 cell matrix (lower). Note similar patterns but different<br />
magnitudes (b<strong>in</strong>n<strong>in</strong>g scales are identical).<br />
3. DISCUSSION<br />
These maps <strong>in</strong>dicate that a wide range <strong>of</strong> <strong>variability</strong> exists <strong>in</strong><br />
<strong>the</strong> <strong>solar</strong> <strong>resource</strong> <strong>in</strong> <strong>the</strong> United States, <strong>and</strong> <strong>the</strong> values range<br />
from <strong>in</strong>significant (<strong>in</strong> <strong>the</strong> context <strong>of</strong> measurements <strong>and</strong> economic<br />
analyses) to highly significant. Climatological<br />
records are normally def<strong>in</strong>ed for periods <strong>of</strong> 30 years to encompass<br />
as many potential climatic effects as possible. Users<br />
are cautioned that <strong>the</strong> much shorter eight-year period<br />
used here may not be long enough to produce def<strong>in</strong>itive<br />
<strong>variability</strong> values for all climate regions. Consequently, <strong>the</strong><br />
uncerta<strong>in</strong>ty <strong>of</strong> this analysis has not been def<strong>in</strong>ed.<br />
Some sources <strong>of</strong> potential error have been identified, however.<br />
In particular:
• There was no major volcanic eruption dur<strong>in</strong>g 1998–2005.<br />
The <strong>temporal</strong> <strong>variability</strong> over a 30-year period, such as<br />
1976–2005, would be larger.<br />
• The SUNY model was run with long-term average aerosol<br />
data, thus elim<strong>in</strong>at<strong>in</strong>g <strong>the</strong> <strong>in</strong>terannual <strong>variability</strong> <strong>in</strong> this<br />
variable, which has a strong effect on DNI. This is ano<strong>the</strong>r<br />
reason why all <strong>the</strong> calculated DNI <strong>temporal</strong> COVs (<strong>and</strong><br />
<strong>in</strong> a lesser way, <strong>the</strong> GTI <strong>temporal</strong> COVs) are most likely<br />
underestimated.<br />
• The data used <strong>in</strong> this analysis are affected by <strong>the</strong> “Eugene<br />
syndrome” that has been found <strong>in</strong> <strong>the</strong> <strong>the</strong>n-current version<br />
<strong>of</strong> <strong>the</strong> SUNY model [6]. This problem creates prohibitively<br />
overestimated monthly-average DNI <strong>in</strong> areas with extended<br />
cloudy periods comb<strong>in</strong>ed with possible snow on<br />
ground, such as Eugene, Oregon, <strong>in</strong> w<strong>in</strong>ter. This problem<br />
most likely leads to overestimated COVs for <strong>the</strong> <strong>temporal</strong><br />
<strong>variability</strong> <strong>and</strong> (to a lesser extent) <strong>the</strong> <strong>spatial</strong> <strong>variability</strong>.<br />
This may expla<strong>in</strong>, at least <strong>in</strong> part, <strong>the</strong> large gradient <strong>in</strong><br />
<strong>temporal</strong> <strong>variability</strong> with<strong>in</strong> Wash<strong>in</strong>gton State that was<br />
mentioned <strong>in</strong> Section 2.1. It is anticipated that future releases<br />
<strong>of</strong> <strong>the</strong> NSRDB will be cured <strong>of</strong> this problem.<br />
• O<strong>the</strong>r artifacts <strong>in</strong> <strong>the</strong> SUNY model or its <strong>in</strong>put data may<br />
also create false levels <strong>of</strong> <strong>variability</strong>. For <strong>in</strong>stance, <strong>in</strong> <strong>the</strong><br />
area <strong>of</strong> White S<strong>and</strong>s National Monument <strong>in</strong> sou<strong>the</strong>rn New<br />
Mexico, difficulties <strong>in</strong> evaluat<strong>in</strong>g <strong>the</strong> magnitude <strong>and</strong> time<br />
variations <strong>of</strong> <strong>the</strong> ground albedo might affect <strong>the</strong> <strong>spatial</strong><br />
COV results presented here.<br />
The National Renewable Energy Laboratory plans to update<br />
this data set by draw<strong>in</strong>g on data from a longer period <strong>of</strong><br />
record when it becomes available; however, most <strong>of</strong> <strong>the</strong><br />
results here are very likely accurate enough to give a fairly<br />
representative relative <strong>variability</strong> <strong>of</strong> <strong>the</strong> <strong>solar</strong> <strong>resource</strong> over<br />
most <strong>of</strong> <strong>the</strong> United States. These results also <strong>in</strong>dicate that,<br />
for some areas, <strong>the</strong> <strong>variability</strong> is somewhat lower than <strong>the</strong><br />
uncerta<strong>in</strong>ty <strong>of</strong> <strong>solar</strong> radiation measurements. For example,<br />
large geographic regions display a GTI <strong>in</strong>terannual COV<br />
(<strong>temporal</strong> or <strong>spatial</strong> with a 66% confidence level) <strong>of</strong> less<br />
than 3%, which is a nom<strong>in</strong>al uncerta<strong>in</strong>ty for high-quality<br />
measurements. In all cases, good climatological knowledge<br />
<strong>of</strong> <strong>the</strong> target area <strong>of</strong> <strong>in</strong>terest is critical to underst<strong>and</strong><strong>in</strong>g, <strong>in</strong>terpret<strong>in</strong>g,<br />
<strong>and</strong> apply<strong>in</strong>g <strong>the</strong>se results.<br />
High-resolution versions <strong>of</strong> <strong>the</strong>se maps show<strong>in</strong>g each pixel<br />
are available from <strong>the</strong> National Renewable Energy Laboratory<br />
along with <strong>the</strong> underly<strong>in</strong>g data. In addition to <strong>the</strong> COV<br />
percent data covered <strong>in</strong> this paper, <strong>the</strong> <strong>variability</strong> for each<br />
pixel expressed <strong>in</strong> Wh/m 2 is also available. These data <strong>and</strong><br />
documentation are available for <strong>in</strong>ternet download from<br />
http://rredc.nrel.gov/<strong>solar</strong>/new_data/<strong>variability</strong> .<br />
Fig. 8: DNI <strong>spatial</strong> COV by month. Note <strong>the</strong> significant seasonal <strong>in</strong>fluence on <strong>the</strong> pattern <strong>of</strong> <strong>variability</strong> throughout <strong>the</strong> year.
Fig. 9: GTI <strong>spatial</strong> COV by month.<br />
4. CONCLUSION<br />
Us<strong>in</strong>g <strong>the</strong> <strong>variability</strong> statistics presented here, users can better<br />
underst<strong>and</strong> <strong>the</strong> extent <strong>of</strong> measurements required to best<br />
characterize <strong>the</strong> <strong>solar</strong> <strong>resource</strong> for a particular application.<br />
In areas with low <strong>in</strong>terannual <strong>variability</strong>, a shorter local<br />
measurement period may suffice. In areas with low <strong>spatial</strong><br />
<strong>variability</strong>, a measurement station could possibly represent<br />
<strong>the</strong> <strong>solar</strong> <strong>resource</strong> at nearby locations, which would negate<br />
<strong>the</strong> need for additional stations with<strong>in</strong> about 50 km.<br />
An analyst can also use this <strong>in</strong>formation to better build confidence<br />
<strong>in</strong> a data set as sufficient for a specific analysis. Additionally,<br />
an analyst or planner can use this data to help<br />
underst<strong>and</strong> <strong>the</strong> consistency <strong>of</strong> future plant performance <strong>and</strong><br />
how that relates to <strong>the</strong> economic viability <strong>of</strong> construct<strong>in</strong>g a<br />
power plant at a particular location.<br />
As could be expected, <strong>the</strong> DNI COV are noticeably larger<br />
than <strong>the</strong> GTI COV, <strong>the</strong>refore putt<strong>in</strong>g concentrator systems at<br />
a disadvantage compared with flat-plate systems, as far as<br />
<strong>solar</strong> <strong>resource</strong> <strong>variability</strong> is concerned. For applications that<br />
require “bankable data” <strong>and</strong> 95% confidence levels, it is<br />
recommended to double <strong>the</strong> COV values <strong>in</strong> <strong>the</strong> maps.<br />
5. ACKNOWLEDGEMENTS<br />
This work was supported by <strong>the</strong> U.S. Department <strong>of</strong> Energy<br />
under Contract No. DE-AC36-08-GO28308 with <strong>the</strong> National<br />
Renewable Energy Laboratory.<br />
6. REFERENCES<br />
(1) Suri, M., et al., Uncerta<strong>in</strong>ties <strong>in</strong> Photovoltaic Electricity<br />
Yield Prediction from Fluctuation <strong>of</strong> Solar Radiation,<br />
Proceed<strong>in</strong>gs <strong>of</strong> <strong>the</strong> 22nd EuPVSEC Conf., Milano, Italy,<br />
2007<br />
(2) Evrendilek, F., <strong>and</strong> Ertek<strong>in</strong>, C., Statistical Model<strong>in</strong>g <strong>of</strong><br />
Spatio-Temporal Variability <strong>in</strong> Monthly-Average Daily<br />
Solar Radiation over Turkey, Sensors, 7, 2763–2778,<br />
2007<br />
(3) Aguado, E., Local-Scale Variability <strong>of</strong> Daily Solar<br />
Radiation—San Diego County, California, J. Clim.<br />
Appl. Meteorol., 25, 672–678, 1991<br />
(4) Gallegos, H.G., <strong>and</strong> Lopardo, R., Spatial Variability <strong>of</strong><br />
<strong>the</strong> Global Solar Radiation Obta<strong>in</strong>ed by <strong>the</strong> Solarimetric<br />
Network <strong>in</strong> <strong>the</strong> Argent<strong>in</strong>e Pampa Humeda, Solar<br />
Energy, 40, 397–404, 1988
(5) Skaggs, R.H., et al., The Influence <strong>of</strong> Persistence <strong>and</strong><br />
Variability on <strong>the</strong> Required Solar Radiation Record<br />
Length, Solar Energy, 28, 281–287, 1982<br />
(6) Gueymard, C.A., <strong>and</strong> Wilcox, S.M., Spatial <strong>and</strong> Temporal<br />
Variability <strong>in</strong> <strong>the</strong> Solar Resource: Assess<strong>in</strong>g <strong>the</strong><br />
Value <strong>of</strong> Short-Term Measurements at Potential Solar<br />
Power Plant Sites, Solar 2009 Conf., Buffalo, NY,<br />
ASES, 2009<br />
(7) Lohmann, S., et al., Long-Term Variability <strong>of</strong> Solar<br />
Direct <strong>and</strong> Global Radiation Derived from ISCCP Data<br />
<strong>and</strong> Comparison with Reanalysis Data, Solar Energy,<br />
80, 1390–1401, 2006<br />
(8) Gueymard, C.A., Fixed or Track<strong>in</strong>g Solar Collectors?<br />
Help<strong>in</strong>g <strong>the</strong> Decision Process with <strong>the</strong> Solar Resource<br />
Enhancement Factor, Proc. SPIE Conf. Vol. 7046, Optical<br />
Model<strong>in</strong>g <strong>and</strong> Measurements for Solar Energy Systems<br />
II, San Diego, CA, 2008<br />
(9) Wilcox S., et al., Complet<strong>in</strong>g Production <strong>of</strong> <strong>the</strong> Updated<br />
National Solar Radiation Database for <strong>the</strong> United<br />
States, Solar 2007 Conf., Clevel<strong>and</strong>, OH, ASES, 2007<br />
(10) Perez, R., et al., Model<strong>in</strong>g Daylight Availability <strong>and</strong><br />
Irradiance Components from Direct <strong>and</strong> Global Irradiance.<br />
Solar Energy, 44, 271–289 1990