here - BIDS
here - BIDS
here - BIDS
You also want an ePaper? Increase the reach of your titles
YUMPU automatically turns print PDFs into web optimized ePapers that Google loves.
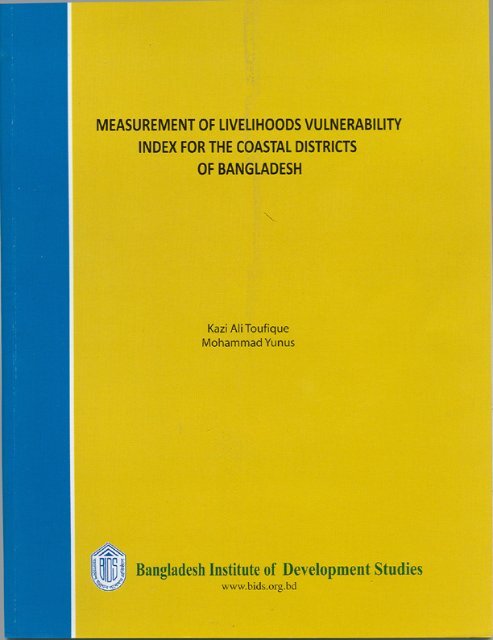
<strong>BIDS</strong>-REF Study Series No. 13-02<br />
MEASUREMENT OF LIVELIHOODS VULNERABILITY<br />
INDEX FOR THE COASTAL DISTRICTS OF<br />
BANGLADESH<br />
Kazi Ali Toufique<br />
Mohammad Yunus<br />
Bangladesh Institute of Development Studies (<strong>BIDS</strong>)<br />
E-17 Agargaon, Sher-e-Bangla Nagar<br />
GPO Box No.3854, Dhaka-1207<br />
Bangladesh<br />
i
Measurement of Livelihoods Vulnerability Index<br />
for the Coastal Districts of Bangladesh<br />
Kazi Ali Toufique<br />
Senior Research Fellow, <strong>BIDS</strong><br />
Mohammad Yunus<br />
Senior Research Fellow, <strong>BIDS</strong><br />
Published by<br />
The Bangladesh Institute of Development Studies<br />
E-17 Agargaon, Sher-e-Bangla Nagar<br />
GPO Box No.3854, Dhaka-1207<br />
E-mail: publication@bids.org.bd<br />
Fax: 880-2-8113023<br />
Website: www.bids.org.bd<br />
First Published April 2013<br />
Copyright © 2013, <strong>BIDS</strong><br />
Price: Tk. 100.00 ; US$ 12<br />
Typesetting and Layout<br />
Ms Amena Khatun<br />
Printed in Bangladesh at Panguchi Color Graphics, 117 Fakirapool, Dhaka<br />
ii
List of Tables, Figures and Map<br />
Acronyms<br />
Acknowledgements<br />
Foreword<br />
Abstract<br />
CONTENTS<br />
Page No.<br />
iv<br />
v<br />
vi<br />
vii<br />
ix<br />
Chapter: 1 Introduction 1<br />
1.1 Research Questions 3<br />
Chapter: 2 Methodology and Data 5<br />
Chapter: 3 Livelihoods Vulnerability Index (I.VI) 7<br />
Chapter: 4<br />
Major Components and Sub-components Comprising the<br />
Livelihood Vulnerability Index (I.VI)<br />
Chapter: 5 Results and Analysis 13<br />
5.1 Coastal and Interior Vulnerability 13<br />
5.2 Urban and Rural Vulnerability 14<br />
5.3 Vulnerability from Floods and Cyclones 16<br />
Chapter: 6 Policy Implications 19<br />
Chapter: 7 Limitations of the Study 21<br />
Chapter: 8 Summary and Conclusions 23<br />
References 24<br />
9<br />
iii
LIST OF TABLES, FIGURES AND MAP<br />
Page No.<br />
Tables<br />
Table 2.1 Spatial Distribution of the Sample Households 6<br />
Table 4.1 Major Components and Sub-components Comprising the<br />
9<br />
Livelihood Vulnerability Index (I.VI)<br />
Table 5.1 Indexed Sub-components, Major Components and Overall I.VI for<br />
the Regions Interior, Coastal, Urban, Rural, Flood Prone and<br />
Cyclone Prone<br />
17<br />
Figures<br />
Figure 5.1<br />
Figure 6.2<br />
Vulnerability Spider Diagram of the I.VI for Interior and Coastal<br />
Regions<br />
Vulnerability Spider Diagram of the I.VI for Urban and Rural<br />
Regions<br />
Figure 6.3 Vulnerability Spider Diagram of I.VI from Flood and Cyclone 16<br />
Map<br />
Map 1.1 The Coastal Zone of Bangladesh 2<br />
14<br />
15<br />
iv
Acronyms<br />
<strong>BIDS</strong><br />
IPCC<br />
LVI<br />
NDCV<br />
NGO<br />
PDO-ICZMP<br />
REF<br />
Bangladesh Institute of Development Studies<br />
International Panel on Climate Change<br />
Livelihood Vulnerability Index<br />
Natural Disaster and Climate Variability<br />
Non-Government Organisation<br />
Program Development Office for Integrated Coastal Zone<br />
Management Plan<br />
Research Endowment Fund<br />
v
ACKNOWLEDGEMENTS<br />
The study is supported by Research Endowment Fund (REF) of the Bangladesh<br />
Institute of Development Studies (<strong>BIDS</strong>). Research support provided by Mr. Sami<br />
Farook is acknowledged. The authors are only responsible for any error that may<br />
remain in this paper.<br />
vi
FOREWORD<br />
This research study was funded by the <strong>BIDS</strong> Research Endowment Fund (REF)<br />
which provides a window for the <strong>BIDS</strong> researchers to conduct policy oriented research<br />
on priority development challenges facing Bangladesh.<br />
In 2009, <strong>BIDS</strong> received Tk. 200 million from the government to create the REF to<br />
carry out policy research at the Institute. The creation of <strong>BIDS</strong>-REF has significantly<br />
enhanced our scope of conducting institutional research. Under the <strong>BIDS</strong>-REF, several<br />
research studies have been initiated with the expectation that this will enable the<br />
researchers to bring their knowledge into the mainstream of development research and<br />
evidence-based policy making in the country through conducting policy relevant works.<br />
These research studies are included in the Annual Research Programmes (ARPs) of<br />
<strong>BIDS</strong> which are prepared every year through a rigorous and participatory process in<br />
consultation with the government, civil society, private sector and other concerned<br />
stakeholders. As such, several of these studies are undertaken in response to emerging<br />
challenges and/or at the request of the government and other agencies.<br />
This is for the first time that <strong>BIDS</strong> is publishing the <strong>BIDS</strong>-REF study reports as a part<br />
of its commitment to establishing transparency and accountability to its stakeholders<br />
including fellow researchers and policymakers who are working towards promoting<br />
evidence based policies in Bangladesh. I hope the study report will be useful to all<br />
stakeholders concerned with the theory and practice of development in general and of<br />
Bangladesh in particular.<br />
I would like to express my deep appreciation to all my colleagues in <strong>BIDS</strong> who have<br />
cooperated and contributed to the preparation and publication of these research studies. I<br />
would also like to express my deep gratitude to the Hon’ble Minister of Planning and<br />
Chairman of <strong>BIDS</strong> Board of Trustees and its distinguished members who are providing<br />
continuous guidance and support to <strong>BIDS</strong> in the effort to further concretising its long<br />
term vision of being part of a process that places <strong>BIDS</strong> firmly on the level of engagement<br />
in furthering better research and better policy leading to better Bangladesh.<br />
April 2013<br />
Mustafa K. Mujeri<br />
Director General<br />
vii
ABSTRACT<br />
The wider impacts of climate change (e.g., frequent and severe tropical cyclones,<br />
heavier and more erratic rainfall) on resource systems and environment are generally<br />
known. What is not well understood is how these changes affect livelihoods. To address<br />
this and related concerns, vulnerability assessment is required that will help understand<br />
the complex set of factors that contribute to adaptive capacity of the households.<br />
Hahn et al. (2009) has developed a Livelihood Vulnerability Index (LVI) as a tool for<br />
vulnerability assessment. This paper uses and extends this index to measure the<br />
vulnerability of the households living in the coastal region of Bangladesh. While this<br />
index is effective for understanding regional variations in vulnerability, it does not extend<br />
the analysis to other dimensions that are crucial for policy making. For example, in a<br />
given region,<br />
- Are rural households more vulnerable to climate change as compared to the<br />
urban households?<br />
- Are households living close to the coast more vulnerable than those living away<br />
from the coast?<br />
- Are households more vulnerable to floods than to cyclones?<br />
- What are the factors that may explain these differences?<br />
Based on the findings from a survey of 532 households from 12 coastal districts, we<br />
have found that households living in the rural areas are more vulnerable than those living<br />
in urban areas and households living in coastal districts are more vulnerable than those<br />
living in exterior districts. Finally, households affected by cyclones are more vulnerable<br />
than those affected by floods. The following factors explain this.<br />
The higher vulnerability of coastal households stems from poor access to health<br />
facilities, a weaker social network as well as from natural disasters and climate<br />
variability.<br />
The higher vulnerability of rural households is also explained by poor health factors,<br />
such as lack of access to sanitary toilets. The rural households also have adverse social<br />
and demographic profile (adverse sex ratio, dependency ratios, and so on). They also<br />
have a weaker social network which may be explained by relative remoteness of the rural<br />
areas in coastal regions of Bangladesh. The rural households are found to be more<br />
vulnerable than their urban counterparts from natural disaster and climate variability. The<br />
rural households also have difficulty in accessing reliable drinking water.<br />
Weaker social network, unsafe drinking water, etc. explain a higher vulnerability<br />
from cyclones as compared to floods.<br />
ix
CHAPTER 1<br />
INTRODUCTION<br />
Bangladesh is widely recognised as one of the most climate vulnerable countries in<br />
the world. It experiences frequent natural disasters that cause loss of life, damage to<br />
infrastructures and economic assets, and adversely impact on lives and livelihoods,<br />
especially of poor and marginal households.<br />
The coastal zone of Bangladesh has an area covering 47,211 km² facing the Bay of<br />
Bengal or having proximity to the Bay (Map 1.1). In the last 200 years at least 70 major<br />
cyclones hit the coastal belt of Bangladesh and during the last 35 years nearly 900,000<br />
people died due to catastrophic cyclones (PDO-ICZMP 2004).<br />
Climate change will continue to exacerbate many of the current problems and natural<br />
hazards the country faces. It is expected to result in:<br />
- increasingly frequent and severe tropical cyclones, with higher wind speeds and<br />
storm surges leading to more damage in the coastal region;<br />
- heavier and more erratic rainfall in the Ganges-Brahmaputra-Meghna system,<br />
including Bangladesh, during the monsoon resulting in:<br />
- higher river flows, causing over-topping and breaching of embankments and<br />
widespread flooding in rural and urban areas,<br />
- river bank erosion, resulting in loss of homes and agricultural land to the rivers;<br />
- increased sedimentation in riverbeds, leading to drainage congestion and<br />
water-logging;<br />
- melting of the Himalayan glaciers, leading to higher river flows in the warmer<br />
months of the year, followed by lower river flows and increased saline intrusion<br />
after the glaciers have shrunk or disappeared;<br />
- lower and more erratic rainfall, resulting in increasing droughts, especially in<br />
drier northern and western regions of the country;<br />
- sea level rise, leading to submergence of low-lying coastal areas and saline water<br />
intrusion up along coastal rivers and into groundwater aquifers: reducing<br />
freshwater availability; damage to the Sundarbans mangrove forest, a World<br />
Heritage site with rich biodiversity; and drainage congestion inside coastal<br />
polders, which will adversely affect agriculture;<br />
- warmer and more humid weather, leading to increased prevalence of disease.<br />
These are wider impacts of climate change on resource systems and environment but<br />
the ultimate impact that matters most is on the livelihoods of the people. The crucial issue<br />
<strong>here</strong> is, how do they affect livelihoods? To address this and related concerns,
2<br />
Measurement of Livelihoods Vulnerability Index for the Coastal Districts of Bangladesh<br />
vulnerability assessment is required that will help understand the complex set of factors<br />
that contribute to adaptive capacity of the households. Vulnerability assessment describes<br />
a diverse set of methods used to systematically integrate and examine interactions<br />
between humans and their physical and social surroundings. Hahn, Riederer and Foster<br />
(2009) have developed Livelihood Vulnerability Index (LVI) as a tool for vulnerability<br />
assessment.<br />
The approach used by Hahn et al. (2009) has several advantages over the past efforts.<br />
First, it uses primary data from household surveys to construct the index. This helps to<br />
avoid the pitfalls associated with using secondary data. Second, it presents a framework<br />
for grouping and aggregating indicators at the regional level. Third, it does not depend on<br />
climate models and misses livelihoods complexity at the local level.<br />
Map 1.1: The Coastal Zone of Bangladesh
Introduction 3<br />
However, Hahn et al. (2009) do not go beyond broader regional level, although they<br />
mention of vulnerability differences across several dimensions. Kasperson and Kasperson<br />
(2001) show that climate change stressors can disproportionately affect the poor, elderly<br />
or marginal households. The extent of poverty is higher in the coastal region (PDO-<br />
ICZMP 2003). Besides, t<strong>here</strong> is an additional burden of poverty and vulnerability in<br />
coastal areas of Bangladesh (Sen and Yunus 2011). Dependence on agriculture based<br />
livelihoods can increase vulnerability of the households who do not diversify (Fields<br />
2005). This analysis can be easily extended to other dimensions. For example, within a<br />
region one may expect different vulnerabilities for those living in the urban areas and<br />
those living in the rural areas.<br />
We use and extend the scope of this index to measure and explain the vulnerability of<br />
the households living in the coastal region of Bangladesh covering three dimensions:<br />
rural-urban vulnerability, coastal-interior vulnerability and disaster related vulnerability<br />
(flood and cyclones).<br />
1.1 Research Questions<br />
The field of climate vulnerability assessment has emerged to address the need to<br />
quantify how communities will adapt to changing environmental conditions. Many of<br />
these methods rely heavily on the IPCC working definition of vulnerability as a function<br />
of exposure, sensitivity, and adaptive capacity (IPCC 2001).<br />
The LVI uses multiple indicators to assess exposure to natural disasters and climate<br />
variability, social and economic characteristics of households that affect their adaptive<br />
capacity, and current health, food and water resource characteristics that determine their<br />
sensitivity to climate change impacts. These multiple indicators can also be used to<br />
estimate vulnerability as defined by IPCC 2001. This approach differs from previous<br />
methods in that it uses primary data from household surveys to construct the index.<br />
While this approach is good for understanding regional variation in vulnerability, it<br />
does not extend the analysis to other dimensions that are crucial for policy making. For<br />
example,<br />
Are rural households more vulnerable to climate change as compared to the urban<br />
households?<br />
Are households living close to the coast more vulnerable than those living away from<br />
the coast?<br />
Are households more vulnerable to floods than to cyclones?
CHAPTER 2<br />
METHODOLOGY AND DATA<br />
The original data was collected for making a coastal economic risk assessment of the<br />
livelihoods due to tsunami/storm surge events. For this purpose, at the first stage, 12<br />
coastal districts were selected. In the second stage, as many as 18 upazilas were selected<br />
from these districts (Table 2.1). These upazilas were selected on the basis of their<br />
proximity to the coast of the Bay of Bengal. In the third stage, as many as 36 union<br />
parishads/paurashavas were selected. As such, the selection process in the first and third<br />
stages was purposive. Finally, as many as 532 households were selected with average of<br />
15 households from each union parishad/paurashava. The household questionnaire was<br />
designed in a manner to extract information about socioeconomic characteristics of a<br />
household, level of exposure to risks and the experience they had on the catastrophic<br />
impact of last disaster on their lives and livelihood and how they cope with the disaster.<br />
As such, the data is not collected for measuring vulnerability. However, the information<br />
contained in the questionnaire can still be used for measuring livelihoods vulnerability<br />
index.<br />
Based on available information in the dataset, we used several indicators to assess<br />
vulnerability. The following major components are used: socio-demographic profile,<br />
livelihood strategies, social networks, health, food, water, and natural disasters and<br />
climate variability. Each component has several sub-components. These sub-components<br />
are selected on the basis of their relevance to contribution to each major component.<br />
Obviously, if we had information on some other aspects, the richness of the subcomponents<br />
could have been easily improved. For example, we could not use rainfall and<br />
temperature data because we did not have these data at a disaggregate level that would<br />
have been appropriate to capture climate change effects. On the other hand, we had<br />
several indicators dealing with losses and damages incurred by the surveyed households<br />
from natural disasters. These information are not readily available from secondary<br />
sources and at a disaggregate level.
6<br />
Measurement of Livelihoods Vulnerability Index for the Coastal Districts of Bangladesh<br />
Table 2.1<br />
Spatial Distribution of the Sample Households<br />
Districts Upazila Union Parishad/Paurashava<br />
Bagerhat<br />
Sharankhola Dakshinkhali (15)<br />
Barguna<br />
Amtali<br />
Royenda (15)<br />
Amtali Sadar (15)<br />
Patharghata<br />
Char Fashion<br />
Haldia (13)<br />
Patharghata Sadar (15)<br />
Kalmegha (15)<br />
Char Kalmi (15)<br />
Bhola<br />
Chittagong<br />
Tazumuddin<br />
Banshkhali<br />
Char Manika (14)<br />
Chandpur (15)<br />
Chanchra (15)<br />
Katharia (15)<br />
Saral (14)<br />
Port Thana Paurashava (Two Wards) (29)<br />
Cox's Bazar<br />
Sitakunda<br />
Cox's Bazar Sadar<br />
Barabkunda (15)<br />
Muradpur (15)<br />
Khurushkul (15)<br />
Maheshkhali<br />
Sonagazi<br />
Chaufaldandi (15)<br />
Dhalghata (14)<br />
Kutubjhum (15)<br />
Sonagazi Sadar (14)<br />
Feni<br />
Dakope<br />
Char Chandia (15)<br />
Banishanta (15)<br />
Khulna<br />
Ramgati<br />
Sutarkhali (15)<br />
Char Ramiz (15)<br />
Laxhmipur<br />
Companyganj<br />
Char Alexander (15)<br />
Char Fakira (15)<br />
Noakhali<br />
Patuakhali<br />
Dashmina<br />
Char Kakra (15)<br />
Dashmina (15)<br />
Pirojpur<br />
Kala Para<br />
Mathbaria<br />
Banshbaria (15)<br />
Khaprabhanga (15)<br />
Lata Chapli (15)<br />
Tushkhali (15)<br />
Satkhira<br />
Shyamnagar<br />
Bara Machhua (15)<br />
Buri Goalini (14)<br />
Atulia (15)<br />
Total 432<br />
Note: Size of the sample in each union parishad/paurashava is in the parentheses.
CHAPTER 3<br />
LIVELIHOODS VULNERABILITY INDEX (LVI)<br />
LVI <strong>here</strong> includes seven major components: Socio-Demographic Profile, Livelihood<br />
Strategies, Social Networks, Health, Food, Water, Natural Disasters and Climate<br />
Variability. Each is comprised of several indicators or sub-components, as shown in<br />
Table 4.1. This explains how each sub-component was quantified, survey questions used<br />
and original source of the survey question. To calculate the LVI, we used a balanced<br />
weighted average approach w<strong>here</strong> each sub-component contributes equally to the overall<br />
index though each major component is comprised of a different number of subcomponents.<br />
As each sub-component was measured on a different scale, we first<br />
standardized each as an index using the following equation:<br />
IndexX<br />
X −<br />
= (1)<br />
min<br />
X max−<br />
X X min<br />
X is the original sub-component, X min and X max are the minimum and maximum<br />
values, respectively, for each sub-component. For example, the value of the subcomponent<br />
“number of natural disasters during the last 20 years” ranged from 1 to 25.<br />
These minimum and maximum values were then used to transform this indicator into a<br />
standardized index to integrate it into the major component “Natural Disaster and Climate<br />
Variability.” For variables that measure frequencies such as the “per cent of female<br />
headed households,” the minimum value is set at 0 and the maximum at 100. Subcomponents<br />
like “average agricultural livelihood diversity index” are created because an<br />
increase in the crude indicator, i.e. the number of agricultural livelihood activities<br />
undertaken by a household in this case, is assumed to decrease vulnerability. This means<br />
that a household who produces rice in the fields and culture fish in the ponds is less<br />
vulnerable than a household who only produces rice. We have taken an inverse of this<br />
number (1/ (1+1+1) =0.33. Note that 1 is added to the denominator to avoid<br />
indeterminate ratios for households who do not pursue any agricultural livelihoods. The<br />
inversion generates a number that assigns higher values to households who pursue a<br />
lower number of agricultural livelihoods.<br />
A number is then created by taking inverse of the crude indicator, which assigns<br />
higher values to households with a lower number of livelihood activities. After all the<br />
sub-components are indexed, the sub-components had been averaged to calculate the<br />
value of each major component as shown in equation 2:<br />
MC<br />
n<br />
∑<br />
i=<br />
1<br />
=<br />
Index<br />
n<br />
Y<br />
i<br />
(2)
8<br />
Measurement of Livelihoods Vulnerability Index for the Coastal Districts of Bangladesh<br />
w<strong>here</strong> MC is one of the seven major components [Socio-Demographic Profile (SDP),<br />
Livelihood Strategies (LS), Social Networks (SN), Health (H), Food (F), Water (W), or<br />
Natural Disaster and Climate Variability (NDC)], index Y i represents the subcomponents,<br />
indexed by i, that make up each major component, and n is the number of<br />
sub-components in each major component. For example, if we want to calculate for the<br />
major component ‘SDP’, it would be:<br />
SDP= (Percentage of female members in the household + dependency ratio + average<br />
education of a household + average age of household heads) / 4<br />
Once values for each of the seven major components were calculated, they were<br />
averaged using Eq. (3) to obtain the LVI:<br />
LVI<br />
=<br />
∑<br />
∑<br />
n<br />
W<br />
i = 1<br />
n<br />
i = 1<br />
It can also be expressed as:<br />
m<br />
i<br />
W<br />
M<br />
m<br />
i<br />
i<br />
(3)<br />
LVI<br />
W SDP SDP + W LS LS + W SN SN + W HH<br />
+ W FF<br />
+ W WW<br />
+ W NDC NDC<br />
= (4)<br />
W SDP + W LS + W SN + W H + W F + W w + W NDC NDC<br />
LVI is the Livelihood Vulnerability Index, equals the weighted average of the seven<br />
major components. W m i , or weights of each of the major components are determined by<br />
the number of sub-components that make up each major component. For example, SDP<br />
has four sub-components, so W SDP will be 4. Weights are included so that all subcomponents<br />
contribute equally to the overall LVI. In this paper, the LVI is scaled from 0<br />
(least vulnerable) to 0.5 (most vulnerable).<br />
One major limitation of this method is the use of equal weights. Not only the subcomponents<br />
but also the major components are weighted equally. Eakin and Bojorquez-<br />
Tapia (2008) use a fuzzy logic method for deriving unequal weights on the factors.<br />
Vincent (2007), on the other hand, suggested use of expert opinions in determining the<br />
weights.<br />
As pointed out by Vincent (2007), the indicators (major and sub-components)<br />
oversimplify a complex reality and t<strong>here</strong> is in<strong>here</strong>ntly no straightforward way to validate<br />
indices comprised of disparate indicators. Also, as the sub-components are averaged into<br />
one major component score, the indexing approach does not incorporate variance<br />
between study populations. The selection of sub-components and the assignment of<br />
directionality from less to more vulnerable involve normative judgment.
CHAPTER 4<br />
MAJOR COMPONENTS AND SUB-COMPONENTS<br />
COMPRISING THE LIVELIHOOD<br />
VULNERABILITY INDEX (LVI)<br />
In this study we have considered seven major components: social and demographic<br />
profile or SDP, livelihoods strategy or LS, social network or SN, health (H), food (F),<br />
water (W), and natural disaster and climate variability (NDCV). Each major component<br />
has several sub-components, as shown in Table 4.1. The number in parenthesis indicates<br />
the number of sub-components that belong to the respective major component. For<br />
example, the major component social and demographic profile or SDP has four subcomponents<br />
and each of the sub-components is described in subsequent columns.<br />
Table 4.1<br />
Major Components and Sub-components Comprising the Livelihood<br />
Vulnerability Index (LVI)<br />
Major<br />
Components<br />
1. Social and<br />
Demographic<br />
Profile, SDP<br />
(4)<br />
2. Livelihood<br />
Strategies, LS<br />
(5)<br />
Sub-<br />
Components<br />
1.1.Dependency<br />
ratio<br />
1.2. Per cent<br />
of female<br />
members in<br />
households<br />
1.3. Average<br />
education of<br />
the head of<br />
the household<br />
1.4. Average<br />
age of<br />
household<br />
heads<br />
2.1. Agricultural<br />
livelihood<br />
diversification<br />
index<br />
Explanation of Sub-<br />
Components<br />
Ratio of the population<br />
under 15 and over 65 years<br />
of age to the population<br />
over 15 and below 65 years<br />
of age<br />
Percentage of female<br />
members to total members<br />
in the household<br />
Percentage of households<br />
w<strong>here</strong> the heads of<br />
household report that they<br />
have attended zero years of<br />
formal schooling<br />
Average age of head of<br />
households<br />
The inverse of the number<br />
of agricultural livelihood<br />
activities +1 reported by a<br />
household. For example, a<br />
household that cultivates<br />
rice, vegetables and has<br />
aquaculture in pond will<br />
have a livelihood<br />
diversification index = 1/ (3<br />
+ 1) = 0.25.<br />
Survey Question<br />
Information collected<br />
from household roster<br />
on age of each member<br />
Information collected<br />
from household roster<br />
on sex of each member<br />
Information collected<br />
from household roster<br />
on the level of education<br />
of each member,<br />
including the head of<br />
the household<br />
Household roster<br />
collected information on<br />
age of each member,<br />
including the head of<br />
the household<br />
What are the crops that<br />
you cultivate? How<br />
much land do you<br />
devote in each crop and<br />
aquaculture?<br />
Relationship/<br />
Explanation<br />
Positive<br />
(Higher dependency<br />
ratio increases<br />
vulnerability)<br />
Positive<br />
(Higher proportion of<br />
female members<br />
increases vulnerability)<br />
Positive<br />
(More illiterate head of<br />
the households increase<br />
vulnerability)<br />
Positive<br />
Positive<br />
(More agricultural<br />
livelihoods reduce<br />
vulnerability but <strong>here</strong> an<br />
inverse is considered)
10<br />
Measurement of Livelihoods Vulnerability Index for the Coastal Districts of Bangladesh<br />
Major<br />
Components<br />
Sub-<br />
Components<br />
2.2. Natural<br />
resource and<br />
livestock<br />
index<br />
2.3. Percentage<br />
of agricultural<br />
livelihoods<br />
Explanation of Sub-<br />
Components<br />
The inverse of the number<br />
of natural resource and<br />
livestock ownership+1<br />
reported by a household.<br />
For example, a household<br />
that has livestock, poultry<br />
and tree will have a natural<br />
resource and livestock<br />
index = 1/ (3 + 1) = 0.25<br />
Percentage of agricultural<br />
livelihoods undertaken by a<br />
household compared to its<br />
total number of livelihoods<br />
Survey Question<br />
What are the different<br />
livestock or natural<br />
resources that you own?<br />
What are they? How<br />
many?<br />
What is your<br />
occupation? What are<br />
the occupations of your<br />
family members?<br />
Relationship/<br />
Explanation<br />
Positive<br />
(More natural and<br />
livestock resources<br />
reduce vulnerability but<br />
<strong>here</strong> an inverse is<br />
considered)<br />
Inverse<br />
(Non-agricultural<br />
livelihoods have higher<br />
incomes)<br />
2.4. Agricultural<br />
and<br />
fishing<br />
equipment<br />
value index<br />
Inverse of value of total<br />
fishing and agricultural<br />
equipment owned by a<br />
household + 1<br />
The household stated<br />
the number of such<br />
equipment owned and<br />
their unit price<br />
Positive<br />
(More agricultural and<br />
fishing assets reduce<br />
vulnerability but <strong>here</strong> an<br />
inverse is considered)<br />
3. Social<br />
Network, SN<br />
(3)<br />
4. Health, H<br />
(2)<br />
2.5. Transportation<br />
assets<br />
value index<br />
3.1. Availability<br />
of<br />
amenities<br />
3.2. Sources<br />
of assistance<br />
received<br />
3.3. Total<br />
assistance<br />
received<br />
4.1 Access to<br />
sanitary<br />
latrine<br />
Inverse of the value of total<br />
transportation equipment of<br />
households+ 1. Transport<br />
equipment includes<br />
rickshaws, vans and so on<br />
Inverse of the total number<br />
of types of amenity<br />
available. For example, if<br />
the village has primary<br />
school and primary health<br />
care centre, amenity= 1/<br />
{1+ (1+1) =0.33<br />
Inverse of the sources of<br />
assistance that the<br />
household received from<br />
government<br />
agencies/NGOs/financial<br />
institutions+1<br />
Inverse of the total number<br />
of type of assistance<br />
received plus 1<br />
Percentage of households<br />
without a sanitary latrine<br />
The household stated<br />
the number of transport<br />
equipment owned and<br />
their unit price<br />
Do you have primary<br />
school, high/junior<br />
school, primary health<br />
care, doctor's chamber,<br />
cyclone shelter, general<br />
hospital, bazar, fire<br />
services in your village?<br />
Did any of the following<br />
institutions help you<br />
after the natural<br />
disaster?<br />
This considers the loans<br />
received from NGOs,<br />
other assistance<br />
received from NGOs<br />
and so on<br />
What is the type of<br />
latrine you use? The<br />
response “no latrine” is<br />
reckoned <strong>here</strong><br />
Positive<br />
(More transportation<br />
assets reduce<br />
vulnerability but <strong>here</strong> an<br />
inverse is considered)<br />
Positive<br />
(More amenities reduce<br />
vulnerability but <strong>here</strong> an<br />
inverse is considered)<br />
Positive<br />
(More sources of<br />
assistance reduce<br />
vulnerability but <strong>here</strong> an<br />
inverse is considered)<br />
Positive<br />
(More assistance<br />
reduces vulnerability<br />
but <strong>here</strong> an inverse is<br />
considered)<br />
Positive<br />
(Higher the proportion<br />
of households without<br />
access to sanitary<br />
latrines, higher is the<br />
vulnerability)<br />
4.2. Total<br />
person days of<br />
injury in the<br />
households<br />
Number of days someone<br />
in the household is injured<br />
What is the duration of<br />
illness due to injury in<br />
days?<br />
Positive<br />
(Higher the duration of<br />
illness due to<br />
injury/sickness, higher<br />
is the vulnerability)
Major Components and Sub-components Comprising the Livelihood Vulnerability Index 11<br />
Major<br />
Components<br />
5. Food, F (3)<br />
6. Water, W<br />
(4)<br />
Sub-<br />
Components<br />
5.1. Number<br />
of months<br />
with adequate<br />
food supply<br />
5.2. Number<br />
of months<br />
with adequate<br />
food supply<br />
from own<br />
production<br />
5.3. Extent of<br />
crop damage<br />
6.1. Unsafe<br />
source of<br />
drinking water<br />
6.2. Distance<br />
to source of<br />
natural water<br />
6.3. Whether<br />
experienced<br />
scarcity of<br />
water<br />
6.4. Whether<br />
the household<br />
spent money<br />
to get water<br />
7.1. Number<br />
of natural<br />
disasters<br />
during the last<br />
20 years<br />
Explanation of Sub-<br />
Components<br />
Number of months a<br />
household had adequate<br />
food supply through<br />
production and purchase<br />
Number of months a<br />
household had adequate<br />
food supply through<br />
production only<br />
Value of crops damaged<br />
due to natural disaster<br />
Whether the household has<br />
access to safe drinking<br />
water. Sources of water<br />
such as from pond, watertank<br />
or<br />
river/canal/marshland etc.<br />
are considered unsafe.<br />
Self Explanatory<br />
Self Explanatory<br />
Amount of money spent on<br />
getting water<br />
Natural disasters include,<br />
among others, flood,<br />
draught, cyclone, surge,<br />
etc.<br />
Survey Question<br />
How many months on<br />
average was it possible<br />
to provide sufficient<br />
food to family<br />
members?<br />
How many months on<br />
average was it possible<br />
to provide sufficient<br />
food to family members<br />
from own production?<br />
What are the amounts of<br />
crop damaged? What<br />
are the prices per unit of<br />
the crops?<br />
What is the source of<br />
your drinking water?<br />
Several choices are<br />
given which are<br />
classified as safe (tap,<br />
tube-well, etc.) and<br />
unsafe (pond, river, etc.)<br />
What is the distance (in<br />
km) of source of<br />
drinking water from<br />
your home?<br />
Is the water supply from<br />
the source you use<br />
adequate?<br />
Did you spend any<br />
money on drinking<br />
water in the last 12<br />
months? If Yes, how<br />
much?<br />
How many natural<br />
disasters occurred in<br />
your village during the<br />
past 20 years?<br />
Relationship/<br />
Explanation<br />
Inverse<br />
(Higher food security<br />
results in lower<br />
vulnerability)<br />
Inverse<br />
(Higher food security<br />
results in lower<br />
vulnerability)<br />
Positive<br />
(Higher the extent of<br />
crop damage, higher is<br />
the vulnerability)<br />
Positive<br />
(So higher percentage of<br />
households drinking<br />
unsafe water implies<br />
higher vulnerability.)<br />
Positive<br />
(Longer the distance,<br />
the higher is the<br />
vulnerability)<br />
Inverse<br />
(More adequate source<br />
of water supply reduces<br />
vulnerability)<br />
Positive<br />
(Higher the amount of<br />
money spent on getting<br />
water, higher is the<br />
vulnerability)<br />
Positive<br />
(Higher the incidence of<br />
natural disasters, higher<br />
is the vulnerability)<br />
7. Natural<br />
Disaster and<br />
Climate<br />
Variability,<br />
NDCV (9)<br />
7.2. Number<br />
of times<br />
affected by<br />
disaster<br />
7.3. Value of<br />
crops<br />
damaged<br />
7.4. Value of<br />
pond fish<br />
damaged<br />
Total number of times the<br />
household is affected by<br />
natural disasters in the past<br />
20 years<br />
Value of the crops<br />
damaged due to natural<br />
disaster<br />
Value of the fishes in pond<br />
damaged due to natural<br />
disaster<br />
In the past 20 years,<br />
how many times have<br />
you been affected by<br />
natural disasters?<br />
Was any crop damaged<br />
due to natural disasters?<br />
Was t<strong>here</strong> any damage<br />
of pond fishes due to<br />
natural disasters?<br />
Positive<br />
(A household more<br />
affected by disaster is<br />
more vulnerable)<br />
Positive<br />
(Higher the value of<br />
crops damaged, more<br />
vulnerable is the<br />
household)<br />
Positive<br />
(Higher the value of<br />
fishes in pond damaged,<br />
more vulnerable is the<br />
household)
12<br />
Measurement of Livelihoods Vulnerability Index for the Coastal Districts of Bangladesh<br />
Major<br />
Components<br />
Sub-<br />
Components<br />
7.5. Value of<br />
livestock<br />
damaged<br />
7.6. Value for<br />
damaged<br />
agricultural<br />
equipment<br />
7.7. Value for<br />
damaged<br />
fishing<br />
equipment<br />
7.8. Value for<br />
damaged<br />
household<br />
items<br />
7.9. Indicator<br />
of vulnerable<br />
house<br />
Explanation of Sub-<br />
Components<br />
Value of the livestock<br />
damaged due to natural<br />
disaster<br />
Value of cultivation<br />
machineries and equipment<br />
damaged due to natural<br />
disaster<br />
Value of fishing<br />
machineries and equipment<br />
damaged due to natural<br />
disaster<br />
Value of the household<br />
items damaged due to<br />
natural disaster<br />
Indicates how vulnerable a<br />
house is to natural<br />
disasters. Inverse of (strong<br />
walls+ strong roof + strong<br />
floor+1). For example, if a<br />
house consists of strong<br />
walls, weak roof and strong<br />
floor, the value will be {1/<br />
(1+0+1+1)} = 0.33.<br />
Survey Question<br />
Was t<strong>here</strong> any damage<br />
to livestock due to<br />
natural disasters?<br />
Was t<strong>here</strong> any damage<br />
of equipment due to<br />
natural disasters?<br />
Was t<strong>here</strong> any damage<br />
of equipment due to<br />
natural disasters?<br />
Was any household<br />
items damaged due to<br />
natural disasters?<br />
Amount of damage in<br />
numbers?<br />
What is the wall of your<br />
house made of? What is<br />
the roof of your house<br />
made of? What is the<br />
floor of your house<br />
made of?<br />
Relationship/<br />
Explanation<br />
Positive<br />
(Higher the value of<br />
heads of livestock<br />
damaged, more<br />
vulnerable is the<br />
household)<br />
Positive<br />
(Higher the value of<br />
cultivation machineries<br />
and equipment<br />
damaged, more<br />
vulnerable is the<br />
household)<br />
Positive<br />
(Higher the value of<br />
fishing machineries and<br />
equipment damaged,<br />
more vulnerable is the<br />
household)<br />
Positive<br />
(Higher the value of<br />
household items<br />
damaged, more<br />
vulnerable is the<br />
household)<br />
Positive<br />
(A stronger house<br />
reduces vulnerability<br />
but <strong>here</strong> an inverse is<br />
considered)
CHAPTER 5<br />
RESULTS AND ANALYSIS<br />
As already mentioned, the main purpose of this study is to measure LVI of the<br />
selected coastal districts in Bangladesh. We would also like to see whether LVI varies by<br />
coastal and interior regions or by rural and urban locations or by the type of natural<br />
disasters (flood and cyclone). Estimates of the major components and the subcomponents<br />
are provided in Table 5.1.<br />
5.1 Coastal and Interior Vulnerability<br />
Are households living close to the coast more vulnerable than those living away from<br />
the coast? If so, why? What are the factors that may make a household living in the<br />
coastal areas more vulnerable to a household living in an interior area?<br />
LVI estimates show that the households living more close to the coast are more<br />
vulnerable than those living away from the coast. The LVI for households living close to<br />
the coast is 0.348 as against 0.324 for those living in the interior.<br />
The crucial issue <strong>here</strong> is the health factors. It is the lack of access to sanitary latrines<br />
that makes the households more vulnerable in the coastal areas. Note that the households<br />
living in the interior are slightly more vulnerable to injury but it is the sanitary condition<br />
of the toilets that makes health conditions worse in the coastal region.<br />
The households in the coastal areas also have weaker social networks. These are<br />
reflected in the number of amenities such as the number of primary, junior and high<br />
schools, primary health care facilities, doctor's chambers, cyclone shelters, general<br />
hospitals, bazaars, fire services, etc. available to the households. These amenities are less<br />
available in the coastal region as compared to the interior. The coastal households also<br />
received assistance from fewer sources. Government organisations, non-government<br />
organisations (NGOs) or the banks did not provide enough assistance to them.<br />
The households in the coastal areas are found to be more vulnerable to natural<br />
disasters and climate variability factors. For example, they faced more disasters in the last<br />
20 years, they were more affected by these disasters, and the extent of damage to crops<br />
was higher. The extent of damage to livestock, household items were high. On the other<br />
hand, they live in more vulnerable houses.<br />
The relative contribution of the major components is shown in the spider diagram<br />
(Figure 5.1). The diagram depicts differential vulnerability between the households living<br />
in interior and coastal regions.
14<br />
Measurement of Livelihoods Vulnerability Index for the Coastal Districts of Bangladesh<br />
Figure: 5.1 Vulnerability Spider Diagram of the LVI for Interior and Coastal<br />
Regions<br />
SDP<br />
NDCV<br />
LS<br />
WATER<br />
SN<br />
FOOD<br />
HEALTH<br />
Interior<br />
Coastal<br />
5.2 Urban and Rural Vulnerability<br />
Are rural households more vulnerable to climate change as compared to the urban<br />
households? What factors explain the difference?<br />
The LVI for the rural households has been estimated at .337 as compared to .324 for<br />
the households living in urban areas. Thus our estimates of LVIs suggest that a household<br />
living in the rural areas is more vulnerable than a household living in urban areas. We<br />
will now analyse the factors that explain this difference.<br />
The key factor <strong>here</strong> is the health services available to urban and rural households.<br />
The rural households are more vulnerable than the urban households due to higher<br />
prevalence of unhygienic toilets. Also, the members of rural households have more<br />
injuries to natural disasters.<br />
The rural households are also vulnerable because of adverse social and demographic<br />
profile. The rural households have more female members in the households; dependency<br />
ratio is also higher. Urban household heads have more years of schooling. The average<br />
age of the urban household heads is also lower.<br />
The rural households have been found to have a weaker social network. This may be<br />
explained by relative remoteness in the rural areas of the coastal regions of Bangladesh.<br />
Although the rural households are better positioned in terms of the number of sources of<br />
14
Results and Analysis 15<br />
assistance received and also in terms of total assistance received, they are worse off in<br />
terms of availability of amenities such as the number of schools, health care, etc. These<br />
amenities are available more to the households living in the urban areas.<br />
The rural households are also more vulnerable than their urban counterparts from<br />
natural disaster and climate variability. While in some respects the urban households are<br />
more vulnerable (number of disaster, damaged household assets and fishes in ponds), in<br />
others it is the other way round (crops, livestock, fishing equipment damaged). The<br />
crucial factor <strong>here</strong> is the weaker housing structures in the rural areas. The houses are not<br />
as strong as urban houses and this increases vulnerability.<br />
Rural households are more vulnerable in terms of better source of drinking water. A<br />
larger percentage of households in the rural areas reported that they depend on unsafe<br />
source of drinking water such as ponds or river.<br />
The relative contribution of the major components is shown in the spider diagram<br />
(Figure 5.2). The contrast in vulnerabilities in urban and rural regions is also depicted.<br />
Figure 5.2 Vulnerability Spider Diagram of the LVI for Urban and Rural Regions<br />
SDP<br />
NDCV<br />
LS<br />
WATER<br />
SN<br />
FOOD<br />
HEALTH<br />
Urban<br />
Rural<br />
15
16<br />
Measurement of Livelihoods Vulnerability Index for the Coastal Districts of Bangladesh<br />
5.3 Vulnerability from Floods and Cyclones<br />
Are households more vulnerable to floods than to cyclones? If so, what key factors<br />
explain these differential vulnerabilities?<br />
LVI calculated for the cyclones (.339) is found to be higher than the LVI calculated<br />
for floods (.320).<br />
Social networks do not work well during cyclones as compared to floods.<br />
Vulnerabilities from all the sub-components of the major component social network are<br />
found to be higher for cyclones as compared to floods.<br />
Water is also a crucial factor. Safe source of drinking water becomes more<br />
problematic during cyclones as compared to floods. Besides, t<strong>here</strong> is more scarcity of<br />
drinking water during cyclones. More households have to pay for water during cyclones<br />
as compared to during floods.<br />
The relative contribution of the major components is shown in the spider diagram<br />
(Figure 5.3). It shows the major components that explain the difference in vulnerability of<br />
the households under flood and cyclone situations.<br />
Figure: 5.3 Vulnerability Spider Diagram of LVI from Flood and Cyclone<br />
SDP<br />
NDCV<br />
LS<br />
WATER<br />
SN<br />
FOOD<br />
HEALTH<br />
Flood<br />
Cyclone<br />
16
Results and Analysis 17<br />
Major<br />
Components<br />
Table 5.1<br />
Indexed Sub-components, Major Components, and Overall LVI for the Regions Interior, Coastal,<br />
Urban, Rural, Flood Prone and Cyclone Prone<br />
SL Sub-components Units Interior Coastal Urban Rural Flood Cyclone Overall<br />
Livelihood Vulnerability Index, LVI 0.324 0.348 0.324 0.337 0.320 0.339 0.335<br />
1.1 Dependency ratio Average 0.498 0.498 0.487 0.500 0.514 0.493 0.498<br />
1.2 Per cent of female members in households Per cent 0.159 0.176 0.096 0.181 0.153 0.170 0.167<br />
1.3 Average education of the head of the household Average 0.149 0.215 0.109 0.194 0.172 0.182 0.180<br />
1.4 Average age of household heads Average 0.398 0.434 0.407 0.416 0.382 0.423 0.415<br />
1. Social and Demographic Profile, SDP (4) 0.301 0.330 0.275 0.323 0.305 0.317 0.315<br />
2.1 Agricultural livelihood diversification index Ratio 0.731 0.641 0.758 0.675 0.748 0.673 0.689<br />
2.2 Natural resource and livestock index Ratio 0.308 0.218 0.280 0.263 0.169 0.291 0.266<br />
2.3 Percentage of agricultural livelihoods Per cent 0.046 0.071 0.016 0.066 0.050 0.059 0.057<br />
2.4 Agricultural and fishing equipment value index Ratio 0.709 0.664 0.852 0.656 0.661 0.695 0.688<br />
2.5 Transportation assets value index Ratio 0.933 0.936 0.955 0.930 0.881 0.948 0.934<br />
2. Livelihood Strategies, LS (5) 0.545 0.506 0.572 0.518 0.502 0.533 0.527<br />
3.1 Availability of amenities Ratio 0.163 0.241 0.031 0.233 0.179 0.205 0.200<br />
3.2 Sources of assistance received Ratio 0.484 0.593 0.644 0.514 0.483 0.549 0.536<br />
3.3 Total assistance received Ratio 0.316 0.352 0.351 0.329 0.248 0.355 0.333<br />
3. Social Network, SN (3) 0.321 0.395 0.342 0.359 0.304 0.370 0.356<br />
4.1 Access to sanitary latrine Per cent 0.191 0.580 0.080 0.432 0.422 0.362 0.374<br />
4.2 Total person days of injury in the households Average 0.019 0.010 0.014 0.015 0.020 0.014 0.015<br />
4. Health, H (2) 0.105 0.295 0.047 0.224 0.221 0.188 0.194<br />
5.1 Number of months with adequate food supply Average 0.656 0.577 0.680 0.607 0.430 0.668 0.619<br />
5.2<br />
Number of months with adequate food supply<br />
from own production Average 0.879 0.879 0.902 0.875 0.917 0.869 0.879<br />
5.3 Extent of crop damage Average 0.857 0.778 0.848 0.814 0.799 0.825 0.820<br />
(Cont. Table 5.1)<br />
17
18<br />
Major<br />
Components<br />
Measurement of Livelihoods Vulnerability Index for the Coastal Districts of Bangladesh<br />
SL Sub-components Units Interior Coastal Urban Rural Flood Cyclone Overall<br />
5. Food, F (3) 0.798 0.745 0.810 0.765 0.715 0.787 0.773<br />
6.1 Unsafe source of drinking water Per cent 0.319 0.016 0.057 0.200 0.046 0.210 0.177<br />
6.2 Distance to source of natural water Average 0.872 0.932 1.000 0.881 0.991 0.877 0.900<br />
6.3 Whether experienced scarcity of water Per cent 0.142 0.368 0.227 0.252 0.119 0.281 0.248<br />
6.4 Whether the household spent money to get water Average 0.015 0.010 0.038 0.007 0.010 0.013 0.012<br />
6.Water, W (4) 0.337 0.332 0.330 0.335 0.291 0.345 0.334<br />
7.1 Number of natural disasters during the last 20 Average 0.123 0.297 0.238 0.198 0.353 0.166 0.205<br />
years<br />
7.2 Number of times affected by disaster Average 0.191 0.320 0.292 0.243 0.435 0.204 0.251<br />
7.3 Value of crops damaged Average 0.015 0.029 0.019 0.022 0.020 0.023 0.022<br />
7.4 Value of pond fish damaged Average 0.020 0.018 0.029 0.017 0.023 0.018 0.019<br />
7.5 Value of livestock damaged Average 0.035 0.053 0.030 0.046 0.029 0.047 0.043<br />
7.6 Value for damaged agricultural equipment Average 0.004 0.000 0.000 0.002 0.000 0.002 0.002<br />
7.7 Value for damaged fishing equipment Average 0.026 0.018 0.016 0.024 0.020 0.023 0.022<br />
7.8 Value for damaged household items Average 0.011 0.015 0.039 0.008 0.004 0.015 0.013<br />
7.9 Indicator of vulnerable house Ratio 0.436 0.511 0.218 0.522 0.322 0.510 0.471<br />
7. Natural Disaster and Climate Variability, NDCV (9) 0.096 0.140 0.098 0.120 0.134 0.112 0.117<br />
18
CHAPTER 6<br />
POLICY IMPLICATIONS<br />
Social networks play an important role in determining vulnerabilities in the coastal<br />
districts in Bangladesh. In order to improve the social networks of people living in the<br />
coastal regions, more amenities have to be made available t<strong>here</strong>. Such assistance includes<br />
cyclone shelters, markets, fire services, health care facilities, schools and so on. On the<br />
other hand, the government should increase various assistance given to the coastal<br />
households and the NGOs should be requested to increase their support. Improving these<br />
amenities will reduce vulnerability amongst the households living in the coastal regions,<br />
particularly those living in the rural areas.<br />
Access to safe drinking water, particularly during natural disasters, plays a key role in<br />
reducing vulnerabilities. Improving the quality of drinking water will reduce rural<br />
vulnerability. The government can install more tub-wells in the rural areas or distribute<br />
water purifying tablets during natural disasters.<br />
The issue of sanitary services has been identified in this study. The government<br />
should improve the sanitary conditions in the coastal regions. Also, more clinics and<br />
hospitals should be built in the coastal regions, particularly in the rural areas, so that days<br />
lost in injuries can be reduced.<br />
The government should invest in disaster preparedness and early warning and<br />
increase the number of cyclone shelters in the coastal region. Investment in education in<br />
the rural areas in the coastal regions will also reduce vulnerability. We have also found<br />
that stronger houses reduce vulnerability. The government should make stronger houses<br />
during rehabilitation or provide incentive to the rural households for making stronger<br />
houses.
CHAPTER 7<br />
LIMITATIONS OF THE STUDY<br />
A balanced weighted average approach was used in the construction of the LVI<br />
w<strong>here</strong> each sub-component contributes equally to the overall index. If these weights were<br />
derived from other methods such as discussion with the stakeholders, this would have<br />
improved the index.<br />
We could not use rainfall and temperature data as these are not available at the subdistrict<br />
levels. It was also not possible to classify the coastal regions in a meaningful way<br />
so that the rainfall and temperature data could be incorporated.<br />
Finally, although we used primary data, it was not collected for measuring<br />
vulnerability. As information was available that could be used to measure LVI, we have<br />
used this opportunity. However, this resulted in the absence of more detail explanation of<br />
the factors that could better explain differential vulnerabilities. The sub-components were<br />
not determined by making field level qualitative exercises but, to our judgement, they do<br />
reflect different dimensions of vulnerability in the coastal region of Bangladesh. It is<br />
intuitive that coastal households are more vulnerable than the households in the interior<br />
or that the rural households are more vulnerable than the urban households respectively.<br />
This we have shown to be true with the data generated from the survey and using the<br />
LVI.<br />
Given these limitations, the study has shown the usefulness of survey data in<br />
measuring LVI. It has also shown that LVI can be used to explain differences in<br />
vulnerability beyond region and capture dimensions of location (coastal and interior,<br />
urban or rural) or even types of disasters (flood and cyclones).
CHAPTER 8<br />
SUMMARY AND CONCLUSIONS<br />
Climate change is explained by changes in temperature and rainfall and its variability<br />
and unpredictability. These make the livelihood of those affected vulnerable. While<br />
massive changes are brought about, often slowly over a longer period, to resource<br />
systems and ecology, the final impact is on people. The pathways to this impact come<br />
from a wide range of factors. They include demographic, health, water and other factors.<br />
These are included in the construction of a LVI or livelihood vulnerability index. In this<br />
paper we have measured the LVI of 12 coastal districts of Bangladesh from a survey of<br />
532 households. We have found that households living in coastal region are more<br />
vulnerable than those living in the interior region and those living in the rural areas are<br />
more vulnerable than those living in the urban areas. We have also found that<br />
vulnerability from cyclones in the coastal region is higher than vulnerability from floods.<br />
Moreover, this paper has identified the factors that explain the vulnerability. For<br />
example, health facilities, access to water, quality of the houses built by the households<br />
,etc. play a major role in explaining vulnerabilities. Policies have been suggested to<br />
address these issues.
24<br />
REFERENCES<br />
Eakin, H. and L. A. Bojorquez-Tapia. 2008. “Insights into the Composition of Household<br />
Vulnerability from Multicriteria Decision Analysis.” Global Environmental Change, 18:<br />
112–127.<br />
Fields, S. 2005. “Why Africa’s Climate Change Burden is Greater.” Environmental Health<br />
Perspectives, 113: A534–A537.<br />
Hahn, M., A. Riederer and O. Foster. 2009. “The Livelihood Vulnerability Index: A Pragmatic<br />
Approach to Assessing Risks from Climate Variability and Change: A Case Ctudy in<br />
Mozambique.” Global Environmental Change, 19: 74–88.<br />
IPCC. 2001. Climate Change 2001: Impacts, Adaptation, and Vulnerability. Contribution of<br />
Working Group II to the Third Assessment Report. Cambridge, UK: Cambridge University<br />
Press.<br />
Kasperson, R. E. and J. X. Kasperson. 2001. Climate Change, Vulnerability, and Social Justice.<br />
Risk and Vulnerability Programme, Stockholm Environment Institute, Stockholm.<br />
PDO-ICZMP (Program Development Office for Integrated Coastal Zone Management Plan).<br />
2003. “Coastal Livelihoods Situation and Context.” Working Paper WP015, Dhaka.<br />
───2004. “Living in the Coast: Problems, Opportunities and Challenges.” Living in the Coast<br />
Series 2, Dhaka, pp. 13-15.<br />
Sen, B. and M. Yunus. 2011. “Poverty and Vulnerability in Adverse Ecological Environments:<br />
Evidence from the Coastal Areas of Bangladesh.” Unpublished Report, <strong>BIDS</strong>.<br />
Vincent, K. 2007. “Uncertainty in Adaptive Capacity and the Importance of Scale.” Global<br />
Environmental Change, 17: 12–24.


