Proceedings OF ThE - Australian Institute of Animal Management Inc
Proceedings OF ThE - Australian Institute of Animal Management Inc
Proceedings OF ThE - Australian Institute of Animal Management Inc

You also want an ePaper? Increase the reach of your titles
YUMPU automatically turns print PDFs into web optimized ePapers that Google loves.
86 <strong>Proceedings</strong> 2012<br />
AIAM Annual Conference on <strong>Animal</strong> <strong>Management</strong><br />
2. Determine how<br />
Do you have the data in order to carry out your<br />
analyses or do you need to first go out and<br />
collect it?<br />
In this example we are going to assume you<br />
already have the data. We are going to analyse<br />
all customer requests received by council in the<br />
last year<br />
3. List and rank order the events according to<br />
the number <strong>of</strong> events associated with each –<br />
most to least<br />
In this example, you can see that all types <strong>of</strong><br />
customer requests are listed in Column A.<br />
In Column B they are ranked from most (Dog<br />
collections) to least (Dog rush).<br />
4. Calculate the percentages <strong>of</strong> the events each<br />
person, place or product contributes or in this<br />
example, the customer request<br />
Column C in the table below presents the<br />
percentages.<br />
5. Cumulate the percentage <strong>of</strong> incidents starting<br />
with the most involved person, place, or product<br />
In this example, Column D presents the<br />
cumulative percentages.<br />
6. Cumulate the percentages <strong>of</strong> the people, places<br />
or products<br />
In this example, the cumulative percentage <strong>of</strong><br />
requests is presented in column E.<br />
7. Compare the cumulative percentage <strong>of</strong> people,<br />
places or products (column E) to the cumulative<br />
percentage <strong>of</strong> outcomes (column D)<br />
This shows how much the most involved people or<br />
places contribute to the problem.<br />
These kinds <strong>of</strong> calculations can be very helpful<br />
at showing where you should direct your animal<br />
management resources and efforts.<br />
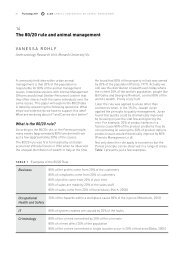
In this example you can see that over 70% <strong>of</strong> the<br />
customer requests are caused by only 25% <strong>of</strong> the<br />
possible animal management issues. In other words<br />
dog collections and barking dog requests contribute<br />
to more than 70% <strong>of</strong> the customer requests. In<br />
theory focussing your efforts on these two issues<br />
rather than all <strong>of</strong> the animal management issues<br />
could be a very efficient strategy for reducing the<br />
number <strong>of</strong> customer requests.<br />
Table 2 Example 80/20 table<br />
A B C D E<br />
Customer<br />
requests<br />
Dog<br />
collections<br />
Barking<br />
dogs<br />
Dog<br />
<strong>of</strong>f-leash/<br />
not under<br />
effective<br />
control<br />
Cat<br />
collections<br />
Trespassing<br />
cats<br />
Dogs<br />
wandering<br />
at large<br />
Frequency Percent<br />
<strong>of</strong> total<br />
Cumulative<br />
percent <strong>of</strong><br />
total<br />
Cumulative<br />
percent <strong>of</strong><br />
requests<br />
430 40.53 40.53 12.50<br />
350 32.99 73.52 25.00<br />
71 6.69 80.21 37.50<br />
70 6.60 86.81 50.00<br />
64 6.03 92.84 62.50<br />
50 4.71 97.55 75.00<br />
Dog attack 24 2.26 99.81 87.50<br />
Dog rush 2 0.19 100.00 100.00<br />
Totals 1061 100.00 100.00 100.00<br />
Conclusion<br />
The 80/20 rule or the Pareto principle states that<br />
20% <strong>of</strong> the causes are the source <strong>of</strong> 80% <strong>of</strong> the<br />
effect. Since its inception in 1906, the rule has<br />
been applied to a diverse range <strong>of</strong> areas including<br />
criminology, business, and occupational health and<br />
safety. Applying the rule to project management<br />
has the benefit <strong>of</strong> improving both effectiveness<br />
and efficiency by identifying the vital 20% for the<br />
most benefit. While scholarly research applying the<br />
80/20 rule to animal management is lacking, animal<br />
management <strong>of</strong>ficers can apply this tool to their own<br />
data so that they can not only determine the extent<br />
to which the 80/20 rule applies but most importantly<br />
can use it to identify where they need to direct their<br />
animal management resources and efforts.<br />
References<br />
Boba, R. (2005). Crime analysis and crime mapping. Sage<br />
Publications: Thousand oaks CA,<br />
City <strong>of</strong> Port Phillip. Domestic <strong>Animal</strong> <strong>Management</strong> Plan 2008-11.<br />
Headey, B. (2006) National People and Pets Survey, Socially<br />
Responsible Pet Ownership Practices in Australia: A Decade <strong>of</strong><br />
Progress. Melbourne: Petcare Information and Advisory Service<br />
Australia Pty Ltd.<br />
Koch, Richard, (2008). The 80/20 Principle: The Secret to<br />
Achieving More with Less. DoubleDay: New York