Report - Masan Group
Report - Masan Group
Report - Masan Group

You also want an ePaper? Increase the reach of your titles
YUMPU automatically turns print PDFs into web optimized ePapers that Google loves.
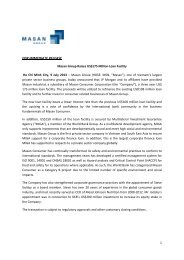
<strong>Masan</strong> <strong>Group</strong> Corp (HSX: MSN)<br />
UPDATE<br />
5 April 2012<br />
18 March 2011<br />
HOLD<br />
Giang Hoang<br />
Senior analyst<br />
Giang.hoang@vcsc.com.vn<br />
+84 8 3 914 3588 ext. 142<br />
Phong Nguyen<br />
Analyst<br />
Phong.nguyen@vcsc.com.vn<br />
+84 8 3 914 3588 ext. 120<br />
Target price VND123,000<br />
Upside 8%<br />
Conglomerate<br />
Key Indicators<br />
Price @4 April 2012 114,000<br />
Target price 123,000<br />
52-week low 80,000<br />
52-week high 158,000<br />
Avg 20 day trading value (USD) 764,000<br />
Outstanding shares (mn) 515<br />
Market capitalization (VND bn) 59,256<br />
Market capitalization (USD mn) 2,822<br />
Foreign ownership 22%<br />
Valuation 2010 2011 2012F<br />
EPS (basic) 4,431 3,823 5,438<br />
EPS growth % 216.5% -13.7% 42.3%<br />
P/E (market) 26.2 30.3 21.3<br />
P/B (market) 5.6 3.8 3.2<br />
ROE 21.5% 29.7% Na<br />
ROA 10.8% 6.0% Na<br />
Performance 3M 6M 12M<br />
Absolute % 5.5% -6.5% 40.2%<br />
Relative % 1.0% -7.8% 44.5%<br />
100%<br />
50%<br />
0%<br />
-50%<br />
MSN<br />
VNIndex<br />
Ownership structure<br />
<strong>Masan</strong> Corp. 48.6%<br />
Sunflower Ltd. 19.4%<br />
BankInvest 9.7%<br />
<strong>Masan</strong>: Firing on all cylinders<br />
We remain bullish on <strong>Masan</strong> <strong>Group</strong> and increase our target price to<br />
VND123,000 from our previous target of VND97,500. We use an SoTP<br />
approach to derive our target price where we valued the <strong>Group</strong>’s main businesses<br />
separately. Our target price provides a 8% upside to the current price.<br />
We feel our valuation approach is inherently conservative and has yet to reflect<br />
value accretion from M&As that may be in the pipeline. Considering the company’s<br />
current war chest and proven track record, we believe M&A announcements along<br />
with <strong>Masan</strong> Consumer and Techcombank’s huge growth potentials could unleash<br />
major upside catalysts for the <strong>Group</strong>. Stronger mineral prices as Nuiphao gets<br />
closer to operational status could also warrant positive re-pricing of the stock.<br />
On the face of it, the stock is trading at 21.3x FY2012F earnings. However, we<br />
feel the PER is inflated by the fact that the Nuiphao is not yet an operating asset.<br />
Backing out our USD890mn estimated value of Nuiphao from the current market<br />
cap would indicate that the stock is trading at a much more reasonable 16.0x<br />
FY2012F earnings. This confirms our view that the stock still has more upside<br />
potential and is a 2014 play when Nuiphao is fully operational and brings<br />
substantial cash flows of ~USD300mn, contributing to the <strong>Group</strong>’s total cash flows<br />
of ~USD560mn. Furthermore, the stock is trading at an undemanding 12.2x our<br />
FY2013F earnings and 6.1x our FY2014F earnings.<br />
FY2011 Results<br />
<strong>Masan</strong> Consumer (MSC) continues to lead the non-discretionary F&B<br />
markets. We think MSC’s 2011 revenue growth of 26% is commendable in spite<br />
of increasing competition in most of MSC’s key products. To fight off competition,<br />
MSC continues to master their brand umbrella approach to introduce new products<br />
and expand their presence in these key markets. In November 2011 the company<br />
launched Nam Ngu III targeting the lower end fish sauce market and Kokomi<br />
targeting the mass noodle market.<br />
We think MSC will be able to maintain their dominance in the fish sauce market<br />
given their current 74% market share (vs. 70% in 2010) in the branded segment<br />
and their continued expanded presence in the unbranded one through introduction<br />
of lower end products. Within the noodle market, we’ve noticed that other<br />
competitors including Acecook and Asia Foods are playing more aggressively in<br />
their marketing strategies to gain consumer awareness. Despite such fierce<br />
competition, MSC managed to increase its noodle market share to 17% in 2011<br />
from 14% in 2010.<br />
We think that MSC can maintain above-average growth in the noodle market<br />
thanks to its aggressive marketing and extensive distribution reach. In 2011 the<br />
company increased points of sales to 164,000 from 140,000 in 2010, especially in<br />
the rural areas. Other products including soya sauce and chilli sauce continued to<br />
claim 80% and 37% market shares respectively in 2011.<br />
See important disclosure at the end of this document<br />
www.vcsc.com.vn | VCSC Viet Capital Securities | 1
All <strong>Report</strong> Types<br />
5 April 2012<br />
<strong>Masan</strong> <strong>Group</strong> Corp. (HSX: MSN)<br />
HOLD<br />
18 March 2011<br />
Figure 1: <strong>Masan</strong> Consumer revenue breakdown<br />
(VND bn) 2010 2011 Growth 2012F<br />
Fish sauce 3,072 3,687 24% 4,793<br />
Noodle 1,397 1,955 40% 2,933<br />
Soya sauce 726 792 9% 863<br />
Chilli sauce 391 403 3% 515<br />
Instant coffee - 320 - 2,093<br />
Total revenue 5,586 7,156 27% 11,096<br />
Source: VCSC estimates<br />
MSC has stuck to its strategy on brand building, targeting premium market segments to<br />
create new market categories and using the brand umbrella to introduce products targeting<br />
the mass market segment. Focus on building brands has helped the company differentiate<br />
its products relative to its competitors, which have followed a price competition model, and<br />
helped expand margins in spite of the challenges related to Vietnam macro economy. We<br />
are encouraged with the company’s progress on improving margin within the noodle<br />
segment. Noodle gross margin has increased significantly from 19% in 2010 to almost 30%<br />
in 2011. Fish sauce continued to deliver 47-50% gross margin while soy sauce brought 39%<br />
and chili sauce brought 38% gross margins in 2011. Overall, gross margins have increased<br />
from 11.8% in 2006 to 43.4% in 2011, highlighting the significant improvement that the<br />
company has been able to achieve through building a scalable platform. We think MSC will<br />
continue to improve margins across its product portfolio in 2012, especially with the new<br />
automated fish sauce production line which helps reduce labour costs.<br />
Figure 2: Continuous improvement in gross margins<br />
Figure 3: Market share by product<br />
50%<br />
40%<br />
30%<br />
24.4%<br />
Gross margin<br />
31.1% 34.7% 42.8% 43.3%<br />
2011 2010<br />
Fish sauce 74% 70%<br />
Noodle 17% 14%<br />
20%<br />
10%<br />
0%<br />
11.8%<br />
2006 2007 2008 2009 2010 2011<br />
Soya sauce 80% 80%<br />
Chilli sauce 37% 37%<br />
Instant coffee 40% 45%<br />
Source: MSN<br />
<strong>Masan</strong> Resources (MR) has almost completed the compensation and resettlement<br />
process and started construction. The company has invested ~USD80mn in 2011.<br />
According to management, the Nuiphao project is well on track to start ramp-up in mid<br />
FY2013. We are also encouraged to learn that MR has already signed off take agreements<br />
for fluorspar and bismuth and is negotiating contracts for tungsten. Of note, market prices<br />
for these products have been relatively stable since our last report. Tungsten price has<br />
slightly decreased by 3% while fluorspar has increased by 10%, copper decreased by 10%,<br />
and bismuth decreased by 12%.<br />
See important disclosure at the end of this document<br />
www.vcsc.com.vn | VCSC Viet Capital Securities | 2
All <strong>Report</strong> Types<br />
5 April 2012<br />
<strong>Masan</strong> <strong>Group</strong> Corp. (HSX: MSN)<br />
HOLD<br />
18 March 2011<br />
Figure 4a: Tungsten price (USD/mtu)<br />
Figure 4b: Fluorspar price (USD/ton)<br />
500<br />
Tungsten<br />
600<br />
Fluorspar<br />
450<br />
500<br />
400<br />
400<br />
350<br />
300<br />
300<br />
250<br />
200<br />
01/05/2011 05/05/2011 09/05/2011 01/05/2012<br />
200<br />
100<br />
0<br />
08/03/2010 01/09/2010 07/03/2011 06/09/2011 28/2/2012<br />
Figure 4c: Bismuth price (USD/lb)<br />
Figure 4d: Copper price (USD/lb)<br />
14<br />
13<br />
12<br />
11<br />
10<br />
9<br />
8<br />
7<br />
6<br />
Bismuth<br />
01/05/2011 07/05/2011 01/05/2012<br />
5<br />
5<br />
4<br />
4<br />
3<br />
3<br />
2<br />
Copper<br />
01/03/2011 05/03/2011 09/03/2011 01/03/2012<br />
Source: Bloomberg<br />
Techcombank (TCB) remained one of the fastest growing banks. Despite many<br />
challenges for banking sector in 2011, TCB was one of the fastest growing banks. It<br />
recorded an annual growth in assets of 20.3% while net profits increased 53.2%, beating<br />
our previous forecasts of 18% and 17% respectively.<br />
These achievements were mainly due to better-than-expected net interest income driven by<br />
higher yields on assets and lower costs of funds. We had previously forecasted that earning<br />
yield would be around 11%, which represented a growth of 3.6% from 2010. However, as<br />
the central bank tightened monetary policies, credit supply decreased significantly while<br />
demand for loans remained high. Consequently, earning yield increased to 12.9%. On the<br />
other hand, as the SBV was strictly enforcing the deposit rate cap at 14%, the cost of funds<br />
was lower than our initial estimate of 8%. As a result, Net Interest Margin (NIM) saw a<br />
significant increase in 2011, rising by 1.8% to 4.7%, helping to offset the lower credit growth.<br />
TCB also received about ~USD50mn loans at low cost of financing from financial institutions<br />
such as the FMO.<br />
Corporate bond investments were also another key driver for TCB’s earnings in 2011 and<br />
could be means to grow credit despite the 17% cap. Total investments in corporate bond<br />
increased from VND6,134bn at the beginning of the year to VND16,093bn by the end of<br />
See important disclosure at the end of this document<br />
www.vcsc.com.vn | VCSC Viet Capital Securities | 3
All <strong>Report</strong> Types<br />
5 April 2012<br />
<strong>Masan</strong> <strong>Group</strong> Corp. (HSX: MSN)<br />
HOLD<br />
18 March 2011<br />
September 2011. If we include the corporate bond to the bank’s loans, credit growth would<br />
be closer to 24%.<br />
The bank was not immune to the 2011 macroeconomic hardships the country experienced.<br />
Provision expenses went from VND476bn to VND943bn as the bank’s non-performing loans<br />
increased 45%, to VND1,757bn by the end of September. However, the bank’s saving grace<br />
is that it applies a risk management policy where loans are collateralized 260% to loan<br />
value, which should help dampen the impact of NPLs on the bank’s book value.<br />
Figure 5: Major commercial banks<br />
CTG VCB ACB TCB EIB STB<br />
Asset 460,387 368,539 281,032 190,867 183,697 140,137<br />
Asset growth 25.4% 20.0% 37.0% 27.0% 40.1% -1.4%<br />
Equity 27,567 28,807 13,845 14,381 16,311 14,224<br />
Equity growth 51.70% 41.22% 21.70% 53.20% 20.65% 3.80%<br />
Credit Growth 25.25% 18.50% 18.40% 20% 19.80% -2%<br />
NIM 5.10% 3.40% 3.70% 4.7% 3.70% 4.2%<br />
Net Income 5,784 5,971 3,218 3,141 3,051 2,033<br />
Earnings growth 77.6% 9.1% 37.9% 53.2% 68.6% 13.0%<br />
Book value 1,243 1,462 1,477 1,640 1,302 1,298<br />
NPL 0.7% 2.0% 0.8% 2.0% 1.6% 0.6%<br />
EPS 2,608 3,031 3,432 3,614 2,436 1,854<br />
ROE 21.0% 20.7% 23.2% 21.8% 18.7% 14.3%<br />
ROA 1.3% 1.6% 1.1% 1.6% 1.7% 1.5%<br />
Source: VCSC estimates, Banks’ statements<br />
2012 Earnings Outlook<br />
<strong>Masan</strong> Consumer<br />
We expect MSC’s revenue to continue to grow at a CAGR of 25-30% over the next five<br />
years with the potential to generate USD1bn in revenue by 2016. We are confident that<br />
MSC’s defensive product portfolio, sticky prices for non-discretionary products and a strong<br />
distribution channel will continue to offer favourable tail winds to the business. For 2012,<br />
expect that MSC will make VND11,096bn in revenue (+32% YoY) and VND2,939bn in net<br />
profit (+24% YoY), in which VCF will generate VND2,093bn in revenue (+32% YoY) and<br />
VND296bn in net profit (+37% YoY). We only assume organic growth from the company’s<br />
current business portfolio and believe that easing macroeconomic pressure and the launch<br />
of new products could form catalysts to deliver upside to these estimates.<br />
We think revenue growth will come mostly from volume growth as MSC penetrates into the<br />
vast unbranded markets and converts it into branded. Euromonitor valued the branded fish<br />
sauce market at USD324mn in 2010 and expects it to grow to USD420mn in 2013 with<br />
CAGR of 6%. The unbranded segment, which had around the same value as the branded<br />
segment in 2010, claims ~60% of the total volume sold in the country. The noodle market is<br />
valued at USD829mn in 2010 and is expected to grow to USD1.1bn in 2013 with CAGR of<br />
8%. We see huge room for continued growth in MSC.<br />
See important disclosure at the end of this document<br />
www.vcsc.com.vn | VCSC Viet Capital Securities | 4
All <strong>Report</strong> Types<br />
5 April 2012<br />
<strong>Masan</strong> <strong>Group</strong> Corp. (HSX: MSN)<br />
HOLD<br />
18 March 2011<br />
We think MSC will continue to improve margins across its product portfolio in 2012,<br />
especially with the new automated fish sauce production line which helps reduce labour<br />
costs and losses. We forecast that overall gross margin will increase from 43.3% in 2011 to<br />
44.1% in 2012, reflecting strong growth from instant noodle segment, which will bring 30%<br />
gross margin vs. 28% in 2011.<br />
VCF will contribute important earnings to MSC starting 2013 when the new capacity comes<br />
online. Regarding the synergy between VCF and MSC, we think VCF can immediately<br />
benefit from the vast distribution that MSC has built over the years. Currently VCF offers its<br />
products through 120 distributors with a very strong focus on Southern Vietnam, as over<br />
100 of these distributors are based in the South. Meanwhile, MSC has a well-balanced<br />
distribution in place with 60 distributors and more than 60,000 PoS in Northern Vietnam<br />
which MSC can leverage to introduce VCF products. We also think the acquisition of VCF<br />
gives MSC immediate scale and market leading platform to move aggressively into the<br />
beverage space.<br />
VCF’s new factory is expected to start operation in 4Q12 and run at 25% total designed<br />
capacity or 800tons/year in 2012. New capacity will help reduce the amount of imported<br />
materials and therefore boost margins. We estimate that gross margin will increase to 30%<br />
in 2012 from 25% in 2011.<br />
<strong>Masan</strong> Resources<br />
The mine won’t bring any substantial earnings in 2012 since this year the company is<br />
disbursing heavily on construction. Therefore we do not expect interest income like in 2011<br />
when the cash was not deployed. We expect tungsten prices to remain relatively firm given<br />
the scarcity of production outside China and tight supply dynamics. We think Nuiphao also<br />
holds strategic importance given China’s export restrictions and export tax increases.<br />
MR has also recently announced to have secured an USD80mn loan from Standard<br />
Chartered Bank and is now fully financed to start construction in 2012; we expect Nuiphao<br />
to start ramp-up in mid 2013 and officially come online in 4Q13. Nuiphao will be fully<br />
operational and bring substantial earnings to the <strong>Group</strong> in 2014.<br />
Techcombank<br />
Based on its impressive historical results, strong investments in technology, extensive<br />
banking network, and strong efficiencies, TCB is well-positioned to maintain robust<br />
performance in the coming years. We expect total operating income to grow 11% YoY<br />
thanks to fee income growth, and that the bank will register a 13% net income growth to<br />
VND3,556bn in 2012.<br />
Interest income will continue to drive TCB’s profit growth. However, 2012 may challenge<br />
TCB’s growth as NIM get squeezed. We expect NIM could drop to 3.8% in 2012 as lending<br />
rates could drop faster than costs of funds. The SBV’s 17% cap on credit growth is below<br />
the average credit growth of ~20% the G12 banks registered in 2011.<br />
We expect provision expenses to increase to around VND954bn as the bank’s NPL could<br />
still reach ~3% in 2012 However, the bank’s saving grace is that has applied a policy where<br />
loans are collateralized 260% to loan value, which should help dampen the impact of NPLs<br />
on the bank’s book value.<br />
See important disclosure at the end of this document<br />
www.vcsc.com.vn | VCSC Viet Capital Securities | 5
All <strong>Report</strong> Types<br />
5 April 2012<br />
<strong>Masan</strong> <strong>Group</strong> Corp. (HSX: MSN)<br />
HOLD<br />
18 March 2011<br />
Fee income is another key revenue driver for 2012. We expect it to grow ~30% on the back<br />
of branches and ATMs expansion and strong retail focus.<br />
Figure 6: Techcombank earnings forecast<br />
Income (bn VND) 2009 2010 2011 2012F 2013F<br />
Net interest income 2,500 3,184 6,833 6,956 7,922<br />
Net fee & commission income 641 930 1,209 1,495 1,846<br />
Total operating income 3,918 4,719 7,974 8,859 10,212<br />
Operating expenses (1,184) (1,588) (2,847) (3,163) (3,646)<br />
Pre-provision profits 2,734 3,131 5,127 5,696 6,566<br />
Provision loss (481) (388) (944) (954) (-1,027)<br />
Profit before tax 2,253 2,744 4,183 4,742 5,539<br />
Income tax (553) (671) (1,046) (1,185) (1,385)<br />
Net profit 1,700 2,073 3,137 3,556 4,154<br />
Source: Techcombank, VCSC estimates<br />
Valuation of <strong>Masan</strong> <strong>Group</strong><br />
We used an SoTP approach to derive our target price where we valued the <strong>Group</strong>’s main<br />
businesses separately. We feel our valuation approach is inherently conservative and has<br />
yet to reflect value accretion from M&As that may be in the pipeline.<br />
Only assuming organic growth from its current business portfolio, we believe our current<br />
valuation is attractive as the company could provide further upside with accretive<br />
acquisitions, new product launches, and successful exploitation of both proven and probable<br />
reserves at Nuiphao. Furthermore, considering the company’s current war chest and proven<br />
track record, we believe M&A announcements could unleash further major upside catalysts<br />
for the <strong>Group</strong>.<br />
• <strong>Masan</strong> Consumer: We value <strong>Masan</strong> Consumer using a 10-year DCF valuation<br />
model through 2021 to best reflect the company’s growth potentials. We calculate<br />
<strong>Masan</strong> Consumer’s equity value at VND49,101bn or USD2.34bn, in which<br />
VND37,563bn or USD1.79bn is attributed to the <strong>Group</strong>. Our valuation for MSC<br />
therefore has increased by ~20% compared to the previous forecast.<br />
• Techcombank: With a prudent view on the macro picture, the banking system’s<br />
woes and TCB’s performance in the first three quarters, we were conservative in<br />
our forecast of VND11,800bn for the bank’s book value in 2011. However, thanks to<br />
strong performance in the last quarter, TCB’s book value increased robustly to<br />
VND15,666bn by the end of FY11. As we expect the bank to continue to<br />
outperform, we estimate TCB’s book value to reach VND18,428bn by the end of<br />
FY12 rising by ~48% compared to our previous forecast.<br />
• <strong>Masan</strong> Resources: We value the mine based on both proven and probable<br />
reserves with the corresponding confidence levels: 90% confidence of recovery for<br />
proven reserves and 50% confidence of recovery for probable reserves. We apply<br />
selling prices as of March 26 th 2012. We value the mine at VND18,679bn or<br />
USD890mn.<br />
See important disclosure at the end of this document<br />
www.vcsc.com.vn | VCSC Viet Capital Securities | 6
All <strong>Report</strong> Types<br />
5 April 2012<br />
<strong>Masan</strong> <strong>Group</strong> Corp. (HSX: MSN)<br />
HOLD<br />
18 March 2011<br />
We emphasize that MSN is a 2014 play when Nuiphao is fully operational and brings<br />
substantial cash flows. We estimate MSN is trading at 21.3x 2012F diluted EPS of<br />
VND3,574, 12.2x 2013F diluted EPS of VND6,225, and 6.1x 2014F diluted EPS of<br />
VND11,396. We also feel the PER 2012F is inflated by the fact that the Nuiphao is not yet<br />
an operating asset. Backing out our USD890mn estimated value of Nuiphao from the<br />
current market cap would indicate that the stock is trading at a much more reasonable 16.0x<br />
FY2012F earnings.<br />
Figure 7: SoTP valuation – basic<br />
(VND bn) Methodology Valuation MSN's stakes MSN's interest<br />
<strong>Masan</strong> Consumer DCF 49,101 76.5% 37,563<br />
Techcombank P/B 27,280 30.8% 8,402<br />
Nuiphao NPV 18,679 80.0% 14,943<br />
VCF EV/EBITDA 4,446 50.1% 2,227<br />
Total 63,136<br />
Net cash 240<br />
Equity Value 63,376<br />
Shares outstanding 515,272,269<br />
Share value (VND) 122,994<br />
Source: VCSC<br />
We also calculate MSN’s fully-diluted share value at VND92,153 assuming conversion to<br />
equity of convertible debt obligations exercisable through 2016. Net cash would increase to<br />
~VND9,114bn after conversion of these debt instruments.<br />
Figure 8: SoTP valuation – fully-diluted<br />
(VND bn) Methodology Valuation MSN's stakes MSN's interest<br />
<strong>Masan</strong> Consumer DCF 54,778 76.5% 41,905<br />
Techcombank P/B 27,280 30.8% 8,402<br />
Nuiphao NPV 18,679 80.0% 14,943<br />
VCF EV/EBITDA 4,446 50.1% 2,227<br />
Total 63,136<br />
Net cash 9,114<br />
Equity Value 72,250<br />
Shares Outstanding 784,017,103<br />
Share Value (VND) 92,153<br />
Source: VCSC<br />
See important disclosure at the end of this document<br />
www.vcsc.com.vn | VCSC Viet Capital Securities | 7
All <strong>Report</strong> Types<br />
5 April 2012<br />
<strong>Masan</strong> <strong>Group</strong> Corp. (HSX: MSN)<br />
HOLD<br />
18 March 2011<br />
Figure 9: Earnings forecast by subsidiaries<br />
(VND bn) 2012F 2013F 2014F<br />
MSC 2,790 3,457 4,589<br />
Contribution to MSN 76.5% 2,134 2,644 3,510<br />
TCB 3,556 4,154 5,600<br />
Contribution to MSN 30.8% minus amortization of goodwill 519 703 1,149<br />
MR - 1,644 6,081<br />
Contribution to MSN 80% - 1,315 4,864<br />
VCF 296 435 599<br />
Contribution to MSN 50.1% 149 218 300<br />
MSN GROUP 2,802 4,881 9,824<br />
Diluted EPS 3,574 6,225 12,530<br />
Diluted P/E at market price 21.3 12.2 6.1<br />
Source: VCSC<br />
1. Valuation of <strong>Masan</strong> Consumer<br />
We value <strong>Masan</strong> Consumer using a 10-year DCF valuation model through 2021 to best<br />
reflect the company’s growth potentials. We use a market risk premium of 11% and risk free<br />
rate of 11.5%, leading to a WACC of 19.2%. We calculate <strong>Masan</strong> Consumer’s equity value<br />
at VND49,101bn or USD2.34bn, in which VND37,563bn or USD1.79bn is attributed to the<br />
<strong>Group</strong>.<br />
DCF valuation<br />
Figure 10: <strong>Masan</strong> Consumer discounted cash flows<br />
VND bn 2012F 2013F 2014F 2015F 2021F<br />
EBIT 3,673 4,608 5,845 7,328 20,389<br />
Less: Tax -510 -640 -812 -1,018 -5,097<br />
Add: Dpr 158 197 248 304 704<br />
Less: Capex -90 -112 -141 -173 -401<br />
Add: ∆ in NWC 210 95 127 138 164<br />
FCFF 3,440 4,148 5,267 6,579 15,760<br />
PV 2,912 2,918 3,065 3,160 2,519<br />
Figure 11: <strong>Masan</strong> Consumer valuation assumptions<br />
Beta 1.0 Terminal Value (VND bn) 92,039<br />
Risk premium 11.0% PV of terminal value 14,714<br />
Risk free 11.5% PV of FCFF 29,756<br />
Cost of equity 22.5% PV of terminal value and FCFF 44,469<br />
Cost of Debt 15.0% Add: Cash & short investments 8,967<br />
Tax 25.0% Less: Debt 4,335<br />
WACC 19.2% Equity Value 49,101<br />
An equity value of VND49,101bn implies a 17.6x PER against our 2012F estimated<br />
earnings of VND2,790bn. We feel that MSC’s true comps are companies outside Vietnam<br />
given its market leadership, marquee investor base, access to long term capital and ability<br />
to attract global talent. Consequently, we feel our DCF is inherently conservative, and that<br />
See important disclosure at the end of this document<br />
www.vcsc.com.vn | VCSC Viet Capital Securities | 8
All <strong>Report</strong> Types<br />
5 April 2012<br />
<strong>Masan</strong> <strong>Group</strong> Corp. (HSX: MSN)<br />
HOLD<br />
18 March 2011<br />
MSC has the potential for upside re-rating closer to international peers, who are trading<br />
close to 30x 2012F earnings.<br />
Ticker Name Mkt Cap ROE P/E 2011 P/E 2012F<br />
NESZ MK Equity Nestle Malaysia 4,289 72.8 28.9 26.7<br />
NEST IN Equity Nestle India 8,526 90.3 41.1 37.5<br />
220 HK Equity Uni-President China 2,424 7.9 43.4 26.0<br />
151 HK Equity Want Want China 14,284 34.9 31.5 N/A<br />
322 HK Equity Tingyi 15,874 21.4 40.5 28.8<br />
Average 6,378 34.8 31.3 29.8<br />
Figure 12: Regional comparables 2012F P/E<br />
40<br />
35<br />
30<br />
25<br />
20<br />
15<br />
10<br />
5<br />
0<br />
Average 12F P/E = 29.8x<br />
17.6<br />
26.7<br />
37.5<br />
26.0<br />
31.5<br />
28.8<br />
MSC Nestle MK Nestle IN Uni<br />
President<br />
CN<br />
Want Want<br />
CN<br />
Tingyi CN<br />
Source: Bloomberg<br />
2. Valuation of <strong>Masan</strong> Resources<br />
We base our estimation of the mineral reserves on both proven feasibility study of 23mn<br />
tons with 90% confidence of recovery and probable of 32mn tons with 50% confidence of<br />
recovery. Therefore the risk of over-valuation is quite low. We apply the selling prices based<br />
on prices updated on March 26 th 2012 as a base case since given supply-demand growth<br />
imbalance of those minerals, price appreciation is reasonably expected. We calculate NPV<br />
of the mine at USD904mn at current mineral prices.<br />
Figure 13: Annual production (tons)<br />
Ore WO 3 CaF 2 Bi Cu Au (g/t)<br />
‘000 tons % % % % %<br />
Proven 23,515 0.262 8.57 0.112 0.232 0.269<br />
Probable 31,910 0.173 8.38 0.083 0.154 0.163<br />
Total 55,425 0.211 8.46 0.095 0.187 0.208<br />
Annual<br />
production 5,191 196,921 2,309 4,604 0.00518<br />
Source: MSN, VCSC estimates<br />
See important disclosure at the end of this document<br />
www.vcsc.com.vn | VCSC Viet Capital Securities | 9
All <strong>Report</strong> Types<br />
5 April 2012<br />
<strong>Masan</strong> <strong>Group</strong> Corp. (HSX: MSN)<br />
HOLD<br />
18 March 2011<br />
Annual production<br />
(tons)<br />
Price per tons<br />
(USD)<br />
Annual Sales<br />
(USD)<br />
Tungsten - WO3 5,191 43,700 226,831,733<br />
Bismuth - Bi 2,038 24,333 56,188,359<br />
Fluorspa - CaF2 196,921 550 108,306,720<br />
Copper 4,604 8,756 40,313,872<br />
Gold* (oz, USD/oz) 166 1,677 278,169<br />
Total 431,918,852<br />
(in USD mil) FY10 FY11 FY12 FY13 FY14 FY15 FY16 FY28<br />
Sales 108 432 441 449 570<br />
Opex 21 84 85 85 110<br />
EBITDA 87 348 355 364 460<br />
(-) D&A (9) (35) (35) (35) (35)<br />
(-) Interest - 22 18 15 -<br />
(-) Principal Repayment - (45) (45) (45) -<br />
EBT 78 290 293 298 424<br />
(-) Tax - - - (75) (106)<br />
Net Income 78 290 293 224 318<br />
(+) D&A 9 35 35 35 35<br />
(-) Capex (133) (80) (350)<br />
(+) Debt Borrowing 192 80<br />
(+) Cash from Mount Kellette 100<br />
Cash Flow (133) 212 (270) 87 325 328 259 353<br />
NPV (USDmn) 890<br />
3. Valuation of Techcombank<br />
We apply the FY12F PB of leading listed banks to value Techcombank. The bank is<br />
expected to achieve an after tax profit of VND3,558bn, an asset growth of 20%, and a credit<br />
growth of 17%. With these forecast, the book value of Techcombank by the end of 2012 will<br />
be around VND18,428bn.<br />
Figure 14: P/B Banking sector<br />
3.5<br />
3.0<br />
2.5<br />
2.0<br />
1.5<br />
1.0<br />
0.5<br />
0.0<br />
Jan-09<br />
Mar-09<br />
May-09<br />
Jul-09<br />
Sep-09<br />
Nov-09<br />
Jan-10<br />
Mar-10<br />
May-10<br />
Jul-10<br />
Sep-10<br />
Nov-10<br />
Jan-11<br />
Mar-11<br />
May-11<br />
Jul-11<br />
Sep-11<br />
Nov-11<br />
Jan-12<br />
Mar-12<br />
Source: Bloomberg<br />
See important disclosure at the end of this document<br />
www.vcsc.com.vn | VCSC Viet Capital Securities | 10
All <strong>Report</strong> Types<br />
5 April 2012<br />
<strong>Masan</strong> <strong>Group</strong> Corp. (HSX: MSN)<br />
HOLD<br />
18 March 2011<br />
Applying the benchmark industry average FY12F PB of 1.5x to Techcombank’s estimated<br />
book value of VND18,428bn we arrive at an equity value of VND27,570bn for the bank.<br />
Figure 15: Techcombank’s local banking peers<br />
Market price @ 02/27/12 FY12 BVPS FY12 PB Forward<br />
VND VND (x)<br />
HSX: VCB 28,300 18,607 1.5<br />
HSX: CTG 25,200 13,317 1.9<br />
HNX: ACB 23,600 15,862 1.5<br />
HSX: EIB 17,000 16,114 1.1<br />
HSX: STB 20,500 13,021 1.6<br />
Average 1.5<br />
Source: Techcombank, VCSC estimates<br />
4. Valuation of VCF<br />
Our EV/EBITDA based valuation implies VCF valuation of VND4,446bn valuing MSN’s<br />
stake at VND2,227. VCF valuation of VND4,446bn is based on anticipated EBITDA of<br />
VND367bn in 2012 and an average peer EV/EBITDA multiple of 11.29x.<br />
Figure 16: VCF’s comparable valuation<br />
Company name Country<br />
Mkt Cap<br />
(USD mn) P/E P/B<br />
EV/<br />
EBITDA ROE<br />
Indofood Sukses Indonesia 4,804 14.4 2.3 6.8 21.9<br />
Nestle Malaysia 4,341 28.7 23.3 19.6 72.7<br />
Tata Global India 1,438 28.2 1.8 14.3 6.6<br />
Mayora Indah Indonesia 1,275 28.2 5.4 16.1 27.1<br />
Super <strong>Group</strong> Singapore 726 14.7 2.6 12.0 19.2<br />
Biz Branz Singapore 105 11.4 1.4 4.3 12.6<br />
CCL Products India 39 7.6 0.9 5.7 12.4<br />
Average 1,818 19.0 5.4 11.3 24.6<br />
Source: Bloomberg<br />
Figure 17: VCF’s valuation using EV/EBITDA<br />
VND bn<br />
EBITDA 2012F 367<br />
EV/EBITDA Multiple (x) 11.29<br />
EV 4,148<br />
Add: cash 298<br />
Minus: Debt -<br />
Equity value 4,446<br />
MSN's stake 50.1%<br />
Value attributed to MSN 2,227<br />
Source: VCSC estimates<br />
See important disclosure at the end of this document<br />
www.vcsc.com.vn | VCSC Viet Capital Securities | 11
All <strong>Report</strong> Types<br />
5 April 2012<br />
<strong>Masan</strong> <strong>Group</strong> Corp. (HSX: MSN)<br />
HOLD<br />
18 March 2011<br />
Risks to our valuation<br />
Policy risks. According to Directive 02/CT-TTg issued on January 9 th 2012, the government<br />
has imposed tightened policies upon the mining industry. Several ores are not allowed to be<br />
exported including iron, titan, lead, zinc, chromite, gold, and copper ores. We understand<br />
that <strong>Masan</strong> Resources is selling copper domestically. However, future changes in mining<br />
regulations might affect the company’s business.<br />
See important disclosure at the end of this document<br />
www.vcsc.com.vn | VCSC Viet Capital Securities | 12
All <strong>Report</strong> Types<br />
5 April 2012<br />
<strong>Masan</strong> <strong>Group</strong> Corp. (HSX: MSN)<br />
HOLD<br />
18 March 2011<br />
Analyst Certification<br />
I, Giang Hoang and Phong Nguyen, certify that the views expressed in this report accurately reflect my personal<br />
views about the subject securities or issuers. I also certify that no part of my compensation was, is, or will be,<br />
directly or indirectly, related to the specific recommendations or views expressed in this report. The equity research<br />
analysts responsible for the preparation of this report receive compensation based upon various factors, including<br />
the quality and accuracy of research, client feedback, competitive factors, and overall firm revenues, which include<br />
revenues from, among other business units, Institutional Equities and Investment Banking.<br />
VCSC Rating System and Valuation Methodology<br />
Absolute performance, long term (fundamental) rating key: The recommendation is based on implied<br />
absolute upside/downside for the stock from the target price, defined as (target price – current price)/current price,<br />
and is not related to market performance. This structure applies from 1 November 2010.<br />
Equity rating key<br />
BUY<br />
ADD<br />
HOLD<br />
REDUCE<br />
SELL<br />
NOT RATED<br />
RATING SUSPENDED<br />
Definition<br />
If the target price is 20% higher than the market price<br />
If the target price is 10-20% higher than the market price<br />
If the target price is 10% below or 10% above the market price<br />
If the target price is 10-20% lower than the market price<br />
If the target price is 20% lower than the market price<br />
The company is or may be covered by the Research Department but no rating or<br />
target price is assigned either voluntarily or to comply with applicable regulation<br />
and/or firm policies in certain circumstances, including when VCSC is acting in an<br />
advisory capacity in a merger or strategic transaction involving the company.<br />
The investment rating and target price for this stock have been suspended as there<br />
is not a sufficient fundamental basis for determining an investment rating or target.<br />
The previous investment rating and target price, if any, are no longer in effect for<br />
this stock.<br />
Unless otherwise specified, these performance parameters only reflect capital appreciation and are set with a 12-<br />
month horizon. Future price volatility may cause temporary mismatch between upside/downside for a stock based<br />
on market price and the formal recommendation, thus these performance parameters should be interpreted flexibly.<br />
Small Cap Research: VCSC Research covers companies with a market capitalisation of up to USD50mn,<br />
inclusively. Clients should note that coverage may not be consistent and that VCSC may drop coverage of small<br />
caps at any time without notice.<br />
Target price: In most cases, the target price will equal the analyst's assessment of the current fair value of the<br />
stock. The target price is the level the stock should currently trade at if the market were to accept the analyst's view<br />
of the stock, provided the necessary catalysts were in place to effect this change in perception within the<br />
performance horizon. However, if the analyst doesn't think the market will reassess the stock over the specified<br />
time horizon due to a lack of events or catalysts, then the target price may differ from fair value. In most cases,<br />
therefore, our recommendation is an assessment of the mismatch between current market price and our<br />
assessment of current fair value.<br />
Valuation Methodology: To derive the target price, the analyst may use different valuation methods, including,<br />
but not limited to, discounted free cash-flow and comparative analysis. The selection of methods depends on the<br />
industry, the company, the nature of the stock and other circumstances. Company valuations are based on a single<br />
or a combination of one of the following valuation methods: 1) Multiple-based models (P/E, P/cash flow, EV/sales,<br />
EV/EBIT, EV/EBITA, EV/EBITDA), peer-group comparisons, and historical valuation approaches; 2) Discount<br />
models (DCF, DVMA, DDM); 3) Break-up value approaches or asset-based evaluation methods; and 4)<br />
Economic profit approaches (Residual Income, EVA). Valuation models are dependent on macroeconomic<br />
factors, such as GDP growth, interest rates, exchange rates, raw materials, on other assumptions about the<br />
economy, as well as risks inherent to the company under review. Furthermore, market sentiment may affect the<br />
valuation of companies. Valuations are also based on expectations that might change rapidly and without notice,<br />
depending on developments specific to individual industries.<br />
Risks: Past performance is not necessarily indicative of future results. Foreign currency rates of exchange may<br />
adversely affect the value, price or income of any security or related instrument mentioned in this report. For<br />
investment advice, trade execution or other enquiries, clients should contact their local sales representative.<br />
See important disclosure at the end of this document<br />
www.vcsc.com.vn | VCSC Viet Capital Securities | 13
All <strong>Report</strong> Types<br />
5 April 2012<br />
<strong>Masan</strong> <strong>Group</strong> Corp. (HSX: MSN)<br />
HOLD<br />
18 March 2011<br />
Contacts<br />
Head office<br />
67 Ham Nghi, District 1, HCMC<br />
+84 8 3914 3588<br />
Transaction office<br />
136 Ham Nghi, District 1, HCMC<br />
+84 8 3914 3588<br />
Hanoi branch<br />
109 Tran Hung Dao St, Hoan Kiem District, Hanoi<br />
+84 4 6262 6999<br />
Transaction office<br />
236 - 238 Nguyen Cong Tru, District 1, HCMC<br />
+84 8 3914 3588<br />
Research<br />
Senior Manager – Acting Head of Research<br />
Mr. Tu Vu, ext 105<br />
tu.vu@vcsc.com.vn<br />
Senior Economist, Ms. Hoai Doan, ext 139<br />
Senior Analyst, Ms. Hoa Dinh, ext 140<br />
Senior Analyst, Ms. Phuong Ton, ext 146<br />
Senior Analyst, Ms. Giang Hoang, ext 142<br />
Institutional Sales & Brokerage<br />
& Foreign Individuals<br />
Head of Institutional Sales<br />
Michel Tosto, M.Sc.<br />
+84 8 3914 3588, ext 102<br />
michel.tosto@vcsc.com.vn<br />
Japanese Sales<br />
Tran Minh Hue<br />
+84 8 3914 3588, ext 122<br />
hue.tran@vcsc.com.vn<br />
Research Team<br />
+84 8 3914 3588<br />
research@vcsc.com.vn<br />
Analyst, Ms. Ly Vu, ext 147<br />
Analyst, Mr. Viet Vu, ext 143<br />
Analyst, Mr. Phong Nguyen, ext 120<br />
Analyst, Ms. Duong Pham, ext 130<br />
Analyst, Ms. Chi Luong, ext 145<br />
Vietnamese Sales<br />
Nguyen Quoc Dung<br />
+84 8 3914 3588, ext 136<br />
dung.nguyen@vcsc.com.vn<br />
Retail & Corporate Sales & Brokerage<br />
Ho Chi Minh City<br />
Quynh Chau<br />
+84 8 3914 3588, ext 222<br />
quynh.chau@vcsc.com.vn<br />
Hanoi<br />
Quang Nguyen<br />
+84 4 6262 6999, ext 312<br />
quang.nguyen@vcsc.com.vn<br />
See important disclosure at the end of this document<br />
www.vcsc.com.vn | VCSC Viet Capital Securities | 14
All <strong>Report</strong> Types<br />
5 April 2012<br />
<strong>Masan</strong> <strong>Group</strong> Corp. (HSX: MSN)<br />
HOLD<br />
18 March 2011<br />
History of recommendation<br />
Date Recommendation Closing price Target price<br />
28 July 2011 HOLD VND92,500 VND97,500<br />
18 Nov 2009 HOLD VND41,000 VND44,000<br />
Disclaimer<br />
Copyright 2011 Viet Capital Securities Company. All rights reserved. This report has been prepared on the basis of<br />
information believed to be reliable at the time of publication. VCSC makes no representation or warranty regarding<br />
the completeness and accuracy of such information. Opinions, estimates and projection expressed in this report<br />
represent the current views of the author at the date of publication only. They do not necessarily reflect the opinions<br />
of VCSC and are subject to change without notice. This report is provided, for information purposes only, to<br />
institutional investor and retail clients of VCSC, and does not constitute an offer or solicitation to buy or sell any<br />
securities discussed herein in any jurisdiction. Investors must make their investment decisions based upon<br />
independent advice subject to their particular financial situation and investment objectives. This report may not be<br />
copied, reproduced, published or redistributed by any person for any purpose without the written permission of an<br />
authorized representative of VCSC. Please cite sources when quoting.<br />
See important disclosure at the end of this document<br />
www.vcsc.com.vn | VCSC Viet Capital Securities | 15