Older Americans Act Title III Services Target the Most Vulnerable ...
Older Americans Act Title III Services Target the Most Vulnerable ...
Older Americans Act Title III Services Target the Most Vulnerable ...

Create successful ePaper yourself
Turn your PDF publications into a flip-book with our unique Google optimized e-Paper software.
Putting Data to Work for <strong>Older</strong> People<br />
RESEARCH BRIEF NUMBER 2 • AUGUST 2010<br />
OAA <strong>Title</strong> <strong>III</strong> <strong>Services</strong> <strong>Target</strong> <strong>the</strong><br />
<strong>Most</strong> <strong>Vulnerable</strong> Elderly in <strong>the</strong> United States<br />
by Allison Barrett and Jody Schimmel, Ma<strong>the</strong>matica Policy Research<br />
Since <strong>the</strong> <strong>Older</strong> <strong>Americans</strong> <strong>Act</strong> (OAA) was passed in 1965, <strong>the</strong> Administration on Aging (AoA) has provided elderly<br />
<strong>Americans</strong> with home and community-based services to help <strong>the</strong>m maintain <strong>the</strong>ir independence and remain in <strong>the</strong>ir<br />
own homes for as long as possible. Through its “Aging <strong>Services</strong> Network” including State Units on Aging (SUAs), Area<br />
Agencies on Aging (AAAs), and tribal partners, AoA works to provide an array of services designed to alleviate <strong>the</strong><br />
difficulties in performing daily activities that frail, ill elders experience. This brief, <strong>the</strong> second in a series that presents<br />
findings from AoA‘s National Survey of OAA Program Participants, compares <strong>the</strong> health and physical functioning of<br />
elderly adults who receive <strong>Title</strong> <strong>III</strong> services (“<strong>Title</strong> <strong>III</strong> participants”) to that of older adults across <strong>the</strong> United States who<br />
meet <strong>the</strong> age criteria for <strong>Title</strong> <strong>III</strong> services. Our analysis takes into account differences in <strong>the</strong> demographic profile and<br />
socioeconomic status of <strong>Title</strong> <strong>III</strong> participants relative to older adults nationwide.<br />
Background<br />
In passing <strong>the</strong> OAA, Congress sought to ensure that <strong>the</strong><br />
nation’s most vulnerable elderly adults would have <strong>the</strong><br />
services <strong>the</strong>y need to remain independent in <strong>the</strong>ir communities.<br />
<strong>Title</strong> <strong>III</strong> participants are known to be among<br />
<strong>the</strong> “oldest-old” compared to o<strong>the</strong>rs in <strong>the</strong> national<br />
population who are also age 60 and older (Altshuler<br />
and Schimmel 2010). They are also more likely than<br />
older adults nationwide to be female, non-white, to<br />
have less than a high school education, and to live in<br />
poverty. These characteristics are often associated with<br />
worse health and diminished physical functioning, so<br />
it is difficult to know whe<strong>the</strong>r <strong>the</strong> differences in health<br />
and functioning that have been observed between<br />
<strong>Title</strong> <strong>III</strong> participants and o<strong>the</strong>r older adults arise solely<br />
because participants are concentrated within certain<br />
demographic and socioeconomic groups, or because<br />
<strong>the</strong>ir health is poor even in comparison with o<strong>the</strong>r older<br />
adults who are similar to <strong>the</strong>m.<br />
To help AoA understand how well-targeted OAA’s <strong>Title</strong><br />
<strong>III</strong> services are, we used data from <strong>the</strong> Fourth National<br />
Survey of OAA Program Participants and from <strong>the</strong><br />
Health and Retirement Study (HRS) to compare <strong>the</strong><br />
health and physical functioning of <strong>Title</strong> <strong>III</strong> participants<br />
to that which would be expected if <strong>the</strong> health and physical<br />
functioning of <strong>Title</strong> <strong>III</strong> participants matched older<br />
adults with similar demographic and socioeconomic<br />
characteristics nationwide (see Methods section).<br />
What Is The Aging Ser vices Network?<br />
The Aging <strong>Services</strong> Network provides a range of<br />
community-based services—home-delivered and<br />
congregate meals, case management, transportation,<br />
and homemaker and caregiver support. Such<br />
services enhance both <strong>the</strong> quality of life and social<br />
interaction, and reduce <strong>the</strong> effects of disability for<br />
homebound and more active seniors. Funded under<br />
<strong>Title</strong> <strong>III</strong> of <strong>the</strong> OAA, services are available to individuals<br />
age 60 and older, though delivery is targeted<br />
to <strong>the</strong> most vulnerable elderly.<br />
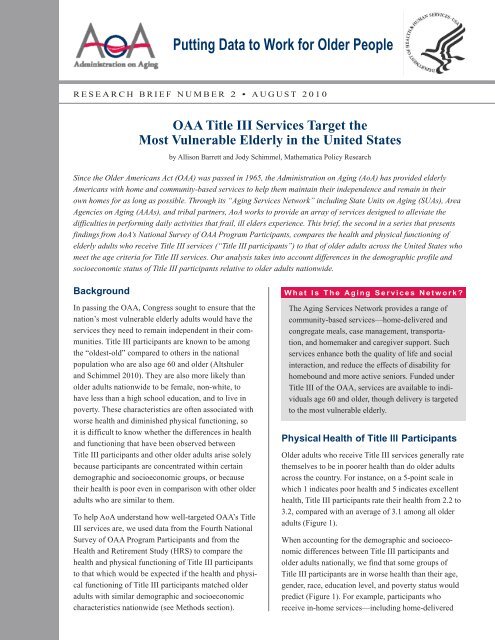
Physical Health of <strong>Title</strong> lll Participants<br />
<strong>Older</strong> adults who receive <strong>Title</strong> <strong>III</strong> services generally rate<br />
<strong>the</strong>mselves to be in poorer health than do older adults<br />
across <strong>the</strong> country. For instance, on a 5-point scale in<br />
which 1 indicates poor health and 5 indicates excellent<br />
health, <strong>Title</strong> <strong>III</strong> participants rate <strong>the</strong>ir health from 2.2 to<br />
3.2, compared with an average of 3.1 among all older<br />
adults (Figure 1).<br />
When accounting for <strong>the</strong> demographic and socioeconomic<br />
differences between <strong>Title</strong> <strong>III</strong> participants and<br />
older adults nationally, we find that some groups of<br />
<strong>Title</strong> <strong>III</strong> participants are in worse health than <strong>the</strong>ir age,<br />
gender, race, education level, and poverty status would<br />
predict (Figure 1). For example, participants who<br />
receive in-home services—including home-delivered
Figure 1: Reported and Expected Self-Rated Health<br />
Status of <strong>Title</strong> lll Participants<br />
Case<br />
2.3<br />
management<br />
2.7<br />
Congregate<br />
meals<br />
Home-delivered<br />
meals<br />
Homemaker<br />
services<br />
Transportation<br />
services<br />
U.S. adults<br />
age 60 and older<br />
Poor<br />
(1)<br />
Fair<br />
(2)<br />
2.2<br />
2.5<br />
• Reported<br />
2.9<br />
2.8<br />
2.8<br />
2.8<br />
2.8<br />
Good<br />
(3)<br />
3.2<br />
3.1<br />
Very<br />
Good<br />
(4)<br />
• Expected<br />
Excellent<br />
(5)<br />
Source: Fourth National Survey of OAA Program Participants (2008)<br />
and 2008 HRS.<br />
Note: Health is rated on a scale in which 1 is poor and 5 is excellent.<br />
meals, case management, and homemaker services—rate<br />
<strong>the</strong>ir health 10 to 20 percent lower than what would be<br />
expected given <strong>the</strong>ir demographic and socioeconomic<br />
characteristics. On <strong>the</strong> o<strong>the</strong>r hand, participants who<br />
receive congregate meals say that <strong>the</strong>y are in better<br />
health than <strong>the</strong>ir demographics and socioeconomic<br />
status would predict, while those who receive transportation<br />
services rate <strong>the</strong>ir health at about what would be<br />
expected, given <strong>the</strong>ir individual characteristics.<br />
The difference between reported and expected self-rated<br />
health is confirmed by more objective measures of health<br />
status, such as receiving a doctor’s diagnosis of certain<br />
health conditions (Table 1). Compared to all elderly adults<br />
in <strong>the</strong> United States, a larger share of <strong>Title</strong> <strong>III</strong> participants<br />
report that a doctor ever told <strong>the</strong>m that <strong>the</strong>y had<br />
a heart condition; breathing or lung condition; diabetes or<br />
high blood sugar; stroke; or memory-related disease.<br />
After accounting for <strong>Title</strong> <strong>III</strong> participant characteristics,<br />
participants in most programs are still more likely to have<br />
diagnosed health conditions than <strong>the</strong>ir characteristics<br />
would predict. If we look at diabetes, for example, based<br />
on <strong>the</strong> demographics and socioeconomic status of <strong>Title</strong> <strong>III</strong><br />
participants, we would expect <strong>the</strong> proportion of participants<br />
ever diagnosed with diabetes to range from 23 to 25<br />
percent. In actuality though, 26 to 35 percent of participants<br />
reported having been diagnosed with this condition.<br />
Expected levels of heart conditions, breathing or lung<br />
conditions, and diabetes fall below reported levels across<br />
all participant groups. Participants receiving in-home services<br />
also reported higher-than-expected levels of stroke<br />
and memory-related disease, while participants in <strong>the</strong><br />
transportation services and congregate meals programs<br />
reported lower-than-expected levels of <strong>the</strong>se conditions,<br />
given <strong>the</strong>ir characteristics.<br />
Functional Status of <strong>Title</strong> lll Participants<br />
A person’s ability to continue to live in his or her own<br />
home depends in part on how much difficulty <strong>the</strong>y have<br />
performing activities of daily living (ADLs), such as<br />
bathing or using <strong>the</strong> toilet, as well as any difficulty <strong>the</strong>y<br />
have completing instrumental activities of daily living<br />
(IADLs), such as preparing meals or taking medications.<br />
The average number of ADL difficulties reported by <strong>Title</strong><br />
<strong>III</strong> participants is much higher than <strong>the</strong> number reported<br />
by <strong>the</strong> national population of older adults (Figure 2).<br />
For example, <strong>Title</strong> <strong>III</strong> participants who receive in-home<br />
services report difficulty with an average of two of six<br />
ADLs—five times as many as <strong>the</strong> average among older<br />
adults nationally (0.4 of six ADLs).<br />
The difference in demographic and socioeconomic<br />
characteristics among <strong>Title</strong> <strong>III</strong> participants compared<br />
with o<strong>the</strong>r older adults only partially explains <strong>the</strong> higher<br />
number of reported ADL difficulties among participants.<br />
For instance, given <strong>the</strong>ir age, gender, race, education, and<br />
poverty level, <strong>the</strong> participants who receive home-delivered<br />
meals have difficulty with almost triple <strong>the</strong> number<br />
of ADLs than what would be expected. This level of difficulty<br />
is similar to <strong>the</strong> expected level among case management<br />
and homemaker services participants. On <strong>the</strong> o<strong>the</strong>r<br />
hand, <strong>the</strong> average number of ADL difficulties among<br />
participants who receive congregate meals and transportation<br />
services is about what we would expect to see, given<br />
<strong>the</strong>ir demographic and socioeconomic characteristics.<br />
IADL difficulties are also reported more often by <strong>Title</strong> <strong>III</strong><br />
participants than would be expected given <strong>the</strong>ir individual<br />
characteristics (not shown). When considering difficulty<br />
with preparing meals, taking medications, shopping, using<br />
<strong>the</strong> telephone, and managing money, <strong>Title</strong> <strong>III</strong> participants<br />
report difficulty with anywhere from 0.5 IADLs (those<br />
who received congregate meals) to 1.5 IADLs (those who
Table 1 Arthritis or Rheumatism: Reported Versus Expected Percentages of <strong>Title</strong> lll Participants<br />
with a Doctor’s Diagnosis of Various Conditions (Percentage of AoA Clients by <strong>Services</strong> Received)<br />
U.S. Adults Age Case Congregate Home-delivered Homemaker Transportation<br />
Arthritis or 60 and <strong>Older</strong> management meals<br />
meals services <strong>Services</strong><br />
Rheumatism<br />
(%)<br />
(%)<br />
(%)<br />
(%)<br />
(%)<br />
(%)<br />
Reported 66.9 75.3 56.7 64.6 78.1 69.6<br />
Expected N/A 76.6 74.5 76.2 78.4 77.5<br />
Table 1 Heart Condition: Reported Versus Expected Percentages of <strong>Title</strong> lll Participants with a<br />
Doctor’s Diagnosis of Various Conditions (Percentage of AoA Clients by <strong>Services</strong> Received)<br />
Heart<br />
Condition<br />
U.S. Adults Age<br />
60 and <strong>Older</strong><br />
(%)<br />
Case<br />
management<br />
(%)<br />
Congregate<br />
meals<br />
(%)<br />
Home-delivered<br />
meals<br />
(%)<br />
Homemaker<br />
services<br />
(%)<br />
Transportation<br />
<strong>Services</strong><br />
(%)<br />
Reported 28.6 44.8 33.9 43.1 52.8 39.4<br />
Expected N/A 37.3 34.4 38.1 37.0 35.1<br />
Table 1 Breathing or Lung Condition: Reported Versus Expected Percentages of <strong>Title</strong> lll Participants<br />
with a Doctor’s Diagnosis of Various Conditions (Percentage of AoA Clients by <strong>Services</strong> Received)<br />
U.S. Adults Age Case Congregate Home-delivered Homemaker Transportation<br />
Breathing or 60 and <strong>Older</strong> management meals<br />
meals services <strong>Services</strong><br />
Lung Condition (%)<br />
(%)<br />
(%)<br />
(%)<br />
(%)<br />
(%)<br />
Reported 11.9 49.3 32.1 41.7 42.2 42.2<br />
Expected N/A 17.0 14.8 14.6 15.4 15.5<br />
Table 1 Diabetes or High Blood Sugar: Reported Versus Expected Percentages of <strong>Title</strong> lll<br />
Participants with a Doctor’s Diagnosis of Various Conditions (Percentage of AoA Clients by<br />
<strong>Services</strong> Received)<br />
U.S. Adults Age Case Congregate Home-delivered Homemaker Transportation<br />
Diabetes or high 60 and <strong>Older</strong> management meals<br />
meals services <strong>Services</strong><br />
blood sugar (%)<br />
(%)<br />
(%)<br />
(%)<br />
(%)<br />
(%)<br />
Reported 22.2 25.6 26.8 35.0 32.8 32.4<br />
Expected N/A 24.3 22.7 23.7 24.8 23.8
Table 1 Stroke: Reported Versus Expected Percentages of <strong>Title</strong> lll Participants with a Doctor’s<br />
Diagnosis of Various Conditions (Percentage of AoA Clients by <strong>Services</strong> Received)<br />
U.S. Adults Age Case Congregate Home-delivered Homemaker Transportation<br />
60 and <strong>Older</strong> management meals<br />
meals services <strong>Services</strong><br />
Stroke<br />
(%)<br />
(%)<br />
(%)<br />
(%)<br />
(%)<br />
(%)<br />
Reported 9.7 23.1 10.9 23.2 23.9 13.1<br />
Expected N/A 15.8 13.8 16.6 16.8 14.4<br />
Table 1 Memory-Related Disease: Reported Versus Expected Percentages of <strong>Title</strong> lll Participants<br />
with a Doctor’s Diagnosis of Various Conditions (Percentage of AoA Clients by <strong>Services</strong> Received)<br />
U.S. Adults Age Case Congregate Home-delivered Homemaker Transportation<br />
Memory-related 60 and <strong>Older</strong> management meals<br />
meals services <strong>Services</strong><br />
disease<br />
(%)<br />
(%)<br />
(%)<br />
(%)<br />
(%)<br />
(%)<br />
Reported 4.8 12.2 5.7 12.2 16.9 5.7<br />
Expected N/A 8.1 6.1 8.1 8.9 7.4<br />
Source: Fourth National Survey of OAA Program Participants (2008) and 2008 HRS.<br />
Note: The Fourth National Survey and <strong>the</strong> HRS both ask respondents if a doctor has ever diagnosed <strong>the</strong>m with each of <strong>the</strong> conditions reported above.<br />
With <strong>the</strong> exception of a lung condition, <strong>the</strong> question wording in both surveys is comparable, so that difference in <strong>the</strong> proportion with a diagnosis<br />
between <strong>the</strong> surveys is likely not due to survey design. However, <strong>the</strong> HRS explicitly includes asthma as a lung condition, while <strong>the</strong> Fourth National<br />
Survey does not. Despite this difference, <strong>the</strong> actual rates reported in <strong>the</strong> surveys are still higher among <strong>Title</strong> <strong>III</strong> participants, but <strong>the</strong> expected rates for<br />
a lung condition for participants in each <strong>Title</strong> <strong>III</strong> service are higher than <strong>the</strong>y would be if <strong>the</strong> Fourth National Survey data excluded asthma.<br />
receive homemaker services or home-delivered meals).<br />
Accounting for <strong>the</strong> demographics and socioeconomic<br />
status of <strong>Title</strong> <strong>III</strong> participants yields an expected number<br />
of IADL difficulties ranging from 0.4 to 0.7, indicating<br />
that participants have more IADL limitations than <strong>the</strong>ir<br />
characteristics predict.<br />
Conclusions and Implications<br />
<strong>Title</strong> <strong>III</strong> participants are not as healthy as older adults<br />
nationally, nor do <strong>the</strong>y function as well physically.<br />
Some of <strong>the</strong> observed differences in health and physical<br />
functioning are explained by <strong>the</strong> demographic and<br />
socioeconomic profile of <strong>Title</strong> <strong>III</strong> participants compared<br />
with all older adults. However, even after demographic<br />
and socioeconomic differences are accounted for, we<br />
still find that <strong>Title</strong> <strong>III</strong> participants who receive in-home<br />
services—those in <strong>the</strong> home-delivered meals, case management,<br />
and homemaker services programs—tend to be<br />
less healthy and more limited than o<strong>the</strong>r older adults.<br />
Much of <strong>the</strong> difference in health and functional status<br />
across <strong>Title</strong> <strong>III</strong> programs can likely be explained by <strong>the</strong><br />
services offered by each program attracting a different<br />
pool of participants. For example, because home-delivered<br />
meals and homemaker services target <strong>the</strong> homebound,<br />
clients receiving <strong>the</strong>se services are more likely<br />
to have multiple functional limitations and lower overall<br />
health status. Despite <strong>the</strong> differences between participants<br />
in each program, it is clear from our findings that<br />
<strong>Title</strong> <strong>III</strong> services are indeed reaching <strong>the</strong> most vulnerable<br />
elderly people in <strong>the</strong> nation—those most in need of<br />
services to remain independent.<br />
Data Sources<br />
Information on <strong>Title</strong> <strong>III</strong> participants was drawn from <strong>the</strong><br />
Fourth National Survey of OAA Program Participants.<br />
This survey was conducted in 2008 by Westat Inc., via<br />
telephone, and administered to more than 5,000 individuals<br />
who reported receiving <strong>Title</strong> <strong>III</strong> services. The survey used a<br />
two-stage sample design, first selecting a sample of AAAs,<br />
<strong>the</strong>n randomly sampling participants from each selected<br />
AAA by service type. The number of participants selected<br />
from each AAA was proportional to <strong>the</strong> number of partici-
Figure 2: Reported and Expected Number of ADL<br />
Difficulties Among <strong>Title</strong> lll Participants<br />
Case 2.0<br />
management<br />
0.7<br />
Congregate 0.6<br />
meals 0.6<br />
Home-delivered 1.9<br />
meals<br />
0.7<br />
Homemaker 2.0<br />
services<br />
0.8<br />
Transportation 1.0<br />
services<br />
0.7<br />
U.S. adults<br />
age 60 and older<br />
0.4<br />
0 1 2 3 4 5 6<br />
Average Number of ADL Difficulties<br />
• Reported<br />
• Expected<br />
Source: Fourth National Survey of OAA Program Participants (2008)<br />
and 2008 HRS.<br />
Note: Average calculated based on reported difficulties with six ADLs:<br />
eating, dressing, bathing, toileting, walking short distances, and getting<br />
into and out of bed.<br />
pants served in that particular service by <strong>the</strong> sampled AAA.<br />
All analyses in this brief apply sample weights to account<br />
for this design. Additional data and more detailed documentation<br />
for <strong>the</strong> Fourth National Survey and o<strong>the</strong>r AoA<br />
data sources are available on <strong>the</strong> new interactive AGing<br />
Integrated Database (AGID) at http://data.aoa.gov.<br />
Participants in five of <strong>the</strong> service types included in <strong>the</strong><br />
survey are reported in this brief: home-delivered meals<br />
(916 respondents), homemaker services (407 respondents),<br />
transportation services (817 respondents), congregate<br />
meals (861 respondents), and case management<br />
(455 respondents). Participants in this brief are categorized<br />
as program participants based on <strong>the</strong> program for<br />
which <strong>the</strong>y were surveyed, but in many cases, individuals<br />
receive services from multiple OAA programs.<br />
Health and physical functioning characteristics of <strong>the</strong><br />
national population of older adults, used to calculate <strong>the</strong><br />
expected health measures of <strong>Title</strong> <strong>III</strong> participants, were<br />
drawn from <strong>the</strong> HRS, a nationally representative panel<br />
survey of <strong>the</strong> non-institutionalized United States population<br />
over <strong>the</strong> age of 50 funded by <strong>the</strong> National Institute<br />
on Aging (NIA) and <strong>the</strong> Social Security Administration<br />
(SSA). The HRS data used in this brief are based on<br />
respondents to <strong>the</strong> 2008 survey wave who were age 60<br />
and older and were residing in <strong>the</strong> community at <strong>the</strong><br />
time of <strong>the</strong> interview. These data were extracted from<br />
RAND’s analytic file from <strong>the</strong> HRS, available at http://<br />
hrsonline.isr.umich.edu.<br />
Methods<br />
To derive <strong>the</strong> expected values of health and functioning<br />
reported in <strong>the</strong> brief, we used indirect standardization.<br />
To do this, we calculated health and functional status<br />
values using <strong>the</strong> HRS for each combination of age, gender,<br />
race, educational attainment, and poverty category.<br />
The resulting cell means were <strong>the</strong>n assigned to <strong>Title</strong><br />
<strong>III</strong> participants in <strong>the</strong> same demographic and socioeconomic<br />
categories. The value obtained after indirect<br />
standardization indicates what would be expected if <strong>Title</strong><br />
<strong>III</strong> participants had <strong>the</strong> same health and functional status<br />
as those in <strong>the</strong> national population who share <strong>the</strong> same<br />
age, gender, race, educational attainment, and poverty<br />
status. Overall averages were obtained by aggregating<br />
across <strong>the</strong> constructed cells in proportion to each cell’s<br />
weight in <strong>the</strong> overall <strong>Title</strong> <strong>III</strong> service group.<br />
The categories used to construct <strong>the</strong> cells for indirect<br />
standardization were (1) age, using five-year intervals<br />
between 60 and 85, with a separate category for everyone<br />
85 years or older; (2) gender; (3) race, with a category for<br />
non-Hispanic white and one for Hispanic and/or nonwhite;<br />
(4) education, measured as more or less than a high<br />
school diploma; and (5) income relative to <strong>the</strong> federal<br />
poverty level (FPL). Because income was collected categorically<br />
in <strong>the</strong> Fourth National Survey, it was impossible<br />
to precisely determine poverty status in some cases.<br />
Using respondents’ reported income category, household<br />
size, and <strong>the</strong> 2008 DHHS poverty guidelines, respondents<br />
were classified as definitely in poverty (reported income<br />
category below 100 percent of <strong>the</strong> FPL), definitely not<br />
in poverty (reported income category above 100 percent<br />
of <strong>the</strong> FPL), or possibly in poverty (reported income category<br />
included values below and above <strong>the</strong> FPL). A comparable<br />
value was created for HRS survey respondents<br />
using reported income (adjusted for inflation between<br />
<strong>the</strong> survey years) and household size. In <strong>the</strong> minority of<br />
cases in which income or household size was not available<br />
for <strong>the</strong> construction of poverty, standardization was<br />
performed using <strong>the</strong> remaining available measures.
Reference<br />
Altshuler, N., and J. Schimmel. “Aging in Place: Do<br />
<strong>Older</strong> <strong>Americans</strong> <strong>Act</strong> <strong>Title</strong> <strong>III</strong> <strong>Services</strong> Reach Those<br />
<strong>Most</strong> Likely to Enter Nursing Homes?” Washington,<br />
DC: Ma<strong>the</strong>matica Policy Research, July 2010.<br />
About This Series<br />
This series is funded by AoA, and presents analyses<br />
conducted by Ma<strong>the</strong>matica Policy Research using<br />
data from AoA’s National Surveys of Program<br />
Participants. These surveys collect information<br />
from <strong>Title</strong> <strong>III</strong> participants about <strong>the</strong>ir demographics,<br />
socioeconomic status, health, and functioning, as<br />
well as <strong>the</strong>ir service use and client-reported service<br />
impact and quality.<br />
For more information about this study, please contact<br />
Jody Schimmel, senior researcher at Ma<strong>the</strong>matica,<br />
jschimmel@ma<strong>the</strong>matica-mpr.com.<br />
Visit our website at http://results.aoa.gov