Security Effectiveness Framework Study
Security Effectiveness Framework Study
Security Effectiveness Framework Study

Create successful ePaper yourself
Turn your PDF publications into a flip-book with our unique Google optimized e-Paper software.
<strong>Security</strong> <strong>Effectiveness</strong> <strong>Framework</strong> study<br />
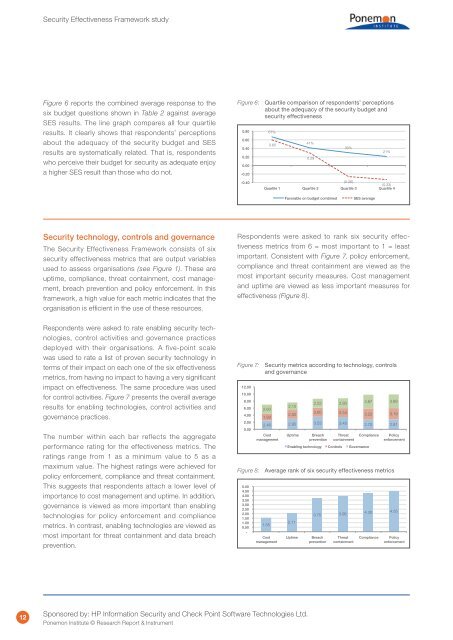
Figure 6 reports the combined average response to the<br />
six budget questions shown in Table 2 against average<br />
SES results. The line graph compares all four quartile<br />
results. It clearly shows that respondents’ perceptions<br />
about the adequacy of the security budget and SES<br />
results are systematically related. That is, respondents<br />
who perceive their budget for security as adequate enjoy<br />
a higher SES result than those who do not.<br />
Figure 6: Quartile comparison of respondents’ perceptions<br />
about the adequacy of the security budget and<br />
security effectiveness<br />
0.80<br />
0.60<br />
0.40<br />
0.20<br />
0.00<br />
-0.20<br />
67%<br />
0.60<br />
41%<br />
0.29<br />
30%<br />
21%<br />
-0.40<br />
(0.26)<br />
(0.33)<br />
Quartile 1 Quartile 2 Quartile 3 Quartile 4<br />
Favorable on budget combined<br />
SES average<br />
<strong>Security</strong> technology, controls and governance<br />
The <strong>Security</strong> <strong>Effectiveness</strong> <strong>Framework</strong> consists of six<br />
security effectiveness metrics that are output variables<br />
used to assess organisations (see Figure 1). These are<br />
uptime, compliance, threat containment, cost management,<br />
breach prevention and policy enforcement. In this<br />
framework, a high value for each metric indicates that the<br />
organisation is efficient in the use of these resources.<br />
Respondents were asked to rank six security effectiveness<br />
metrics from 6 = most important to 1 = least<br />
important. Consistent with Figure 7, policy enforcement,<br />
compliance and threat containment are viewed as the<br />
most important security measures. Cost management<br />
and uptime are viewed as less important measures for<br />
effectiveness (Figure 8).<br />
Respondents were asked to rate enabling security technologies,<br />
control activities and governance practices<br />
deployed with their organisations. A five-point scale<br />
was used to rate a list of proven security technology in<br />
terms of their impact on each one of the six effectiveness<br />
metrics, from having no impact to having a very significant<br />
impact on effectiveness. The same procedure was used<br />
for control activities. Figure 7 presents the overall average<br />
results for enabling technologies, control activities and<br />
governance practices.<br />
The number within each bar reflects the aggregate<br />
performance rating for the effectiveness metrics. The<br />
ratings range from 1 as a minimum value to 5 as a<br />
maximum value. The highest ratings were achieved for<br />
policy enforcement, compliance and threat containment.<br />
This suggests that respondents attach a lower level of<br />
importance to cost management and uptime. In addition,<br />
governance is viewed as more important than enabling<br />
technologies for policy enforcement and compliance<br />
metrics. In contrast, enabling technologies are viewed as<br />
most important for threat containment and data breach<br />
prevention.<br />
Figure 7: <strong>Security</strong> metrics according to technology, controls<br />
and governance<br />
12.00<br />
10.00<br />
12.00<br />
8.00<br />
10.00<br />
6.00<br />
8.00<br />
4.00<br />
6.00<br />
2.00<br />
4.00<br />
0.00<br />
2.00<br />
0.00<br />
5.00<br />
4.50<br />
4.00<br />
3.50 5.00<br />
3.00 4.50<br />
2.50 4.00<br />
2.00 3.50<br />
1.50 3.00<br />
1.00 2.50<br />
0.50 2.00<br />
1.50 -<br />
1.00<br />
0.50<br />
-<br />
2.52 2.80<br />
3.87 3.89<br />
2.15<br />
2.60<br />
2.60 2.52 2.80<br />
3.87 3.89<br />
2.50<br />
2.54 3.22 3.19<br />
1.93 2.15<br />
2.60<br />
2.46 2.95 3.53 2.60 3.45<br />
2.50<br />
2.54 2.70 3.22 2.81 3.19<br />
1.93<br />
Cost 2.46 Uptime 2.95 Breach 3.53 Threat 3.45 Compliance 2.70 Policy 2.81<br />
management<br />
prevention containment<br />
enforcement<br />
Cost<br />
management<br />
1.55<br />
Cost 1.55<br />
management<br />
Cost<br />
management<br />
Enabling Uptime technology Breach ControlsThreat<br />
Governance Compliance<br />
prevention containment<br />
Enabling technology Controls Governance<br />
2.11<br />
Uptime 2.11<br />
Uptime<br />
Policy<br />
enforcement<br />
Figure 8: Average rank of six security effectiveness metrics<br />
3.75 3.96 4.30 4.55<br />
3.75 3.96 4.30 4.55<br />
Breach<br />
prevention<br />
Breach<br />
prevention<br />
Threat<br />
containment<br />
Threat<br />
containment<br />
Compliance<br />
Compliance<br />
Policy<br />
enforcement<br />
Policy<br />
enforcement<br />
12<br />
Sponsored by: HP Information <strong>Security</strong> and Check Point Software Technologies Ltd.<br />
Ponemon Institute © Research Report & Instrument