Security Effectiveness Framework Study
Security Effectiveness Framework Study
Security Effectiveness Framework Study

Create successful ePaper yourself
Turn your PDF publications into a flip-book with our unique Google optimized e-Paper software.
<strong>Security</strong> <strong>Effectiveness</strong> <strong>Framework</strong> study<br />
21%<br />
technologies<br />
Controls<br />
Governance<br />
18%<br />
18%<br />
Budget<br />
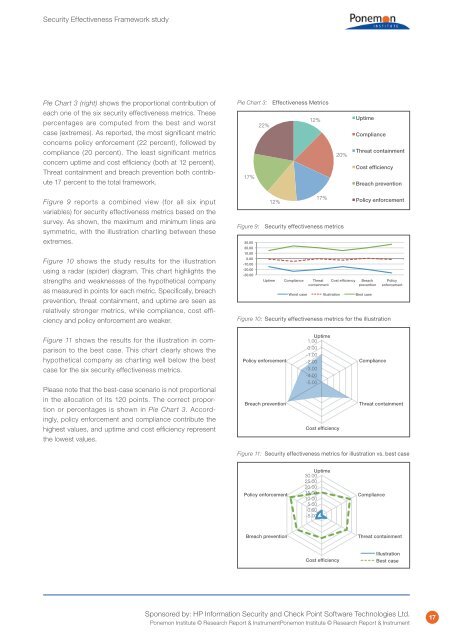
Pie Chart 3 (right) shows the proportional contribution of<br />
each one of the six security effectiveness metrics. These<br />
percentages are computed from the best and worst<br />
case (extremes). As reported, the most significant metric<br />
concerns policy enforcement (22 percent), followed by<br />
compliance (20 percent). The least significant metrics<br />
concern uptime and cost efficiency (both at 12 percent).<br />
Threat containment and breach prevention both contribute<br />
17 percent to the total framework.<br />
Pie Chart 3: <strong>Effectiveness</strong> Metrics<br />
12%<br />
22%<br />
17%<br />
20%<br />
Uptime<br />
Compliance<br />
Threat containment<br />
Cost efficiency<br />
Breach prevention<br />
Figure 9 reports a combined view (for all six input<br />
variables) for security effectiveness metrics based on the<br />
survey. As shown, the maximum and minimum lines are<br />
symmetric, with the illustration charting between these<br />
extremes.<br />
Figure 10 shows the study results for the illustration<br />
using a radar (spider) diagram. This chart highlights the<br />
strengths and weaknesses of the hypothetical company<br />
as measured in points for each metric. Specifically, breach<br />
prevention, threat containment, and uptime are seen as<br />
relatively stronger metrics, while compliance, cost efficiency<br />
and policy enforcement are weaker.<br />
Figure 11 shows the results for the illustration in comparison<br />
to the best case. This chart clearly shows the<br />
hypothetical company as charting well below the best<br />
case for the six security effectiveness metrics.<br />
Please note that the best-case scenario is not proportional<br />
in the allocation of its 120 points. The correct proportion<br />
or percentages is shown in Pie Chart 3. Accordingly,<br />
policy enforcement and compliance contribute the<br />
highest values, and uptime and cost efficiency represent<br />
the lowest values.<br />
30.00<br />
20.00<br />
10.00<br />
0.00<br />
-10.00<br />
-20.00<br />
-30.00<br />
12%<br />
17%<br />
Figure 9: <strong>Security</strong> effectiveness metrics<br />
Uptime Compliance Threat Cost efficiency<br />
containment<br />
Policy enforcement<br />
Breach<br />
prevention<br />
Worst case Illustration Best case<br />
Policy<br />
enforcement<br />
Figure 10: <strong>Security</strong> effectiveness metrics for the illustration<br />
1.00 Uptime<br />
0.00<br />
Policy enforcement<br />
-1.00<br />
1.00 Uptime<br />
-2.00<br />
0.00<br />
-1.00<br />
-3.00<br />
Compliance<br />
Policy enforcement -2.00<br />
-4.00<br />
Compliance<br />
-3.00<br />
-5.00<br />
-4.00<br />
-5.00<br />
Breach prevention<br />
Threat containment<br />
Breach prevention<br />
Cost efficiency<br />
Cost efficiency<br />
Threat containment<br />
Figure 11: <strong>Security</strong> effectiveness metrics for illustration vs. best case<br />
Policy enforcement<br />
Policy enforcement<br />
Breach prevention<br />
30.00 Uptime<br />
25.00<br />
20.00<br />
30.00 Uptime 15.00<br />
Compliance<br />
10.00 25.00<br />
20.00 5.00<br />
15.00 0.00<br />
Compliance<br />
10.00 -5.00<br />
5.00<br />
0.00<br />
-5.00<br />
Threat containment<br />
Breach prevention<br />
Cost efficiency<br />
Cost efficiency<br />
Threat containment<br />
Illustration<br />
Best case<br />
Illustration<br />
Best case<br />
Sponsored by: HP Information <strong>Security</strong> and Check Point Software Technologies Ltd.<br />
Ponemon Institute © Research Report & InstrumentPonemon Institute © Research Report & Instrument<br />
17